Influence of the Services Marketing Mix and Place Branding on Tourism Destination Image*
Influencia del Marketing Mix de servicios y la marca de lugar en la imagen del destino turístico
Received: October 28, 2020
Accepted: February 03, 2021
Vidyastuti, H. A. (2021). Influence of the Services Marketing Mix and Place Branding on Tourism Destination Image. Revista CEA, v. 7, n. 14. e1646. https://doi.org/10.22430/24223182.1646
Abstract
The aim of this study is to establish if concepts such as the Services Marketing Mix and Place Branding have any influence on Tourism Destination Image. Therefore, it adopted a quantitative cross-sectional exploratory methodology. The average annual population of tourists in Garut District, Indonesia, is 231,563; and, using Slovin’s formula, a sample size of 100 visitors was calculated. To determine if the items used here to measure the variables of the Services Marketing Mix, Place Branding, and Image were reliable and valid, a Pearson correlation test was conducted. Structural equation modeling was implemented to verify the relationships between the variables. The results indicate that neither the Services Marketing Mix nor Place Branding have any influence on the concept of Tourism Destination Image. Therefore, the strategies designed to improve the image of this tourist destination should be focused on other aspects.
Keywords: marketing mix services, place branding, tourism.
JEL Classification: L83, M31.
Highlights
Resumen
El propósito de este artículo fue el de identificar si conceptos como el Marketing Mix Service y el Place Branding tienen alguna influencia sobre Imagen, para lo cual se utilizó una metodología de tipo cuantitativa, transversal y con alcance exploratorio. Con una población de turistas de 231563 en promedio, por año, y haciendo uso de la fórmula de Slovin, se obtuvo un tamaño de muestra de 100 visitantes. Para determinar si los ítems utilizados para medir las variables de Marketing Mix Service, Place Branding and Imagen eran confiables y válidos, se hizo uso del test de correlación de Pearson (resultados iguales o por encima de 0.3 son aceptables). Para verificar las relaciones entre las variables, se hizo uso de la metodología de ecuaciones estructurales. Los resultados indicaron que ni el Marketing Mix Service ni el Place Branding tienen influencia alguna sobre el concepto de Imagen. Por tanto, las estrategias para impactar positivamente la imagen del destino turístico deben estar orientadas por otras líneas de trabajo.
Palabras clave: Marketing Mix de servicios, marca de lugar, turismo.
Clasificación JEL: L83, M31.
Highlights
1. INTRODUCTION
Tourism activities in Indonesia have recently begun to grow, develop, and even become a trend and lifestyle in Indonesian society (
Tourism has the strategic role of increasing and supporting national economic development (
Table 1 details the yearly financial contribution of the Indonesian tourism sector to the Gross Domestic Product of Garut District.
Tabla 1. PIB del Distrito de Garut de 2013 a 2015 en millones de rupias indonesias
| Year | Income from tourism services | Total GDP of Garut District (in millions of IDR) | Contribution to GDP |
| 2013 | 931.318,31 | 33.687.510,52 | 3 % |
| 2014 | 1.017.077,94 | 37.084.186,77 | 3 % |
| 2015 | 1.139.908,56 | 40.681.251,80 | 3 % |
In the table above, the contribution of tourism to the total GDP of Garut District’s is still small, at around 3%. Therefore, the potential of tourism should be developed so that such contribution increases in the future. Table 2 shows historical data of tourist visits to the West Java Province, Garut District, and Ciamis Distric.
Tabla 2. Datos históricos de visitas turísticas a Java Occidental, el Distrito de Garit y el Distrito de Ciamis (2012-2015)
| No | Description | Tourist type | 2012 | 2013 | 2014 | 2015 | CAGR |
| 1 | West Java Province | Foreing tourist Domestic tourist | 1.905,378 42.758.063 | 1.794.401 45.563.179 | 1.962.639 47.992.088 | 2.027.629 56.334.706 | 2.09 % 9.63 % |
| 2 | Garut | Foreing tourist Domestic tourist | 4.745 1.676.988 | 5.539 1.962.703 | 6.334 2.248.419 | 4.334 1.874.222 | -2.97 % 3.78 % |
| 3 | Ciamis | Foreing tourist Domestic tourist | 10.074 1.408.858 | 8.318 1.241.816 | 6.563 1.074.775 | 7 169.696 | -91.14 % -50.61 % |
Table 2 shows some particularities regarding the number of tourist arrivals in 2015 in each place:
- West Java Province: The Compound Annual Growth Rate (CAGR) of both types of tourism increased: foreign tourism, 2.09%; and domestic tourism, 9.63 %.
- Garut District: The CAGR of foreign tourists here decreased 2.97 %, while that of its domestic counterpart increased 3.78 %. The decreasing foreign tourism reflects the mismatch between expectations and reality in the tourist area. Santolo Beach, located in the coastal area of Pameungpeuk, is a fairly popular tourist destination among several places in Garut District. Out of a total of 1,874,222 tourists in this district in 2015, 231,563 visited Santolo Beach.
- Ciamis District: The CAGR of both tourist types decrease sharply here because the Ciamis District was affected by the 2004 tsunami.
Table 3 reports the number and type of tourists who visited the West Java Province in 2015.
Tabla 3.Visitas turísticas a la Provincia de Java Occidental (2012–2015)
| No | Regency / city | Foreing tourist | Domestic tourist | Total |
| A | Regency | |||
| 1 | Bogor | 228.913 | 4.955.079 | 5.183.992 |
| 2 | Sukabumi | 49.985 | 2.031.979 | 2.081.964 |
| 3 | Cianjur | 12.100 | 212.095 | 224.195 |
| 4 | Bandung | 867.000 | 5.583.468 | 6.450.468 |
| 5 | Garut | 4.334 | 1.874.220 | 1.878.554 |
| 6 | Tasikmalaya | 1.362 | 505.570 | 506.932 |
| 7 | Ciamis | 126.022 | 126.022 | |
| 8 | Kuningan | 116 | 1.189.102 | 1.189.218 |
| 8 | Cirebon | 644.224 | 644.224 | |
| 10 | Majalengka | 1.500 | 443.001 | 444.501 |
| 11 | Sumedang | 18.637 | 992.315 | 1.010.952 |
| 12 | Indramayu | 111.703 | 111.703 | |
| 13 | Subang | 748.972 | 3.477.300 | 4.226.272 |
| 14 | Purwakarta | 2.782 | 1.957.194 | 1.959.976 |
| 15 | Karawang | 649 | 4.574.411 | 4.575.060 |
| 16 | Bekasi | 49.740 | 49.740 | |
| 17 | Bandung Barat | 278.027 | 1.289.657 | 1.567.684 |
| 18 | Pangandaran | 10.344 | 1.824.367 | 1.834.711 |
| B | City | |||
| 19 | Bogor | 13.217 | 5.293.040 | 5.306.257 |
| 20 | Subakumi | 3.266 | 82.316 | 85.582 |
| 21 | Bandung | 432.271 | 1.431.290 | 1.863.561 |
| 22 | Cirebon | 1.423 | 1.354.722 | 1.356.145 |
| 23 | Bekasi | |||
| 24 | Depok | 7.812 | 1.864.273 | 1.872.085 |
| 25 | Cimahi | 339 | 1.968 | 2.307 |
| 26 | Tasikmalaya | 25 | 302.908 | 302.933 |
| 27 | Banjar | 50.453 | 50.453 | |
| Total | 2.683.074 | 42.222.417 | 44.905.491 |
The decrease in the number of both types of tourist visits to Garut District from 2014 to 2015 should be studied in order to understand the marketing mix of tourism services in said district, especially the place branding of Santolo beach, its image, and tourists’ decision to visit it. This study aims to analyze the effect of services marketing mix and place branding on the tourism destination image of this place.
2. THEORETICAL FRAMEWORK
Services marketing mix
According to
Place branding
According to
1. That support the creation of a name, symbol, logo, word mark or other graphic that both identifies and differentiates a destination; 2. That convey the promise of a memorable travel experience that is uniquely associated with the destination; and 3. That serve to consolidate and reinforce the recollection of pleasurable memories of the destination experience, all with the intent purpose of creating an image that influences consumers’ decisions to visit the destination. (p.331)
Tourism Destination Image
3. METHOD
This study applied a quantitative method supported by an explanatory survey focused on customer perception of the services marketing mix, place branding, and image, where the intangible variables were marketing mix services and place branding and the tangible variable was image. The data sources were primary and secondary. The primary data, obtained from tourist respondents in the field, are concerned with the services marketing mix, place branding, and image. Secondary data convey supporting information that complements research data. Primary data are obtained from questionnaires, interviews, and observations, while secondary data are obtained from a government institute of Indonesia known as Badan Pusat Statistik (BPS) and from books and related documents.
The survey was conducted by a team of researchers at Santolo beach in southern Garut. The instrument used to collect the data was a questionnaire administered to visitors of said beach. The design of the research instrument was based on three research variables: services marketing mix, place branding, and image. The questionnaire was composed of closed-ended questions that were answered using a Likert scale from 1 to 5. In this paper, validity and reliability were supported if the Pearson correlation coefficient was greater than or equal to 0.30 (r ≥ 0.3).
Structural Equation Modeling (SEM), i.e., a data analysis technique, and LISREL 9.2 Student software were used here to analyze the problems mentioned above. SEM models are statistical techniques that can be employed to simultaneously test a series of relatively complex relationships. Complex relationships can be established between one or several dependent variables with one or several independent variables. The steps followed in this study to conduct the SEM are explained in Figure 1.
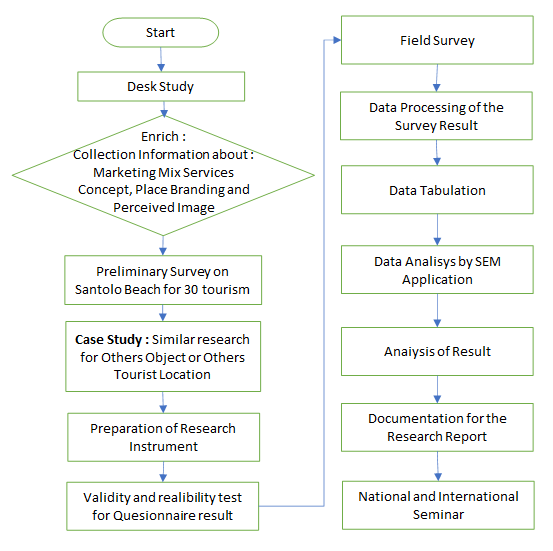
Figura 1. Research model
Source: Created by the authors.
This study implemented simple random probability sampling (
The survey was conducted on Santolo Beach, a tourist destination in southern Garut. Simple random sampling was applied, and Slovin’s formula resulted in a sample size of 100 respondents (out of 231,563 tourists). As expressed in
4. RESULTS
Validity and reliability
According to
Tabla 4. Resultados del test de validez de las variables independientes en el Marketing Mix
| Variable | Sub-variable | r count | Condition r | Conclusion |
| Services Marketing Mix | Service (X1) | .578** | > 0.30 | Valid |
| .654** | > 0.30 | Valid | ||
| Price (X2) | .708** | > 0.30 | Valid | |
| Place (X3) | .463** | > 0.30 | Valid | |
| Promotion (X4) | .467** | > 0.30 | Valid | |
| People (X5) | .469** | > 0.30 | Valid | |
| Physical Evidence (X6) | .783** | > 0.30 | Valid | |
| .760** | > 0.30 | Valid | ||
| Process (X7) | .467** | > 0.30 | Valid | |
| Place Branding | Presence (X8) | 870** | > 0.30 | Valid |
| Place (X9) | .875** | > 0.30 | Valid | |
| Potential (X10) | .913** | > 0.30 | Valid | |
| Pulse (X11) | .847** | > 0.30 | Valid | |
| Destination Image | Personality (X12) | 875** | > 0.30 | Valid |
| Reputation (X13) | .847** | > 0.30 | Valid | |
| Value (X14) | .913** | > 0.30 | Valid | |
| Destination Identity (X15) | .846** | > 0.30 | Valid |
Note: ** Correlation is significant at the 0.01 level (2-tailed)
In Figure 2, the coefficient of the influence of the Services Marketing Mix (named BauranPJ) on Tourism Destination Image (named CitraP) is 0.298 (approximately 0.30), and that of Place Branding (named Fbrandin) on Tourism Destination Image is 0.356 (approximately 0.36).
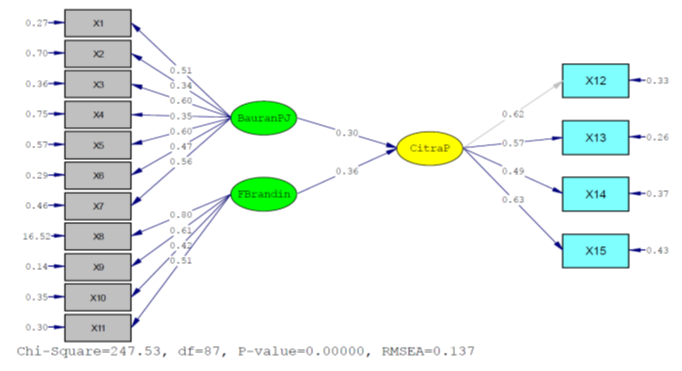
Figura 2. Influencia del Marketing Mix para servicios y marca de lugar en la imagen del destino turístico. CitraP: imagen del destino turístico, BauranPJ: Marketing Mix para servicios y Fbrandin: marca de lugar
Source: Created by the authors.
Table 5 presents the hypotheses tested here to verify the relationships between variables.
Tabla 5. Pruebas de hipótesis para verificar relaciones entre variables
| Variable relationships | Estimated coefficient | Standard error | T-value | Decision |
| BauranPJ | 0.298 | 0.218 | 1.367 | Not supported. |
| Fbrandin | 0.356 | 0.215 | 1.656 | Not supported. |
Note: *** p < 0.001, ** p < 0.01, * p < 0.05
The hypothesis of the influence of BauranPJ on CitraP was tested applying the following procedure:
Hypothesis Test 1:
`H_0` : `γ_21 = 0` The Services Marketing Mix has no effect on Image.
`H_1` : `γ_21 ≠ 0` Place Branding influences Image.
As a result, we obtained the following test statistics:
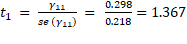 (1)
(1)Ho is rejected if `t_1 ≥` t-table.
Ho is not rejected if `t_1 <` t-table.
The same procedure was carried out to testing the influence of Fbrandin on CitraP:
Hypothesis Test 2:
`H_0` : `γ_22 = 0` Place Branding has no effect of on Image.
`H_1` : `γ_22 ≠ 0 ` Place Branding influences Image.
As a result, we obtained the following test statistics:
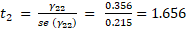 (2)
(2)Ho is rejected if `t_2 ≥` t-table.
Ho is not rejected if `t_2 <` t-table.
The t- value of Hypothesis 1 was 1.367, and that of Hypothesis 2 was 1.656. As both values are below the t-table = 1.98 (with an alpha of 5%), the sampled data fails to reject the null hypothesis; thus, neither of the two effects are supported.
5. DISCUSSION
This study is in line with
The services marketing mix has also been highlighted in the literature because it has a positive influence on tourism destination image. According to
Although the literature has reported a positive orientation and influence of constructs such as services marketing mix and place branding on tourism destination image (
6. CONCLUSIONS
A total of 100 visitors to Santolo Beach in Garut participated in this survey. Considering the data collected and the data analysis conducted using Structural Equation Modeling, it can be concluded that, in this case, the concepts of the services marketing mix and place branding have no influence whatsoever on the concept of image. Hence, the strategies designed to improve the image of this this tourist destination should be focused on other aspects.
The literature review in this paper suggests that further studies should analyze the place image and branding of other tourist destinations in order to lay solid foundations to design strategies to promote them. Therefore, they should should differentiate the type of tourist destination (beach, mountain, and city, among others) and establish the components that make them different to better manage their image.
Further studies should compare tourist destinations in developed countries and emerging markets to understand how this influences the perception of place image and branding. Additionally, statistical samples should be robust and heterogeneous in order to produce more accurate models that contribute to strengthen the tourism sector.
CONFLICTS OF INTEREST
The author declares no conflict of financial, professional, or personal interests that may inappropriately influence the results that were obtained or the interpretations that are proposed here.
FOOTNOTE
- arrow_upward This article is derived from the LPPM (Community Service Research Institute) STIE EKUITAS Internal Research Grant Project.
REFERENCES
- arrow_upward Adu-Ampong, E. A. (2018). Tourism and national economic development planning in Ghana, 1964–2014. International Development Planning Review, v. 40, n. 1, 75-95. https://doi.org/10.3828/idpr.2018.2
- arrow_upward Aksoy, R., Kiyci, S. (2011). A Destination Image As a Type of Image and Measuring Destination Image in Tourism (Amasara Case). European Journal of Social Sciences, v. 20, n. 3, 478-488. URL
- arrow_upward Avraham, E., Ketter, E. (2008). Media Strategies for Marketing Places in Crisis Improving the Image of Cities, Countries and Tourist Destinations. Elsevier
- arrow_upward Bappeda Jabar Humas. (2005). RPJPD Kabupaten Garut Tahun 2005-2025. http://bappeda.jabarprov.go.id/documents/rpjpd-kabupaten-garut-tahun-2005-2025/
- arrow_upward Balakrishnan, M., Nekhili, R., Lewis, C. (2011). Destination Brand Components. International Journal of Culture, Tourism and Hospitality Research, v. 5, n. 1, 4-25. https://doi.org/10.1108/17506181111111726
- arrow_upward Blain, C., Levy, S. E., Brent Ritchie, J. R. (2005). Destination Branding: Insights and Practices from Destination Management Organizations. Journal of Travel Research, v. 43, n. 4, 328-338. https://doi.org/10.1177/0047287505274646
- arrow_upward Boisen, M., Terlouw, K., Groote, P., Couwenberg, O. (2018). Reframing place promotion, place marketing, and place branding-moving beyond conceptual confusion. Cities, v. 80, 4-11. https://doi.org/10.1016/j.cities.2017.08.021
- arrow_upward Central Bureau of Statistics of Indonesia. (2015a). GDP of Garut District from 2013 to 2015 (in millions of IDR). https://garutkab.bps.go.id/gdp-garut-2013-2015
- arrow_upward Central Bureau of Statistics of Indonesia. (2015b). Garut Dalam Angka 2010. https://garutkab.bps.go.id/publication/2010/11/26/e7df337172f4289c47c30314/garut-dalam-angka-2010-2013.html
- arrow_upward Chandra, I. R. (2015). The Impact of Marketing Mix Elements toward Brand equity throught Brand Awareness and Brand Image as Mediators in Bakery Industry in Indonesia. iBussManagement, v. 3, n. 2, 341-350. https://www.neliti.com/publications/184492/the-impact-of-marketing-mix-elements-toward-brand-equity-through-brand-awareness#cite
- arrow_upward Cheah, C. F., Abdul-Rahim, A. S. (2018). Relationship between Health Care and Tourism Sectors to Economic Growth: The Case of Malaysia, Singapore and Thailand. Pertanika Journal of Social Science and Humanities, v. 26, n. 2, 1203-1213. http://www.pertanika.upm.edu.my/pjssh/browse/regular-issue?article=JSSH-1761-2016
- arrow_upward Chen, W. F., Ting, T. Y. (2019). Contesting shopping tourism: Neoliberal consumption scapes and conflicts in host societies. Tourism Culture & Communication, v. 19, n. 2, 155-160. https://doi.org/10.3727/109830419X15536971539434
- arrow_upward Cretu, A. E., Brodie, R. J. (2007). The influence of brand image and company reputation where manufacturers market to small firms: A customer value perspective. Industrial Marketing Management, v. 36, n. 2, 230-240. https://doi.org/10.1016/j.indmarman.2005.08.013
- arrow_upward Dwi Lestari, E., Yuwono, M. K. (2020). The Effect of Family–Work and Work–Family Conflict on Call Center Workers’ Emotional Exhaustion With Person–Job Fit as Antecedent. Revista CEA, v. 6, n. 12, 69-85. https://doi.org/10.22430/24223182.1616
- arrow_upward Garay, L. (2019). #Visitspain. Breaking down affective and cognitive attributes in the social media construction of the tourist destination image. Tourism Management Perspectives, v. 32, 100560. https://doi.org/10.1016/j.tmp.2019.100560
- arrow_upward Gertner, R. K. (2019). The impact of cultural appropriation on destination image, tourism, and hospitality. Thunderbird International Business Review, v. 61, n. 6, 873-877. https://doi.org/10.1002/tie.22068
- arrow_upward Govers, R., Go, F. (2009). Place Branding Glocal, Virtual and Physical Identities, Constructed, Imagined and Experienced. Palgrave Macmillan
- arrow_upward Harwiki, W., Choiron, A., Hartini, S. (2018). Batik Creative Industry: Creativity, Innovation and Competitiveness to Encounter Global Market. Journal of Business and Finance in Emerging Markets, v. ., n. 2, 189-196. https://doi.org/10.32770/jbfem.vol1189-196
- arrow_upward Hu, Y. J. (2009). Service Quality as Mediator of the Relationship between Marketing Mix Strategy and Customer Loyalty: The Case of Retailing Stores in Taiwan. International Journal of Organizational Innovation, v. 2, n. 2, 282-293. https://www.ijoi-online.org/attachments/article/21/Microsoft%20Word%20-%20FINAL%20ISSUE%20VOL%202%20NUM%202%20FALL%202009.pdf
- arrow_upward Kavaratzis, M., Hatch, M. J. (2013). The dynamic of place brands: An identity-based approach to place branding theory. Marketing Theory, v. 13, n. 1, 69-86. https://doi.org/10.1177/1470593112467268
- arrow_upward Kotler, P., Keller, K. L. (2012). Marketing Management (2nd. ed.). Prentice Hall Europe.
- arrow_upward Majtán, S., Frianová, V. (2011). Marketingová komunikácia podnikov cestovného ruchu – tvorba a optimalizácia komunikačného mixu. Ekonomický časopis, v. 59, n. 2, 178-193. http://www.ekonom.sav.sk/sk/casopis/rocnik/2-2011
- arrow_upward McCreary, A., Seekamp, E., Davenport, M., Smith, J. W. (2020). Exploring qualitative applications of social media data for place-based assessments in destination planning. Current Issues in Tourism, v. 23, n. 1, 82-98. https://doi.org/10.1080/13683500.2019.1571023
- arrow_upward Mishra, P. K., Rout, H. B., Mohapatra, S. S. (2011). Causality between tourism and economic growth: Empirical evidence from India. European Journal of Social Sciences, v. 18, n. 4, 518-527. https://www.europeanjournalofsocialsciences.com/issues/EJSS_18_4.html
- arrow_upward Mukherjee, S., Shivani, S. (2016). Marketing Mix Influence on Service Brand Equity and Its Dimensions. Vision: The Journal of Business Perspective, v. 20, n. 1, 9-23. https://doi.org/10.1177/0972262916628936
- arrow_upward Pardjono, P., Sugiyono, S., Budiyono, A. (2015). Developing a model of competency and expertise certification tests for vocational high school students. REID (Research and Evaluation in Education), v. 1, n. 2, 129-145. https://doi.org/10.21831/reid.v1i2.6517
- arrow_upward Peter, O. R., Oundo, B. H., Lydiah, A. (2018). The Effect of Store Image and Price on Store Brand Equity: Evidence from Supermarkets in Kenya. IOSR Journal of Business and Management, v. 20, n. 10, 15-23. https://doi.org/10.9790/487X-2010021523
- arrow_upward Ranjbarian, B., Sanayei, A., Rashid Kaboli, M., Hadadian, A. (2012). An Analysis of Brand Image, Perceived Quality, Customer Satisfaction and Re-Purchase Intention in Iranian Department Stores. International Journal of Business and Management, v. 7, n. 6, 40-48. https://doi.org/10.5539/ijbm.v7n6p40
- arrow_upward Sunjayadi, R. A. (2018). Dari Turisme ke Pariwisata: Melacak Jejak Istilah Turisme di Indonesia. Melancong: Jurnal Perjalanan Wisata, Destinasi, dan Hospitalitas, v. 1, n. 1, 1-23. https://scholar.ui.ac.id/en/publications/dari-turisme-ke-pariwisata-melacak-jejak-istilah-turisme-di-indon
- arrow_upward Umar, H. (2008). Desain Penelitian MSDM dan Perilaku Karyawan: Paradigma Positivistik dan Berbasis Pemecahan Masalah, Edisi I, Cetakan Pertama. Raja Grafindo Persada
- arrow_upward Weidenfeld, A. (2018). Tourism Diversification and Its Implications for Smart Specialisation. Sustainability, v. 10, n. 2, 319. https://doi.org/10.3390/su10020319
- arrow_upward Zeithaml, V. A., Bitner, M. J., Gremler, D. (2012). Services Marketing: Integrating Customer Focus Across the Firm (7th ed.). Mc Graw-Hill