Competitiveness of Rural Enterprises Run by Millennials in Antioquia*
Competitividad de empresas rurales impulsadas por millennials en Antioquia
Received: 21 de Junio de 2021
Accepted: 19 de Octubre de 2021
Arias-Vargas, F. J., Ribes-Giner, G., Garcés-Giraldo, L. F., Arango-Botero, D. M. (2022). Competitiveness of Rural Enterprises Promoted by Millennials in Antioquia. Revista CEA, v. 8, n. 16, e1993. https://doi.org/10.22430/24223182.1993
Abstract
Business competitiveness is defined as a company's capacity to participate in the market with an competitive advantage. It can be analyzed using different approaches such as the Resource-Based View (RBV) and measured from a multidimensional perspective. This paper aims to examine the competitiveness of rural enterprises run by a millennial population consisting of undergraduate students and graduates from different faculties of agricultural sciences in Antioquia (Colombia). A total of 1242 emails were sent asking to fill out an online questionnaire, and 432 people responded (34.78 %), with 11.91 % already having a business in operation (148 enterprises). Once the competitiveness index was calculated, a multidimensional statistical analysis was performed to identify differences between regions, economic sectors, status (formal or informal), number of employees, and age of the company. According to the results, service companies in rural areas, enterprises registered at the chamber of commerce, and those with a higher number of employees and longer time in the market exhibit a better competitiveness index. The main limitations, however, are observed in the competitive strategy and marketing components. Since the competitiveness index can have a maximum value of 10, values in the range of 5.68 to 6.79 indicate a medium level of competitiveness and, therefore, imply that the other components of the competitiveness index must be improved to achieve higher levels of competitiveness.
Keywords: Young population, Generation Y, entrepreneurship, rural enterprises, JEL Classification: L26, O18, R51.
Highlights
Resumen
La competitividad empresarial se define como la capacidad de una empresa para participar en el mercado con una ventaja competitiva. Dicha competitividad puede analizarse por medio de diferentes enfoques como la visión basada en recursos (RBV, por sus siglas en inglés) y medirse desde una perspectiva multidimensional. Este estudio tuvo como objetivo examinar la competitividad de empresas rurales dirigidas por una población milénica conformada por estudiantes de pregrado egresados de diferentes facultades de ciencias agrícolas en Antioquia (Colombia). Se enviaron un total de 1242 correos electrónicos solicitando diligenciar un cuestionario en línea, respondiendo 432 personas (34.78 %), de las cuales el 11.91 % ya tiene un negocio en funcionamiento (148 empresas). Una vez calculado el índice de competitividad, se realizó un análisis estadístico multidimensional para identificar diferencias entre regiones, sectores económicos, estado (empresa formal o informal), número de empleados y edad de la empresa. De acuerdo con los resultados, las empresas de servicios en áreas rurales, aquellas inscritas en la cámara de comercio y aquellas con mayor número de empleados y más tiempo en el mercado presentan un mejor índice de competitividad. Las principales limitaciones, no obstante, se observan en los componentes estrategia competitiva y marketing. Dado que el índice de competitividad puede tener un valor máximo de 10, valores en el rango de 5.68 a 6.79 indican un nivel medio de competitividad y, por lo tanto, implican que los demás componentes del índice de competitividad deben mejorarse para lograr mayores niveles de competitividad.
Palabras clave: población joven, generación Y, emprendimiento, empresas rurales, Clasificación JEL: L26, O18, R51.
Highlights
1. INTRODUCTION
In Colombia, 99.6 % of the territory is rural (
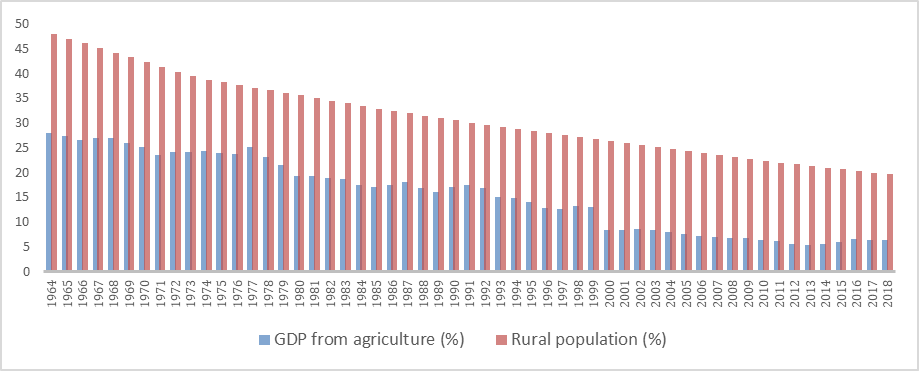
Figura 1. Evolución del PIB del sector agrícola y la población rural entre 1964 y 2018
Source: Created by the authors based on data from the World Bank (2019) and the Economic Commission for Latin America and the Caribbean (
Colombia has been recognized as one of the few countries that, agriculturally speaking, can produce all year round thanks to its agro-ecological conditions and geographical location that is not affected by seasons (
The aforementioned has been favored in a post-conflict context due to an improvement in the perception of security as a result of the signing of the peace agreements in La Havana. This, however, has also generated debate on the high concentration of land in the hands of few, leaving a large number of Colombians with difficulties in accessing land despite the already existing processes of land restitution for victims of dispossession (
Five decades of armed conflict brought several consequences: a marginalized, impoverished, and disconnected countryside with problems in terms of infrastructure, public utilities, government presence, security, and high inequality (
Paradoxically, this large population tends to be located in 0.3 % of the Colombian territory declared as urban (
Colombian rural areas with high agricultural potential should grow to provide and complement nonexistent services that will attract new people from urban and other rural areas. This would generate new types of businesses to energize the territories (
One of the possibilities of revitalizing rurality is rural entrepreneurship (
Colombia has made progress in the creation of a regulatory framework to encourage entrepreneurship, and the government is working to do so. For instance, Law 1780 of 2016 was recently approved. This law promotes employment and entrepreneurship for young people between 17 and 28 years old due to the difficulties they face in accessing formal jobs (
According to the Global Entrepreneurship Monitor (GEM) report for Colombia, young people aged 18 to 34 years old contributed the most to national entrepreneurship, with 42 t% of ventures and an Entrepreneurial Activity Rate (EAR) above 20 % (
Various studies in the literature highlight millennials’ appreciation for entrepreneurship in rural areas. This is explained by their interest in favoring communities through the creation of companies and the development of social enterprises, with access to financing conditions, opportunities, and public services (especially the internet) being a determining factor that connects them with a more relaxed lifestyle away from urban contexts (Anthopoulou et al., 2017). The dominant premise in this age group appears to be "working to live and not living to work" (
Young people from rural territories are different from those of urban areas in that the former generally want to migrate to seek opportunities in cities (
The purpose of this study is to understand the competitiveness of rural ventures promoted by undergraduate and graduate students from different faculties of agricultural sciences in Antioquia whose age ranges between 20 and 40 years old and who are considered millennials. For this purpose, we considered ventures in different sectors such as agriculture, livestock, agro-industry, commerce, industry, services, and mixed activities. The aims is to better understand the competitiveness of such companies from a systemic and multidimensional perspective based on the Resource-Based View (RBV).
2. THEORETICAL FRAMEWORK
The theory of competitiveness has been analyzed from different approaches, starting with David Ricardo’s comparative advantages; Porter’s competitive advantages (
Competitiveness has been given several definitions (see Table 1), with no consensus on a single accepted one (
Tabla 1. Algunas definiciones de competitividad
Definition | Author |
| “International competitiveness refers to the ability of a country's producers to compete successfully in world markets and in their domestic market with imports. Competitiveness is generally measured by the actions that a country achieves in its markets, taking into account its size and stage of development. In this broad sense, competitiveness becomes synonymous with overall performance”. | (Treasury, 1983) cited in ( |
| “Competitiveness is the ability to sustain and increase participation in international markets, accompanied by an increase in the population's standard of living. The only way to accomplish this is through increased productivity”. | ( |
| “Competitiveness provides the basis for increasing people's incomes in a noninflationary way. It increases value-added and growth potential by stimulating not only resource-saving innovation but also investment to expand capacity and create jobs”. | ( |
| “Competitiveness is the extent to which a nation, under free and fair market conditions, produces goods and services that meet the test of international markets while maintaining or expanding the real incomes of its citizens”. | ( |
| “Competitiveness is a multidimensional and complex concept”. | ( |
| “Competitiveness is the ability of companies engaged in value-added activities in a specific industry, in a particular country, to maintain this value-added over long periods despite international competition”. | ( |
| “Competitiveness can be defined as the ability to face competition and succeed when faced with it”. | ( |
| “Competitiveness is a multifaceted concept whose understanding comes from economics, management, history, politics, and culture”. | ( |
| “National competitiveness refers to a country's ability to provide an environment conducive to the growth of its businesses, and therefore its industries. The goal is to assist in creating value, generating profits, and raising national prosperity at the same time”. | ( |
| “Competitiveness is a set of ten mutually dependent pillars: human capital, product, internal market, networks, technology, decision making, strategy, marketing, internationalization, and online presence, which enable a company to compete effectively with other companies and serve customers with valuable goods and services”. | ( |
According to Latruffe:
(...) Competitiveness is therefore a relative measure. However, it is a broad concept and there is no agreement on how to define it and how to measure it accurately. There are a large number of definitions with studies often adopting their definition and choosing a specific measurement method (Latruffe, 2010, p.5 ).
Business competitiveness
Business competitiveness is based on a company's ability to remain and grow in a market (
Considering the foregoing, aspects that are in line with the creation of shared value for those involved in the business should also be examined (
There is an interest in focusing on the company and its resources when analyzing competitiveness (
Competitiveness, rural entrepreneurship, and youth
Urban agglomeration boosts the competitiveness of businesses that are dispersed in rural areas and tend to be less competitive (
In this context, young people categorized as millennials, i.e., were born between 1980 and 2000, and considered digital natives in the literature can help improve the competitiveness levels of rural enterprises because they have the advantage of easily adopting changes (
Millennials are not limited to traditional careers; they seek innovative ways to combine profit and purpose, as illustrated by concepts such as social entrepreneurship (
In order to compensate for remoteness and enhance trade (
3. METHOD
A database of students in their final semesters (both undergraduate and graduate) and graduates from different faculties of agricultural sciences in Medellín was gathered for this study. These students were contacted via email to participate in a survey on rural entrepreneurship that measured sociodemographic, psychological, motivational, and business information variables, including competitiveness. For this purpose, 1242 emails were sent. Random sampling with a 95% confidence interval was used, which required 295 questionnaires to be completed. A total of 430 responses (34.78%) were received, i.e., 135 more than those required by the sampling. According to the results of the questionnaires, 11.91% of the respondents had an active business (148 companies) and were either starting a business or already had an established one.
To measure the competitiveness of the companies, the enterprise competitiveness index, which is based on the RBV and the configurational theory and was developed within the framework of the global competitiveness project (https://www.sme-gcp.org/), was used. It has the advantage of being a multidimensional and systemic index (see Equation 3) that includes 46 variables in 10 competitive pillars, whose values must be normalized between 0 and 1 (
To normalize the values of the variables using a Likert scale from 1 to 5, where 1 indicates that the variable is of little relevance and 5 means that it is relevant (see Equation 1), we used the following equation:
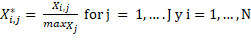 (1)
(1)Lafuente et al. (2016) proposed a penalty function to compensate for underperforming pillars (see Equation 2). In this equation, hi,v is the v-th value of the pillar and minp*i,v is the lowest pillar value for the analyzed company (i). The correction function of the pillars, due to the bottleneck, would be given by
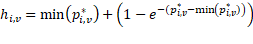 (2)
(2)The competitiveness index (see Equation 3) is then calculated using the following mathematical equation (
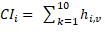 (3)
(3)The equation resulting from combining Equations 2 and 3 to calculate the competitiveness index (CI.) of company i would be
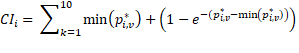 (4)
(4)Once the competitiveness index of the companies is calculated, a multidimensional analysis is performed, separating entrepreneurs into three groups following the proposal of the Global Entrepreneurship Monitor: nascent entrepreneurs (0–3 months), new entrepreneurs (up to 42 months), and established entrepreneurs (more than 42 months) (
T-tests and analysis of variance (ANOVA) were employed after constructing the competitiveness index in order to identify differences between regions, economic sectors, registration at the chamber of commerce, number of employees, and age of the company. Before applying these tests, normality and homoscedasticity between the groups were first verified using the Kolmogorov–Smirnorv and Shapiro–Wilk tests for the first assumption and the Levene test for the second.
Subsequently, a Multivariate Analysis of Variance (MANOVA) was carried out to test the equality of the means of the different components that make up the competitiveness index between the two groups defined based on the companies' age.
4. RESULTS
The data reported by the owners of the 148 enterprises were grouped based on characteristics such as location in the department of Antioquia, economic sector, registration at the chamber of commerce to support their formal status, number of employees, and age of the company (see Table 2). The aim was to identify those factors that help explain the differences between the competitiveness indices calculated here.
Tabla 2. Características de la muestra
Groups | Region | Percentage |
1 | Eastern Antioquia | 18.92 |
2 | Aburrá Valley except for Medellín | 19.59 |
3 | Medellín | 21.62 |
4 | Southwestern and northern Antioquia | 22.97 |
5 | Others | 16.89 |
Groups | Economic sector | Percentage |
1 | Agriculture, livestock, agro-industry | 40.54 |
2 | Services | 35.14 |
3 | Trade and mixed activities | 24.32 |
Groups | Registration at the chamber of commerce | Percentage |
1 | Yes | 61.49 |
2 | No | 38.51 |
Groups | Number of employees | Percentage |
1 | 1 employee | 32.43 |
2 | 2 and 3 employees | 34.46 |
3 | 4 or more employees | 33.11 |
Groups | Age of the company | Percentage |
1 | 0 to 42 months | 47.97 |
2 | > 42 months | 52.03 |
First, normality was tested by means of the Kolmogorov–Smirnov test (for degrees of freedom greater than or equal to 50) and the Shapiro–Wilk test (for degrees of freedom less than 50). As can be seen in Table 3, the data is supported at a significance level of 0.05 for all groups, except for region 4 (southwestern and northern Antioquia). This region reports an average competitiveness index of 6.08, which is lower than that of the other regions (see Annex 1), and a p-value of 0.017. Table 3 also presents the results of testing the homogeneity of variances using Levene’s statistic. The results support the fulfillment of this assumption at a significance level of 0.05.
Tabla 3. Prueba de normalidad y homogeneidad de varianzas
| Test for normality | Test for homogeneity of variances | ||||||
| Region | Statistic* | gl | Sig. | Levene’s statistic | gl1 | gl2 | Sig. |
| 1 | .966 | 28 | .482 | 1.576 | 4 | 143 | .184 |
| 2 | .978 | 29 | .790 | ||||
| 3 | .964 | 32 | .342 | ||||
| 4 | .921 | 34 | .017 | ||||
| 5 | .964 | 25 | .505 | ||||
| Sector | |||||||
| 1 | .087 | 60 | .200* | 2.112 | 2 | 145 | .125 |
| 2 | .083 | 52 | .200* | ||||
| 3 | .988 | 36 | .955 | ||||
| Registration | |||||||
| 1 | .057 | 91 | .200* | 1.177 | 146 | .280 | |
| 2 | .087 | 57 | .200* | ||||
| Number of employees | |||||||
| 1 | .970 | 48 | .252 | .476 | 2 | 145 | .622 |
| 2 | .079 | 51 | .200* | ||||
| 3 | .982 | 49 | .634 | ||||
| Age of the company | |||||||
| 1 | .058 | 71 | .200* | .505 | 146 | .478 | |
| 2 | .082 | 77 | .200* | ||||
Note: The Kolmogorov–Smirnov test was used to test group normality in each of the sample's characteristics when the degrees of freedom were greater than or equal to 50 and the Shapiro–Wilk test when the degrees of freedom were less than 50.
According to Table 4, there are no significant differences in the average competitiveness indices between the different regions (F = .799, p-value = .527 > .05). Differences, however, are observed between the different sectors (F = 3.188, p-value = .044) and the groups defined based on the number of employees (F = 5.520, p-value = .005). In order to determine which averages were different, Tukey's post-hoc tests were used, and the difference in averages between economic sector 2 (services) and economic sector 3 (trade and mixed activities) was 0.75 (p-value = 0.044). This indicates a higher average competitiveness index (see Annex 2) for service companies (6.7961) than for agricultural companies (6.2047) and companies dedicated to trade and mixed activities (5.9236).
Tabla 4. Análisis de varianza para tres o más grupos
Classification | Origin | Sum of squares | gl | Half a square | F | Sig. |
| Region | Between groups | 6.815 | 4 | 1.704 | .799 | .527 |
Within groups | 304.799 | 143 | 2.131 | |||
Total | 311.614 | 147 | ||||
| Sector | Between groups | 13.125 | 2 | 6.563 | 3.188 | .044 |
Within groups | 298.489 | 145 | 2.059 | |||
Total | 311.614 | 147 | ||||
| Number of employees | Between groups | 22.046 | 2 | 11.023 | 5.520 | .005 |
Within groups | 289.568 | 145 | 1.997 | |||
Total | 311.614 | 147 |
As for the differences between the groups defined based on the number of employees, Tukey's test yielded a difference of .89 (p-value = .007) and .74 (p-value = .026) for half group 3-half group 1 and half group 3-half group 2, respectively. Hence, we may conclude that ventures with 4 or more employees have a higher average competitiveness index than those with up to 3 employees.
Table 5 reports the differences in averages between the two groups defined based on registration status (registered and not registered at the chamber of commerce) and the two groups defined based on age of the company. As observed, the average competitiveness index is higher for companies registered at the chamber of commerce (t = 2.913 and p-value = .004), as well as for those that have been in the market for a longer time (t = -2.423, p-value = .017).
Tabla 5. Prueba t para la diferencia en la media entre dos grupos
Classification | t | gl | Sig. (bilateral) | Mean difference | Difference in standard error |
Registration | 2.913 | 146 | .004 | .69876 | .23991 |
Age of the company | -2.423 | 146 | .017 | -.57110 | .23568 |
Competitiveness index analysis based on age of the company
The GEM project classifies entrepreneurs depending on the number of months their initiative has been operating, with a nascent entrepreneur having less than 3 months, a new entrepreneur having from 3 to 42 months, and an established entrepreneur having more than 42 months (
In light of the above and based on the ten components that make up the competitiveness index (
Tabla 6.Promedio de los componentes e índice de competitividad según los criterios del proyecto GEM
| Pillar | Nascent entrepreneurs | New entrepreneurs | Established entrepreneurs |
Human capital | 0.6190 | 0.6533 | 0.7057 |
Product | 0.6185 | 0.7115 | 0.7076 |
Domestic market | 0.7161 | 0.6843 | 0.7197 |
Networks | 0.5871 | 0.5588 | 0.6071 |
Technology | 0.4948 | 0.6073 | 0.6442 |
Decision making | 0.5844 | 0.6314 | 0.6795 |
Competitive strategy | 0.5510 | 0.6246 | 0.7172 |
Marketing | 0.5704 | 0.5562 | 0.6393 |
Internationalization | 0.4816 | 0.4606 | 0.5247 |
Online presence | 0.4652 | 0.5545 | 0.6136 |
CI | 5.6880 | 6.0425 | 6.5587 |
Number of businesses | 11 | 60 | 77 |
To make the samples more homogeneous for the analysis in terms of number of companies, nascent and new entrepreneurs were grouped together, for a total of 71 companies, while established entrepreneurs included 77 companies. Then, a multivariate analysis was conducted to determine which of the ten components that make up the competitiveness index explain the difference in averages between the two groups defined based on age of the company. Hence, we consider the ten components to be the dependent variables, and the age of the company to be the independent variable.
A MANOVA was carried out to test the equality of the means of the different components that make up the competitiveness index between companies with up 42 months of being created (11 companies in the category of nascent entrepreneurs with 0–3 months and 60 companies in the category of new entrepreneurs with up 42 months) and companies with more than 42 months of being established (77 companies in this category).
In light of the above, the compliance of the assumptions of normality and homogeneity of variances between the two groups defined based on age of the company was verified. These assumptions must be supported to perform the MANOVA. Additionally, the Box’s M test was employed to validate the assumption of equality of covariances of the dependent variables across the two groups (F [55, 67903.815] = 0.950; Sig. = 0.5804).
Wilks' Lambda was the contrast statistic used to verify if there were significant differences between the groups, yielding a value of .464 (F = 17.679; gl of the hypothesis = 9; gl of the error = 138; sig. = .000). With this result, it is reasonable to continue the analyses in order to establish where the difference lies. Figure 2 illustrates the estimated marginal means for each of the ten components of the competitiveness index. As can be seen, companies with more time in the market have a higher marginal mean than those with less time in the market, which, according to the classification of the GEM project, corresponds to the category of established entrepreneurs with an activity of more than 42 months paying salaries.
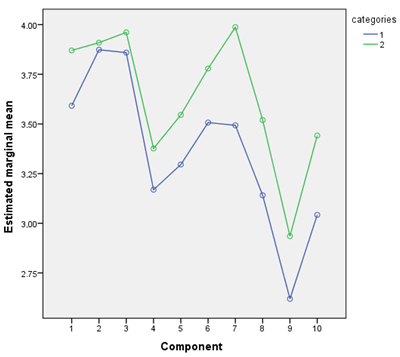
Figura 2. Medias marginales estimadas de competitividad
Source: Created by the authors based on data from the World Bank (2019) and the
The MANOVA results (Annex 3) show significant differences in the competitive strategy and marketing components across both groups at a significance level of 0.05. Therefore, these two components are the ones that essentially limit a better performance in the competitiveness index.
5. DISCUSSION
The competitiveness index (CI) developed by
According to the results of Tukey's post hoc tests, the difference in means between economic sector 2 (services) and economic sector 3 (trade and mixed activities) was 0.75 (p-value = .044). This suggests that service companies have a higher average competitiveness index (6.7971) than companies engaged in agricultural activities (6.2047). This situation also occurs in other contexts, as reported by
Another notable aspect occurs with business formalization associated with companies that are registered at the chamber of commerce (t = 2.913 and p-value = .004), and it is also higher for companies that have been in the market for a longer time (t = -2.423, p-value = .017). After reviewing the parameters of the GEM project, Varela et al. (2020) pointed out that the level of competitiveness of the rural companies under analysis increases as they gain greater experience in their operation, with a competitiveness index of 5.68 for companies with less than 3 months of being created, a competitiveness index of 6.04 for those with 3 to 42 months of being established, and a competitiveness index of 6.55 for those with more than 42 months of being created. This is consistent with the findings of
The MANOVA results showed significant differences in the competitive strategy and marketing components across the groups defined based on age of the company at a significance level of 0.05. These two components, thus, limit a better performance in the competitiveness index. According to various authors, marketing and market access have been one of the main challenges in improving the competitiveness of rural enterprises (
6. CONCLUSIONS
The competitiveness index was useful in understanding the performance of different sectors in which students in their final semesters and graduates from different agricultural sciences programs have ventured in the department of Antioquia. One of the most significant findings is the fact that the closer the companies are to Medellín (preferably in the eastern region of Antioquia), the higher their competitiveness. In addition, this finding reaffirms the fact that when a high level of business formalization is achieved, this has an impact on the competitiveness of business initiatives.
Among the various sectors considered in this study, service companies tend to be more competitive than agricultural enterprises located in rural areas of Antioquia because the latter depend on production factors in a context of uncertainty, which lowers their competitiveness indices. When analyzing the performance of the competitive index’s pillars, difficulties were observed in competitive strategy and marketing, which may be explained by the fact that entrepreneurs are usually trained in technical but not in business matters. This should be reviewed in the curricula of the faculties of agricultural sciences in order to complement this missing knowledge and, thus, improve the future performance of enterprises.
A direct correlation between level of business formalization and age of the company could be here established, with the competitiveness index increasing consistently from 5.68 for new companies to 6.55 for established companies (with more than 42 months of being operating) as they register at the chamber of commerce and grow older.
Considering the foregoing, it can be concluded that companies founded by agricultural sciences students, whose ages fall within the millennial age group, can be considered to be at a medium level of competitiveness, with the need to improve factors such as product, innovation, networking, and aspects associated with business management, as shown in Table 6, where the values of the pillars were below 0.7 in all cases. This should motivate work routes for those who participate in the ecosystem of rural entrepreneurship promotion, with the aim of boosting the economic and social development of these territories.
7. LIMITATIONS OF THE STUDY
Of the 1242 questionnaires sent, 432 (34.78 %) were responded, of which 11.91 % (148 enterprises) were new or already established businesses. Likewise, only 11 companies fell within the category of 0 to 3 months of operation, while 60 fell within the category of 3 to 42 months of operation and 72 within the category of more than 42 months of operation. Future research should, thus, be able to include a larger sample of nascent companies.
CONFLICTS OF INTEREST
The authors declare no conflicts of financial, professional, or personal interests that may inappropriately influence the results that were obtained or the interpretations that are proposed here.
AUTHOR CONTRIBUTIONS
All authors made substantial contributions to the research. Each of their contributions are specified below.
Francisco Javier Arias-Vargas: Conceptualization, validation, formal analysis, investigation, resources, writing-original draft preparation, writing-review and editing, visualization, supervision, project administration, funding acquisition.
Gabriela Ribes-Giner: Conceptualization, methodology, validation, investigation, resources, supervision, project administration, funding acquisition.
Luis Fernando Garcés-Giraldo: Conceptualization, methodology, software, validation, data curation, writing-review and editing, visualization.
Diana María Arango-Botero: Conceptualization, validation, data curation.
ACKNOWLEDGMENTS
This paper was written as part of the research entitled "Characterization of motivational factors in young people in a subregion of the department of Antioquia and its relationship with rural entrepreneurship," which was mostly funded by Corporación Universitaria Americana with the support of Universitat Politècnica de València.
FOOTNOTE
- arrow_upward This paper is derived from the project entitled "Characterization of motivational factors in young people in a subregion of the department of Antioquia and its relationship with rural entrepreneurship" and has been financed with resources from Corporación Universitaria Americana and Universitat Politècnica de València, which supported the PhD thesis entitled “Entrepreneurial activity of millennials in Antioquia (Colombia)” available at https://doi.org/10.4995/Thesis/10251/164046
REFERENCES
- arrow_upward Ajaz Khan, K., Çera, G., Netek, V. (2019). Perception of the Selected Business Environment Aspects by Service Firms. Journal of Tourism and Services, v. 10, n. 19, 111-127. https://doi.org/10.29036/jots.v10i19.115
- arrow_upward Akgün, A. A., Baycan-Levent, T., Nijkamp, P., Poot, J. (2011). Roles of Local and Newcomer Entrepreneurs in Rural Development: A Comparative Meta-analytic Study. Regional Studies, v. 45, n. 9, 1207-1223. https://doi.org/10.1080/00343401003792500
- arrow_upward Akgün, A. A., Nijkamp, P., Baycan, T., Brons, M. (2010). Embeddedness of entrepreneurs in rural areas: A comparative rough set data analysis. Tijdschrift Voor Economische En Sociale Geografie, v. 101, n. 5, 538-553. https://doi.org/10.1111/j.1467-9663.2010.00630.x
- arrow_upward Aleksić, D., Rangus, K. (2020). Millennials & Creativity. In Reference Module in Neuroscience and Biobehavioral Psychology. Elsevier. https://doi.org/10.1016/B978-0-12-809324-5.23869-8
- arrow_upward Anca, H. D. B. (2012). Litterature Review of the Evolution of Competitiveness Concept. Annals of the University of Oradea: Economic Science, v. 1, n. 1, 41-46. http://anale.steconomiceuoradea.ro/volume/2012/n1/004.pdf
- arrow_upward Anthopoulou, T., Kaberis, N., Petrou, M. (2017). Aspects and experiences of crisis in rural Greece. Narratives of rural resilience. Journal of Rural Studies, v. 52, 1-11. https://doi.org/10.1016/j.jrurstud.2017.03.006
- arrow_upward Apostolopoulos, N. (2017). Review: Academic influences on rural entrepreneurship. An autobiographical review of Hodge, Gladwin, North and Smallbone. The International Journal of Entrepreneurship and Innovation, v. 18, n. 1, 73-74. https://doi.org/10.1177/1465750316686247
- arrow_upward Arias, F., Ribes-Giner, G. (2019). Evolución del papel del emprendedor rural: del agricultor subordinado del siglo XVIII al empresario rural actual. Revista Venezolana de Gerencia, v. 24, n. 88, 1005-1028. https://www.redalyc.org/journal/290/29062051002/html/
- arrow_upward Arias, F., Ribes-Giner, G., Arango- Botero, D. (2020). Impulsores, barreras y motivaciones para el emprendimiento rural de los millennials en Antioquia-Colombia. Revista de Ciencias Sociales, v. 26, n. 3, 56-70. https://doi.org/10.31876/rcs.v26i3.33231
- arrow_upward Aryal, G., Mann, J., Loveridge, S., Joshi, S. (2018). Exploring innovation creation across rural and urban firms: Analysis of the National Survey of Business Competitiveness. Journal of Entrepreneurship and Public Policy, v. 7, n. 4, 357-376. https://doi.org/10.1108/JEPP-D-18-00026
- arrow_upward Avramenko, A., Silver, J. A. K. (2010). Rural entrepreneurship: expanding the horizons. International Journal of Entrepreneurship and Innovation Management, v. 11, n. 2, 144-155. https://doi.org/10.1504/IJEIM.2010.030065
- arrow_upward Baporikar, N. (2021). Influence of Business Competitiveness on SMEs Performance. In Research Anthology on Small Business Strategies for Success and Survival (pp. 1054–1075). IGI Global. https://doi.org/10.4018/978-1-7998-9155-0.ch052
- arrow_upward Betancur Giraldo, C. M., Yepes Callejas, E. R., Jaramillo Sierra, A. F. (2018). Análisis de la situación y recomendaciones de política de bioeconomía. En Universidad EAFIT, BIOINTROPIC & SILO (Eds.). Estudio sobre bioeconomía como fuente de nuevas industrias basadas en el capital natural de Colombia fase II (pp. 11-92). https://www.redalyc.org/journal/290/29062051002/html/
- arrow_upward Bhawsar, P., Chattopadhyay, U. (2015). Competitiveness: Review, Reflections and Directions. Global Business Review, v. 16, n. 4, 665-679. https://doi.org/10.1177/0972150915581115
- arrow_upward Bianco, C. (2007). ¿De qué hablamos cuando hablamos de competitividad? http://old.centroredes.org.ar/index.php?option=com_content&view=article&id=61:doctrabajo31&catid=8:documentos-de-trabajo&Itemid=44
- arrow_upward Bonfiglio, A., Camaioni, B., Coderoni, S., Esposti, R., Pagliacci, F., Sotte, F. (2017). Are rural regions prioritizing knowledge transfer and innovation? Evidence from Rural Development Policy expenditure across the EU space. Journal of Rural Studies, v. 53, 78-87. https://doi.org/10.1016/j.jrurstud.2017.05.005
- arrow_upward Bosworth, G., Atterton, J. (2012). Entrepreneurial In-migration and Neoendogenous Rural Development. Rural Sociology, v. 77, n. 2, 254-279. https://doi.org/10.1111/j.1549-0831.2012.00079.x
- arrow_upward Caamaño Diaz, C. (2017). Evolución, Situación Actual y Perspectivas De Futuro del Empleo Joven en el Medio Rural en Cantabria. Universidad de Cantabria.
- arrow_upward Capobianco-Uriarte, M. de las M., Casado-Belmonte, M. del P., Marín-Carrillo, G. M., Terán-Yépez, E. (2019). A bibliometric analysis of international competitiveness (1983-2017). Sustainability, v. 11, n. 7, 1877. https://doi.org/10.3390/su11071877
- arrow_upward Comisión Económica para América Latina y el Caribe. (2019). América Latina y el Caribe: Estimaciones y proyecciones de población. Proyecciones Demográficas. https://www.cepal.org/es/temas/proyecciones-demograficas/america-latina-caribe-estimaciones-proyecciones-poblacion
- arrow_upward Chang Moon, H., Peery, N. S. (1995). Competitiveness of product, firm, industry, and nation in a global business. Competitiveness Review, v. 5, n. 1, 37-43. https://doi.org/10.1108/eb046319
- arrow_upward Chang Moon, H., Rugman, A. M., Verbeke, A. (1998). A generalized double diamond approach to the global competitiveness of Korea and Singapore. International Business Review, v. 7, n. 2, 135-150. https://doi.org/10.1016/S0969-5931(98)00002-X
- arrow_upward Chaudhuri, S., Ray, S. (1997). The Competitiveness Conundrum: Literature Review and Reflections. Economic and Political Weekly, v. 32, n. 48, M83-M91. http://www.jstor.org/stable/4406121
- arrow_upward Cho, D.-S., Moon, H.-C., Kim, M.-Y. (2009). Does one size fit all? A dual double diamond approach to country-specific advantages. Asian Business & Management, v. 8, n. 1, 83-102. https://doi.org/10.1057/abm.2008.27
- arrow_upward Congreso de Colombia. (2016). Ley 1780 - 2 de mayo de 2016 (p. 10). Presidencia de la República. http://es.presidencia.gov.co/normativa/normativa/LEY%201780%20DEL%2002%20DE%20MAYO%20DE%202016.pdf
- arrow_upward De la Cruz Martínez, A., Ariza Goenaga, M. A. (2017). Restitución de tierras, paso clave para el posconflicto: estudio de fallos. Revista Jurídica Mario Alario D´Filippo, v. 9, n. 18, 31-40. https://doi.org/10.32997/2256-2796-vol.9-num.18-2017-2052
- arrow_upward Deakins, D., Bensemann, J., Battisti, M. (2016). Entrepreneurial skill and regulation: Evidence from primary sector rural entrepreneurs. International Journal of Entrepreneurial Behavior & Research, v. 22, n. 2, 234-259. https://doi.org/10.1108/IJEBR-12-2014-0240
- arrow_upward DeBoer, J., Panwar, R., Kozak, R., Cashore, B. (2020). Squaring the circle: Refining the competitiveness logic for the circular bioeconomy. Forest Policy and Economics, v. 110, 101858. https://doi.org/10.1016/j.forpol.2019.01.003
- arrow_upward Debolini, M., Valette, E., François, M., Chéry, J.-P. (2015). Mapping land use competition in the rural–urban fringe and future perspectives on land policies: A case study of Meknès (Morocco). Land Use Policy, v. 47, 373-381. https://doi.org/10.1016/j.landusepol.2015.01.035
- arrow_upward Dos Santos, F. T. (2007). The entrepreneur rural region: Competitiveness, sustainability and innovation. In X. Jie (Ed.), Entrepreneurial Strategy Innovation and Sustainable Development (pp. 344-356). SICHUAN UNIV PRESS.
- arrow_upward Dougherty, I., Clarke, A. (2018). Wired for Innovation: Valuing the Unique Innovation Abilities of Emerging Adults. Emerging Adulthood, v. 6, n. 5, 358-365. https://doi.org/10.1177/2167696817739393
- arrow_upward Esser, K., Hillebrang, W., Messner, D., Meyer-Stamer, J. (1996). Competitividad sistémica nuevo desafio para las empresas y la política. Revista de La Cepal, v. 59, 39-52. https://ideas.repec.org/a/ecr/col070/12025.html
- arrow_upward European Commission. (1995). Enhancing European competitiveness. First report to the President of the Commission, the Prime Ministers and Heads of State. June 1995. http://aei.pitt.edu/2866/
- arrow_upward FAO. (2019). 2019-2028 un decenio de oportunidades para el sector rural. FAO En Colombia. https://www.fao.org/colombia/noticias/detail-events/es/c/1201133/
- arrow_upward Ferrando Perea, A. (2015). Asociatividad para mejora de la competitividad de pequeños productores agrícolas. Anales Científicos, v. 76, n. 1, 177-185. https://doi.org/10.21704/ac.v76i1.779
- arrow_upward Global Entrepreneurship Monitor. (2017). Actividad Empresarial Colombiana. Universidad del Norte.
- arrow_upward Gomez-Suarez, A., Perrone, N. M., Prieto Ríos, E. (2016). Foreign Investors and the Colombian Peace Process. International Community Law Review, v. 18, n. 3-4, 223-247. https://doi.org/10.1163/18719732-12341334
- arrow_upward Gómez Gras, J. M., Mira Solves, I., Martínez Mateo, J., Estrada de la Cruz, M. (2015). Actividad Emprendedora en la Comunidad Valenciana. Informe GEM 2015. 1-103.
- arrow_upward Gorbuntsova, T., Dobson, S., Palmer, N. (2018). Rural entrepreneurial space and identity: A study of local tour operators and ‘the Nenets’ indigenous reindeer herders. The International Journal of Entrepreneurship and Innovation, v. 19, n. 4, 261-272. https://doi.org/10.1177/1465750317723220
- arrow_upward Grant, R. M. (1991). The Resource-Based Theory of Competitive Advantage: Implications for Strategy Formulation. California Management Review, v. 33, n. 3, 114-135. https://doi.org/10.2307/41166664
- arrow_upward Holt, S. (2018). Engaging Generation Y: The Millennial Challenge. In Engaged Leadership (pp. 211–222). Springer. https://doi.org/10.1007/978-3-319-72221-4_12
- arrow_upward Instituto Geografico Agustin Codazzi. (2015). Tan solo el 0,3 por ciento de todo el territorio colombiano corresponde a áreas urbanas: IGAC. URL
- arrow_upward Ismail, A. I., Rose, R. C., Uli, J., Abdullah, H. (2012). The Relationship Between Organisational Resources, Capabilities, Systems and Competitive Advantage. Asian Academy of Management Journal, v. 17, n. 1, 151-173. http://web.usm.my/aamj/17.1.2012/AAMJ_17.1.8.pdf
- arrow_upward Jiang, X., Bao, Y., Xie, Y., Gao, S. (2016). Partner trustworthiness, knowledge flow in strategic alliances, and firm competitiveness: A contingency perspective. Journal of Business Research, v. 69, N. 2, 804-814. https://doi.org/10.1016/j.jbusres.2015.07.009
- arrow_upward Koe, W.-L., Sa’ari, J. R., Majid, I. A., Ismail, K. (2012). Determinants of Entrepreneurial Intention Among Millennial Generation. Procedia - Social and Behavioral Sciences, v. 40, 197-208. https://doi.org/10.1016/j.sbspro.2012.03.181
- arrow_upward Koyana, S., Mason, R. B. (2017). Rural entrepreneurship and transformation: the role of learnerships. International Journal of Entrepreneurial Behavior & Research, v. 23, n. 5, 734-751. https://doi.org/10.1108/IJEBR-07-2016-0207
- arrow_upward Kristensen, S., Birch-Thomsen, T. (2013). Should I stay or should I go? Rural youth employment in Uganda and Zambia. International Development Planning Review, v. 35, n. 2, 175-201. https://doi.org/10.3828/idpr.2013.12
- arrow_upward Lafuente, E., Gómez-Araujo, E. (2016). The Territorial Economic Impact of Entrepreneurial Youthfulness. Strategic Change, v. 25, n. 2, 187-204. https://doi.org/10.1002/jsc.2055
- arrow_upward Lafuente, E., Szerb, L., Rideg, A. (2016). A System Dynamics Approach for Assessing Business Competitiveness. SSRN. https://doi.org/10.2139/ssrn.2892221
- arrow_upward Latruffe, L. (2010). Competitiveness, Productivity and Efficiency in the Agricultural and Agri-Food Sectors. OECD Publishing. https://doi.org/10.1787/5km91nkdt6d6-en
- arrow_upward Laverde, F., Osorio, F., Medina, L., Varela, R., Gomez, E., Parra, L. D., Matiz, F., Buelvas, P., Gomez, L., Rueda, F. (2019). GEM Colombia. Estudio de la actividad empresarial en 2017. https://manglar.uninorte.edu.co/bitstream/handle/10584/8370/9789587890563%20eGEM%20Colombia%202017.pdf?sequence=1&isAllowed=y
- arrow_upward Lee, M., Lee, S. (2017). Identifying new business opportunities from competitor intelligence: An integrated use of patent and trademark databases. Technological Forecasting and Social Change, v. 119, 170-183. https://doi.org/10.1016/j.techfore.2017.03.026
- arrow_upward LeGrand, C. C., van Isschot, L., Riaño-Alcalá, P. (2017). Land, justice, and memory: challenges for peace in Colombia. Canadian Journal of Latin American and Caribbean Studies, v. 42, n. 3, 259-276. https://doi.org/10.1080/08263663.2017.1378381
- arrow_upward Liu, J. (2011). Human capital, migration and rural entrepreneurship in China. Indian Growth and Development Review, v. 4, n. 2, 100-122. https://doi.org/10.1108/17538251111172023
- arrow_upward Liu, J., Zhu, Y., Serapio, M. G., Cavusgil, S. T. (2019). The new generation of millennial entrepreneurs: A review and call for research. International Business Review, v. 28, n. 5, 101581. https://doi.org/10.1016/j.ibusrev.2019.05.001
- arrow_upward Marques, C. S., Santos, G., Ratten, V., Barros, A. B. (2019). Innovation as a booster of rural artisan entrepreneurship: a case study of black pottery. International Journal of Entrepreneurial Behavior & Research, v. 25, n. 4, 753-772. https://doi.org/10.1108/IJEBR-02-2018-0104
- arrow_upward McElwee, G., Atherton, A. (2011). Rural entrepreneurship. Rural entrepreneurship. In L.-P. Dana (ed.). World Encyclopedia of Entrepreneurship (pp. 377–384). Edward Elgar Publishing.
- arrow_upward Moreno-Gómez, J., Lafuente, E. (2019). Analysis of competitiveness in Colombian family businesses. Competitiveness Review, v. 30, n. 3, 339-354. https://doi.org/10.1108/CR-11-2018-0074
- arrow_upward Moya‐Clemente, I., Ribes‐Giner, G., Pantoja‐Díaz, O. (2019). Configurations of sustainable development goals that promote sustainable entrepreneurship over time. Sustainable Development, v. 28, n. 4, 572-584. https://doi.org/10.1002/sd.2009
- arrow_upward Nájera Ochoa, J. (2015). Un modelo de competitividad para el sector textil en México. Revista Universidad Y Empresa, v. 17, n. 28, 37-68. https://doi.org/10.12804/rev.univ.empresa.28.2015.02
- arrow_upward North, D., Smallbone, D. (2006). Developing entrepreneurship and enterprise in Europe’s peripheral rural areas: Some issues facing policy-makers. European Planning Studies, v. 14, n. 1, 41-60. https://doi.org/10.1080/09654310500339125
- arrow_upward Pato, M. L., Teixeira, A. A. C. (2016). Twenty Years of Rural Entrepreneurship: A Bibliometric Survey. Sociologia Ruralis, v. 56, n. 1, 3-28. https://doi.org/10.1111/soru.12058
- arrow_upward Phillipson, J., Tiwasing, P., Gorton, M., Maioli, S., Newbery, R., Turner, R. (2019). Shining a spotlight on small rural businesses: How does their performance compare with urban? Journal of Rural Studies, v. 68, 230-239. https://doi.org/10.1016/j.jrurstud.2018.09.017
- arrow_upward Piabuo, S. M., Yakan, H. B., Puatwoe, J. T., Nonzienwo, V. Y., Mamboh, T. R. (2020). Effect of rural farmers’ access to information on price and profits in Cameroon. Cogent Food & Agriculture, v. 6, n. 1, 1799530. https://doi.org/10.1080/23311932.2020.1799530
- arrow_upward Porter, M. E. (1990). The Competitive Advantage of Nations. Free Press.
- arrow_upward Porter, M. E., Kramer, M. R. (2019). Creating Shared Value. In Managing Sustainable Business (pp. 327–350). Springer Netherlands. https://doi.org/10.1007/978-94-024-1144-7_16
- arrow_upward Puyana, A., Costantino, A. (2015). Chinese Land Grabbing in Argentina and Colombia. Latin American Perspectives, v. 42, n. 6, 105-119. https://doi.org/10.1177/0094582X15594394
- arrow_upward Rehman, A. U., Al-Zabidi, A., AlKahtani, M., Umer, U., Usmani, Y. S. (2020). Assessment of Supply Chain Agility to Foster Sustainability: Fuzzy-DSS for a Saudi Manufacturing Organization. Processes, v. 8, n. 5, 577. https://doi.org/10.3390/pr8050577
- arrow_upward Restrepo, J. C., Bernal Morales, A. (2014). La cuestión agraria: tierra y posconflicto en Colombia. Penguin Random House.
- arrow_upward Ribes Giner, G., Arias, F. (2018). Oportunidades del emprendimiento rural en un marco de posconflicto en Colombia. En G. E. Pacheco, J. A. Escobar, L. Muñoz, y G. F. Niño (Comp.), Derechos laborales, fomento económico, informalidad y desarrollo (pp. 196-210). Serie documentos estudios legislativo No. 9. Centro de Altos Estudios Legislativos - Congreso de la República de Colombia.
- arrow_upward Ropero Beltrán, S. (2016). Desarrollo rural en Colombia, entre la realidad y la oportunidad en el posconflicto. Perspectivas Rurales Nueva Época, v. 14, n. 27, 13-35. https://www.revistas.una.ac.cr/index.php/perspectivasrurales/article/view/7608
- arrow_upward Rubio‐Andrés, M., Ramos‐González, M. del M., Sastre‐Castillo, M. Á., Danvila‐del‐Valle, I. (2020). Exploring sustainability, good governance, and social responsibility in small and medium enterprises. Corporate Social Responsibility and Environmental Management, v. 27, n. 2, 852-869. https://doi.org/10.1002/csr.1849
- arrow_upward Saavedra García, M. L. (2014). Hacia la determinación de la competitividad en la pyme latinoamericana. UNAM. http://acacia.org.mx/busqueda/pdf/15_04_competitividad.pdf
- arrow_upward Salemink, K., Strijker, D., Bosworth, G. (2017). Rural development in the digital age: A systematic literature review on unequal ICT availability, adoption, and use in rural areas. Journal of Rural Studies, v. 54, 360-371. https://doi.org/10.1016/j.jrurstud.2015.09.001
- arrow_upward Sánchez Castañeda, J. (2017). Mercado de productos agrícolas ecológicos en Colombia. Suma de Negocios, v. 8, n. 18, 156-163. https://doi.org/10.1016/j.sumneg.2017.10.001
- arrow_upward Satyalakshmi, K. (2017). Understanding the Entrepreneurial Intentions of the Indian Millennials: A Pilot Study. Journal of Entrepreneurship Development, v. 14, n. 2. https://www.proquest.com/scholarly-journals/understanding-entrepreneurial-intentions-indian/docview/1920632298/se-2?accountid=30687
- arrow_upward Serrano-Amado, A.-M., Montoya-Restrepo, L.-A., Cazares, I. (2018). Análisis de la sostenibilidad y competitividad turística en Colombia. Gestión y Ambiente, v. 21, n. 1, 99-109. https://doi.org/10.15446/ga.v21n1.69395
- arrow_upward Serrano, A., Brooks, A. (2019). Who is left behind in global food systems? Local farmers failed by Colombia’s avocado boom. Environment and Planning E: Nature and Space, v. 2, n. 2, 348-367. https://doi.org/10.1177/2514848619838195
- arrow_upward Solleiro Rebolledo, J. L., Castañón, R. (2004). Competitividad y sistemas de innovación: los retos para la inserción de México en el contexto global. Temas de Iberoamérica-Globalización, Ciencia y Tecnología, v. 2, 165-197. https://nanopdf.com/download/competitividad-y-sistemas-de-innovacion-los-retos-para-la-insercion_pdf
- arrow_upward Stockdale, A. (2016). Contemporary and ‘Messy’ Rural In-migration Processes: Comparing Counterurban and Lateral Rural Migration. Population, Space and Place, v. 22, n. 6, 599-616. https://doi.org/10.1002/psp.1947
- arrow_upward Strochenko, N. I., Koblianska, I. I. (2016). Essential and organizational transformations of economy management in the countryside as the basis of sustainable rural development in Ukraine. Marketing and Management of Innovations, n. 3, 293-308. https://mmi.fem.sumdu.edu.ua/en/journals/2016/3/293-308
- arrow_upward Suarez, A., Árias-Arévalo, P. A., Martínez-Mera, E. (2018). Environmental sustainability in post-conflict countries: insights for rural Colombia. Environment, Development and Sustainability, v. 20, n. 3, 997-1015. https://doi.org/10.1007/s10668-017-9925-9
- arrow_upward Sur, M., Zhang, J., Chen, K. (2014). The investment climate and enterprise performance in rural Pakistan: implications for rural non-farm employment generation. Journal of the Asia Pacific Economy, v. 19, n. 3, 488-505. https://doi.org/10.1080/13547860.2014.908537
- arrow_upward Švagždienė, B., Perkumienė, D. (2018). Evaluation of competitiveness factors of rural communities. Proccedings of International Scientific Conference “RURAL DEVELOPMENT 2017.” https://doi.org/10.15544/RD.2017.211
- arrow_upward Treasury, H. M. S. (1983). International Competitiveness (Economic Progress Report).
- arrow_upward Tunberg, M. (2014). Approaching rural firm growth: a literature review. Journal of Enterprising Communities: People and Places in the Global Economy, v. 8, n. 4, 261-286. https://doi.org/10.1108/JEC-11-2013-0039
- arrow_upward United States. (1985). Report of the President’s Commission on Industrial Competitiveness: hearing before the Subcommittee on Economic Stabilization of the Committee on Banking, Finance, and Urban Affairs, House of Representatives, Ninety-ninth Congress, first session, March 5. URL
- arrow_upward Urueña, R. (2016). The Colombian Peace Negotiation and Foreign Investment Law. AJIL Unbound, v. 110, 199-204. https://doi.org/10.1017/S239877230000307X
- arrow_upward Varum, C., Guimarães, C., Oliveira, J. M., Martins, A. (2020). Industrial dynamics in the context of a region’s international competitiveness. Local Economy, v. 35, n. 3, 209-229. https://doi.org/10.1177/0269094220922823
- arrow_upward Waheeduzzaman, A. N. M. (2011). Competitiveness and convergence in G7 and emerging markets. Competitiveness Review, v. 21, n. 2, 110-128. https://doi.org/10.1108/10595421111117425
- arrow_upward Wortman Jr, M. S. (1990). Rural entrepreneurship research: An integration into the entrepreneurship field. Agribusiness, v. 6, n. 4, 329-344. https://doi.org/10.1002/1520-6297(199007)6:4<329::AID-AGR2720060405>3.0.CO;2-N
- arrow_upward Ye, S., Xiao, H., Zhou, L. (2019). Small accommodation business growth in rural areas: Effects on guest experience and financial performance. International Journal of Hospitality Management, v. 76 Part A, 29-38. https://doi.org/10.1016/j.ijhm.2018.03.016
- arrow_upward Zaremohzzabieh, Z., Samah, B. A., Muhammad, M., Omar, S. Z., Bolong, J., Shaffril, H. A. M. (2016). An investigation into factors influencing rural youth entrepreneurs’ intentions to use ICT: a case of Malaysia. International Journal of Entrepreneurship and Small Business, v. 27, n. 4, 480-504. https://doi.org/10.1504/IJESB.2016.075010
- arrow_upward Zhang, T., Acs, Z. (2018). Age and entrepreneurship: nuances from entrepreneur types and generation effects. Small Business Economics, v. 51, n. 4, 773-809. https://doi.org/10.1007/s11187-018-0079-4
ANNEX
ANEXO 1. Índice de competitividad promedio por región
| Eastern Antioquia | Valle de Aburrá except for Medellín | Medellín | Southwestern and northern Antioquia | Others | |
| Human capital | 0.6962 | 0.6531 | 0.6485 | 0.6826 | 0.7182 |
| Product | 0.7032 | 0.7164 | 0.7780 | 0.6371 | 0.6781 |
| Domestic market | 0.6673 | 0.7373 | 0.7041 | 0.7383 | 0.6664 |
| Networks | 0.5925 | 0.5612 | 0.5744 | 0.6071 | 0.5938 |
| Technology | 0.5945 | 0.6076 | 0.7079 | 0.5802 | 0.5934 |
| Decision making | 0.6216 | 0.6567 | 0.6834 | 0.6401 | 0.6622 |
| Competitive strategy | 0.6120 | 0.6810 | 0.6920 | 0.6789 | 0.6660 |
| Marketing | 0.5797 | 0.6234 | 0.6495 | 0.5261 | 0.6357 |
| Internationalization | 0.4994 | 0.4191 | 0.5595 | 0.4987 | 0.4936 |
| Online presence | 0.5416 | 0.6167 | 0.6650 | 0.4945 | 0.5795 |
| CI | 6.1081 | 6.2725 | 6.6622 | 6.0837 | 6.2868 |
ANEXO 2. Índice de competitividad promedio por sector económico
| Agriculture, livestock, and agro-industry | Services | Trade and others | |
| Human capital | 0.6819 | 0.7386 | 0.6453 |
| Product | 0.6965 | 0.7703 | 0.6622 |
| Domestic market | 0.7090 | 0.7569 | 0.6599 |
| Networks | 0.5970 | 0.7019 | 0.5100 |
| Technology | 0.5962 | 0.6892 | 0.6027 |
| Decision making | 0.6582 | 0.7137 | 0.5990 |
| Competitive strategy | 0.6684 | 0.6605 | 0.6449 |
| Marketing | 0.5914 | 0.6885 | 0.5547 |
| Internationalization | 0.4964 | 0.4407 | 0.4686 |
| Online presence | 0.5097 | 0.6358 | 0.5764 |
| CI | 6.2047 | 6.7961 | 5.9236 |
ANEXO 3. Resultados del MANOVA
| Origin | Dependent variable | Type III sum of squares | gl | Root mean square | F | Sig. |
| Age of the company | HUM_CAP | 2.867 | 1 | 2.867 | 2.302 | .131 |
| PRO | .047 | 1 | .047 | .049 | .824 | |
| DOM_MARK | .383 | 1 | .383 | .446 | .505 | |
| NETW | 1.592 | 1 | 1.592 | .937 | .335 | |
| TECH | 2.303 | 1 | 2.303 | 1.633 | .203 | |
| DEC_MAK | 2.736 | 1 | 2.736 | 2.482 | .117 | |
| COMP_STRAT | 9.017 | 1 | 9.017 | 12.334 | .001 | |
| MARK | 5.296 | 1 | 5.296 | 4.161 | .043 | |
| INT | 3.673 | 1 | 3.673 | 2.100 | .149 | |
| ONL_PRE | 5.890 | 1 | 5.890 | 3.498 | .063 | |
| Error | HUM_CAP | 181.856 | 146 | 1.246 | ||
| PRO | 140.223 | 146 | .960 | |||
| DOM_MARK | 125.475 | 146 | .859 | |||
| NETW | 248.050 | 146 | 1.699 | |||
| TECH | 205.880 | 146 | 1.410 | |||
| DEC_MAK | 160.993 | 146 | 1.103 | |||
| COMP_STRAT | 106.733 | 146 | .731 | |||
| MARK | 185.812 | 146 | 1.273 | |||
| INT | 255.408 | 146 | 1.749 | |||
| ONL_PRE | 245.860 | 146 | 1.684 | |||
| Total corrected | HUM_CAP | 184.723 | 147 | |||
| PRO | 140.270 | 147 | ||||
| DOM_MARK | 125.858 | 147 | ||||
| NETW | 249.642 | 147 | ||||
| TECH | 208.182 | 147 | ||||
| DEC_MAK | 163.730 | 147 | ||||
| COMP_STRAT | 115.750 | 147 | ||||
| MARK | 191.108 | 147 | ||||
| INT | 259.081 | 147 | ||||
| ONL_PRE | 251.750 | 147 |