Application of the Zavgren Model for Assessing Financial Insolvency in the Construction Industry (2018–2022)
Aplicación del modelo Zavgren en el análisis de la insolvencia financiera en el sector constructor entre 2018-2022
 PDF
Received: December 17, 2024
Accepted: May 14, 2025
Caicedo Carrero, A., & Isaac Roque, D. (2025). Application of the Zavgren Model for Assessing Financial Insolvency in the Construction Industry (2018–2022). Revista CEA, 11(26), e3357. https://doi.org/10.22430/24223182.3357
Abstract
Objective: To identify the feasibility of applying the Zavgren model for estimating the probability of financial insolvency among Colombian construction firms between 2018 and 2022.
Design/Methodology: Adopting a quantitative, exploratory, and descriptive approach this study examines the predictive capacity of the Zavgren model within the context of the Colombian construction industry. To this end, a sample of 734 firms that systematically reported financial information from 2018 to 2022 was analyzed.
Findings: More than 80% of the firms assessed were classified in the bankruptcy zone, which reflects significant financial vulnerability within the industry. However, year-over-year variation in insolvency risk was also observed, suggesting that despite the model’s indication of elevated overall risk, insolvency conditions across firms are heterogeneous.
Conclusions: The findings reveal a high proportion of firms at risk of insolvency, as well as substantial heterogeneity in risk levels across the sample. While the Zavgren model proves effective in identifying overall insolvency risk within the industry, its ability to discriminate between different levels of risk remains limited, likely due to industry-specific factors and characteristics not accounted for in the model.
Originality: This is the first study to apply the Zavgren model in the Colombian context, offering insights into its relevance and limitations. It combines cross-sectional and longitudinal statistical analyses over a five-year period, enhancing understanding of financial insolvency dynamics and the impact of firm-level endogenous variables. The study also underscores the importance of adapting insolvency prediction models to the specific conditions of emerging markets such as Colombia.
Keywords: financial insolvency, financial management, Zavgren model, financial analysis, bankruptcy prediction.
JEL Codes: C53, G33.
Highlights
Resumen
Palabras clave: Objetivo: identificar la viabilidad del uso del modelo Zavgren en empresas del sector constructor colombiano para medir la probabilidad de insolvencia financiera entre los años 2018 y 2022.
Diseño/metodología: la investigación se desarrolla con un enfoque cuantitativo de tipo exploratorio y descriptivo. Este alcance de investigación busca medir la viabilidad del modelo Zavgren como herramienta de predicción en empresas del sector constructor de Colombia; para tal fin se analizan 734 empresas que reportaron información financiera de forma sistemática entre 2018-2022.
Resultados: más del 80 % de las empresas evaluadas se ubicaron en la zona de quiebra, lo que refleja una vulnerabilidad significativa en el sector. Sin embargo, se observaron variaciones interanuales en los niveles de riesgo de insolvencia financiera, mostrando que, aunque el modelo marca un riesgo elevado, existe heterogeneidad en las condiciones de insolvencia financiera de las empresas.
Conclusiones: hay una alta proporción de empresas en riesgo de insolvencia financiera y una heterogeneidad significativa en los resultados que sugiere variaciones en los niveles de riesgo de quiebra entre las empresas. Este patrón de resultados muestra que el modelo es efectivo para señalar el riesgo global de insolvencia en el sector, pero su capacidad para descifrar entre diferentes niveles de riesgo es limitada. Esto se debe a factores específicos y características del sector que no son capturadas por el modelo.
Originalidad: esta investigación, primera en aplicar el modelo Zavgren en Colombia, evidencia su relevancia y sus limitaciones en el entorno nacional. El estudio contiene análisis estadísticos transversales y longitudinales en una ventana de observación de cinco años, lo que permite una comprensión de las dinámicas de insolvencia financiera y el impacto de variables endógenas empresariales. La investigación pone en evidencia la importancia de adaptar modelos de predicción de insolvencia para las características específicas de mercados emergentes como el colombiano.
Palabras clave: insolvencia financiera, gestión financiera, modelo Zavgren, análisis financiero, predicción de quiebra.
Códigos JEL: C53, G33.
Highlights
1. INTRODUCTION
The Colombian construction industry plays a vital role in the country’s economic and social development, acting as a catalyst for growth in other industries (
However, this industry faces considerable challenges due to rising raw material costs, driven by supply-demand factors in the post-pandemic recovery period. These price increases have reached unprecedented levels, directly affecting the operational capacity of construction firms. According to the
Additionally, the Bank of the Republic of Colombia’s decision to raise interest rates has increased the cost of financing, which limits access to affordable credit for construction firms. This scenario presents a critical challenge, as firms must navigate escalating input costs while maintaining sustainable economic development (
Therefore, this context compels Colombian construction firms to adopt innovative yet robust financial strategies to counter the effects of rising inflation. The current outlook for this industry underscores the need for a comprehensive approach to financial management, aimed at promoting sustainable economic development and minimizing the risk of financial insolvency (
The proactive identification of insolvency signs is essential for ensuring corporate continuity and stability, particularly in volatile economic environments (
Building on this perspective,
Given the critical importance of anticipating financial distress, recent research has focused on identifying analytical tools that enhance early detection. Internationally, studies have aimed to improve the predictive accuracy of insolvency models in the construction industry through diverse methodological approaches. For instance,
A further application of insolvency models is seen in Ethiopia, where
Similarly,
In Latin America,
Similarly,
International and national research reflects growing concern about financial distress in the construction industry, driven by the recurrent nature of bankruptcy in market economies (
Given the interdependence of the construction industry with multiple areas of the economy, the ability to foresee financial instability is essential for safeguarding both construction firms and their workforce. Considering Colombia’s current economic volatility and the specific challenges of its construction industry, this study proposes the application of the Zavgren model to predict insolvency risk in Colombian construction firms for the period 2018–2022. This approach aims to address the shortcomings of prior models by focusing on endogenous variables that better capture the internal financial dynamics of these organizations, offering a more context-sensitive and robust predictive framework.
The rest of this paper Is structured as follows: A review of the literature on the use of the Zavgren model as a financial insolvency prediction tool is provided. The methodology applied during the research is then introduced. Following this section, the results, discussion, and conclusions of the study are presented.
2. THEORETICAL FRAMEWORK
Bankruptcy is widely recognized as a disruptive event (
In response to this limitation,
While insolvency models are primarily designed to predict bankruptcy (
Within the field of finance, a wide variety of insolvency prediction models have been developed (
- Statistical models: These rely on techniques such as univariate analysis, risk indices, Multiple Discriminant Analysis (MDA), and conditional probability. They typically use financial ratios and quantitative indicators to estimate the likelihood of insolvency.
- Artificial Intelligence (AI) models: This group includes survival analysis, decision trees, and artificial neural networks, which aim to replicate human reasoning in assessing a company’s financial stability.
-
Alternative models: These encompass approaches such as fuzzy logic classification, chaos theory, dynamic event analysis, and expert systems. They often integrate both qualitative and quantitative methodologies to enhance predictive accuracy.
Among the various families of insolvency prediction models, statistical models remain prominent, with MDAs emerging as one of the most widely used techniques for bankruptcy forecasting (
Designed to predict bankruptcy in U.S. companies up to five years in advance,
According to
One notable application of the Zavgren model is the study by
Another relevant study is that by
Similarly,
In India, the Zavgren model has also been applied to firms listed on the national stock exchange.
Similarly,
Overall, these studies demonstrate the broad applicability of the Zavgren model across diverse industries and geographical contexts given its consistent ability to detect general insolvency trends. However, it is important to consider both the adaptability and restrictions of the Zavgren model as a prediction tool within the set of financial insolvency prediction models. Principio del formulario
3. METHODOLOGY
This research employs an exploratory and descriptive quantitative approach. To meet the research objectives, the Zavgren model is applied as a financial indicator to assess the probability of insolvency among construction firms in Colombia.
The sample comprises Colombian construction companies that consistently reported financial information between 2018 and 2022 in the Integrated Corporate Information System (abbreviated SIIS in Spanish) of the Colombian Superintendency of Companies. Using an imputation technique, a total of 734 companies meeting these criteria were identified for analysis.
The selected period holds significant economic and social relevance for Colombia. During these years, the construction industry experienced notable fluctuations driven by events such as the global economic slowdown and the COVID-19 pandemic, which disrupted market dynamics within the industry. These conditions provide a suitable context to analyze how external pressures impact financial soundness and to test the Zavgren model’s predictive capacity under stress conditions .
Table 1 presents the distribution of these companies based on asset values expressed in current monthly legal minimum wages for 2022.
Tabla 1. Distribución empresas incluidas en este estudio
Type of Firm | No. of Firms | % |
Micro | 1 | 0.1 % |
Small | 39 | 5.3 % |
Medium | 328 | 44.7 % |
Large | 366 | 49.9 % |
Total | 734 | 100.0 % |
Based on the sample, 94.6% of the firms are classified as medium and large enterprises according to their 2022 asset values. This predominance highlights the significant role these companies play within Colombian broader economy. After defining the target firms, the seven variables established by Zavgren are calculated, incorporating liquidity indicators, operating profitability, and capital structure. Applying the original version of the model ensures adherence to its mathematical formulation, maintaining consistency and enabling comparisons with previous studies in other industries and contexts. The calculation structure for the financial indicators within the Zavgren model is outlined below:
Variable X1 measures the proportion of prior-year results (retained earnings or accumulated losses) relative to total sales. A higher value indicates that retained earnings represent a significant portion of sales volume for the period analyzed. The calculation structure for Variable X1 is presented in Equation (1)
 (1)
Variable X2 compares a firm’s total liabilities to its accumulated retained earnings. A higher value indicates that the firm carries a significant level of debt relative to its retained earnings, which signals potential financial vulnerability. The calculation structure for X2 is shown in Equation (2)
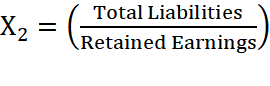 (2)
Variable X3 measures liquidity by comparing cash and cash equivalents to retained earnings from the most recent period. A higher value suggests that greater liquidity relative to earnings reduces the risk of insolvency. The calculation structure for X3 is displayed in Equation (3)
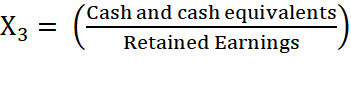 (3)
Variable X4 represents the ratio of cash and cash equivalents to current liabilities (short-term obligations), which indicates the firm’s ability to meet immediate obligations using its most liquid assets. The calculation structure for X4 is exhibited in Equation (4)
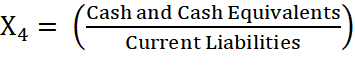 (4)
Variable X5 serves as a measure of operating efficiency, comparing operating income to net working capital. This ratio reflects how effectively the firm’s operations generate earnings per unit of working capital. The calculation structure for X5 is presented in Equation (5)
 (5)
Variable X6 measures the ratio of total assets to current liabilities, indicating the firm’s capacity to meet short-term obligations using its total asset base. The calculation structure for X6 is shown in Equation (6)
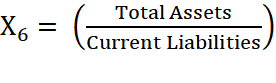 (6)
Variable X7 represents the ratio of revenue from core business operations to net profit for the accounting period. A lower value suggests that the company efficiently converts sales into profit. The calculation structure for X7 is displayed in Equation (7)
 (7)
Once all financial indicators comprising the Z-Score model are calculated, the Zavgren model is applied using the following Equation (8)
 (8)
The probability of financial insolvency is then estimated using Equation (9)
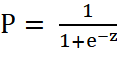 (9)
where e is Euler’s number (2.7182818284).
To interpret the Zavgren model results, the three categories of bankruptcy presented by
Following the classification, the dispersion of results is evaluated using the measurement scale proposed by
Note: CV stands for Coefficient of Variation.
To validate the consistency of the Z-Score model results, two hypothesis tests are proposed:
- Cross-sectional hypothesis testing evaluates, year by year, whether there is statistical evidence that construction firms in Colombia, on average, exhibit a high probability of insolvency.
- Longitudinal hypothesis testing examines whether, across the observation period, construction firms in Colombia consistently show signs of financial insolvency.
The null and alternative hypotheses for the cross-sectional test are as follows:
The significance level for hypothesis validation is 5% (α = 5%). Therefore, the non-rejection value of H1 will be if Z < -1.64. Based on the above, Equation (10) applies:
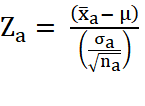 (10)
where:
Za = Test statistic for year .
\(\overline{\bar{x}}_a \) = Average Zavgren model score for construction firms in Colombia in year a.
μ= Expected threshold score for the Zavgren model (0.6).
σa = Standard deviation of Zavgren scores for construction firms in Colombia in year a.
√na = Number of construction firms in Colombia analyzed in year a.
To complement this analysis, a longitudinal hypothesis test is performed for each firm across the period 2018–2022:
Since the analysis covers five years (n < 30), a Student’s t-test is applied, using a 5% significance level (α = 5 %) with n−1 degrees of freedom. Therefore, the non-rejection value for H1 will be if t < -2.1318. The test statistic is calculated as shown in Equation (11)
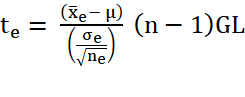 (11)
te = Test statistic for firm e.
\( {\bar{x}}_e \) = The average Zavgren model score for firm e during 2018–2022.
µ = Expected threshold score for the Zavgren model (0.6).
σe = Standard deviation of Zavgren scores for firm e during 2018 – 2022.
ne = Number of years analyzed for firm e.
The application of the statistical methods described above enables the analysis of both temporal variations and persistence in financial insolvency, which reveals underlying dynamics within the construction industry.
To evaluate the relevance and significance of the variables within the Zavgren model, logistic regression analyses were conducted for each year during the 2018–2022 period. This technique systematically assesses the explanatory power of each variable in relation to the probability of financial insolvency. Data processing and analysis were performed using Stata, a software recognized for its robustness in econometric modeling and its capacity to handle large datasets.
Logistic regression was selected due to its effectiveness in modeling binary outcomes, such as the presence or absence of insolvency, which enables the direct interpretation of the relationship between explanatory variables and bankruptcy risk. To ensure result robustness, sensitivity analyses were conducted by introducing variations in financial variables and observing their impact on estimated probabilities. This approach identified the most influential predictors of insolvency and confirmed the consistency of the Zavgren model when applied to firms within the Colombian construction industry.
It is important to acknowledge the limitations of this research when analyzing and interpreting the results. First, the Zavgren model was applied in its original form, without specific adjustments to the Colombian context. Second, although the sample includes firms reporting data to the ICCV between 2018 and 2022, firms with incomplete data that did not meet the imputation criteria were excluded, which may affect the findings. Additionally, the analysis is based solely on financial statements, restricting the scope to internal quantitative indicators while excluding exogenous factors such as regulatory uncertainty, macroeconomic conditions, and corporate governance quality. Finally, the logistic regression applied to validate the model exhibited low predictive sensitivity, thus the potential need for hybrid models or more advanced statistical techniques in future research stands out.
4. RESULTS
Based on the selected sample, the Zavgren model was applied to the 734 firms in the Colombian construction industry. As shown in Table 2, the distribution of results considers the percentages of firms in the Colombian construction industry that are in the bankruptcy, gray, and healthy areas during the 2018–2022 period.
Tabla 2. Resultados del modelo Zavgren
Area | 2018 | 2019 | 2020 | 2021 | 2022 |
Bankruptcy | 83.8 % | 86.0 % | 65.8 % | 84.1 % | 80.2 % |
Grey | 2.0 % | 1.1 % | 1.9 % | 1.6 % | 2.2 % |
Healthy | 14.2 % | 12.9 % | 32.3 % | 14.3 % | 17.6 % |
Total | 100.0 % | 100.0 % | 100.0 % | 100.0 % | 100.0 % |
Over the five-year period, a significant proportion of firms consistently fell within the bankruptcy area, with percentages exceeding 80%, except in 2020. This trend suggests that, according to the model, most construction firms in Colombia face a high risk of insolvency, which indicates potential structural or cyclical vulnerabilities within the industry. The gray area, representing financial uncertainty, accounted for only 1.1% to 2.2% of firms during this period, showing that few firms exhibited borderline financial conditions according to the model. Conversely, firms classified in the healthy area represented a minority, with a notable increase to 32.3% in 2020, likely reflecting temporary improvements or industry adjustments during that year. However, this proportion declined in subsequent years and returned to levels similar to those observed in 2018 and 2019.
The predominance of firms in the bankruptcy area and their limited representation in the healthy area raise concerns regarding the financial resilience of the industry. These findings may point to underlying structural challenges, market dynamics, or potential limitations of the Zavgren model in capturing the specific financial characteristics of Colombian construction firms.
Table 3 presents the heterogeneity analysis of the Zavgren model results for the Colombian construction industry from 2018 to 2022.
Tabla 3. Análisis de heterogeneidad del promedio de probabilidad de insolvencia
| Measure | 2018 | 2019 | 2020 | 2021 | 2022 |
| Average | 0.84 | 0.86 | 0.66 | 0.84 | 0.80 |
| Standard Deviation | 0.34 | 0.33 | 0.45 | 0.35 | 0.37 |
| Coefficient of Variation | 40.9 % | 38.6 % | 68.4 % | 41.3 % | 46.4 % |
| Interpretation | Heterogeneous | ||||
The average scores indicate a consistent trend toward the bankruptcy area (scores > 0.6) in 2018, 2019, 2021, and 2022, with respective averages of 0.84, 0.86, 0.84, and 0.80, while 2020 shows a temporary decline to 0.66. Standard deviations range from 0.33 to 0.45, and coefficients of variation range from 38.6% to 68.4%, which reflects moderate to high dispersion in the scores across firms each year. This heterogeneity (CV > 30%) reveals that, despite the general trend toward insolvency risk, there is considerable variability in the financial health among construction firms. Such variability may reflect differences in financial strength and risk management practices among firms within the industry.
The highest heterogeneity was observed in 2020, with a CV of 68.4%, possibly influenced by the effects of industry-specific or external factors during that year. These results suggest that while the Zavgren model classified a large proportion of firms at risk of insolvency, the actual industry situation may be more balanced.
Table 4 presents the results of the cross-sectional hypothesis test conducted for each year from 2018 to 2022.
Tabla 4. Resultado prueba de hipótesis transversal
Measure | 2018 | 2019 | 2020 | 2021 | 2022 |
Sample Mean | 0.84 | 0.86 | 0.66 | 0.84 | 0.80 |
Expected Mean | 0.60 | 0.60 | 0.60 | 0.60 | 0.60 |
Standard Deviation | 0.34 | 0.33 | 0.45 | 0.35 | 0.37 |
No. of Firms | 734 |
||||
Rejection Value | -1.64 |
||||
Test Statistic | 18.99 | 21.04 | 3.79 | 18.69 | 14.69 |
Decision | Reject H1 |
||||
The results of the cross-sectional hypothesis tests indicate that firms in this industry exhibited a high probability of insolvency. The test statistics for all years exceeded the critical value of 1.64, leading to the rejection of the alternative hypothesis (H1) in favor of the null hypothesis (H0). This means that the average insolvency probability significantly exceeded the threshold of 0.6 each year, indicating a persistently high level of financial vulnerability. Additionally, the sample means ranged from 0.66 (2020) to 0.86 (2019), with standard deviations between 0.33 and 0.45, reinforcing the conclusion that Colombian construction firms faced consistently elevated insolvency risks throughout the study period.
Table 5 presents the results of the longitudinal hypothesis test, which evaluates insolvency risk across the five-year period at the firm level.
Tabla 5. Resultado prueba de hipótesis longitudinal
Decision | No. of Firms | Percentage |
Reject H1 | 704 | 95.9 % |
Fail to Reject H1 | 30 | 4.1 % |
Total | 734 | 100.0 % |
The results show that among the 734 firms examined, 95.9% (704) had an average insolvency score of 0.6 or higher over the five-year period, thereby refuting the alternative hypothesis. This finding further reinforces the conclusion that most construction firms in Colombia maintained a high level of financial vulnerability during the study period. Conversely, an average score below the threshold was attained by only 4.1% (30) of firms, indicating a more stable financial condition for this minority group.
To assess the model’s accuracy, official data from the Colombian Superintendence of Companies were consulted to identify firms that underwent business reorganization between 2018 and 2022. Table 6 summarizes the findings.
Tabla 6. Empresas del sector constructor de Colombia en reorganización empresarial
Concept | 2018 | 2019 | 2020 | 2021 | 2022 |
No. of Firms | 4 | 4 | 3 | 8 | 11 |
According to the Superintendence’s insolvency module, 30 firms from the sample entered reorganization proceedings during the study period, which confirms that a considerable number of firms were facing financial distress. However, the discrepancy between the number of firms flagged by the Zavgren model as financially vulnerable and those formally undergoing reorganization raises questions about the model’s suitability or the precision of its variables in predicting insolvency.
To assess the relevance of the Zavgren model’s variables, firms were classified into two categories: those that underwent reorganization were assigned a value of 1, and those without financial difficulties were assigned a value of 0. This classification allowed for an evaluation of the variables’ predictive ability regarding insolvency in the Colombian construction industry.
2018 Logistic Regression Model
The low 𝜒2 value in the 2018 model indicates that its predictive performance does not significantly differ from that of a model without independent variables. This suggests that the variables included in the model do not exhibit a strong collective relationship with the probability of insolvency in the construction industry during the year under analysis. Th R2 value indicates that the model explains only 15.4 % of the variability in insolvency outcomes (see Table 7). This means that other important factors not accounted for in the model contribute to explaining financial insolvency in these firms.
Tabla 7. Resultado modelo de regresión logístico de probabilidad de insolvencia sector constructor de Colombia (2018)
Logistic Regression | No. of Obs. = | 734 |
||||
LR chi2(7)= | 7.65 |
|||||
Prob > chi2 = | 0.3643 |
|||||
Log-likelihood = | -21.011884 | Pseudo R2= | 0.154 |
|||
R2018 | Coefficient | SE | z | P > z | [95 % CI] |
|
X1 | 0.00019 | 0.00018 | 1.07 | 0.283 | -0.00016 | 0.00053 |
X2 | -0.00151 | 0.00555 | -0.27 | 0.786 | -0.01240 | 0.00937 |
X3 | -0.00303 | 0.04207 | -0.07 | 0.943 | -0.08548 | 0.07943 |
X4 | -18.54721 | 14.07057 | -1.32 | 0.187 | -46.12501 | 9.03059 |
X5 | -0.02494 | 0.24289 | -0.10 | 0.918 | -0.50099 | 0.45110 |
X6 | 1.27280 | 1.08958 | 1.17 | 0.243 | -0.86274 | 3.40835 |
X7 | -0.00183 | 0.00608 | -0.30 | 0.763 | -0.01375 | 0.01008 |
_cons | -4.41143 | 0.88659 | -4.98 | 0.000 | -6.14911 | -2.67375 |
| Note: 128 prediction errors and 0 correct classifications. | ||||||
An examination of the coefficients and their respective significance levels revealed that none of the variables reach conventional levels of statistical significance (p < 0.05). This means that, individually, these variables do not offer a reliable basis for predicting financial insolvency among Colombian construction firms in 2018. The coefficients for X2, X3, X4, X5, and X7 are negative, while X1 and X6 are positive. The magnitude of some coefficients—particularly that of X4 (−18.54721)—suggests that changes in these variables could have substantial effects on the probability of insolvency, although such effects are not statistically significant in this model (see Table 8).
Tabla 8. Cambios marginales en las variables explicativas probabilidad de insolvencia (2018)
Delta Method |
||||||
dy/dx | SE | z | P > |z| | [95 % CI] |
||
X1 | 0.00000 | 0.00000 | 0.96 | 0.339 | 0.00000 | 0.00000 |
X2 | -0.00001 | 0.00003 | -0.27 | 0.787 | -0.00007 | 0.00005 |
X3 | -0.00002 | 0.00022 | -0.07 | 0.943 | -0.00046 | 0.00042 |
X4 | -0.09908 | 0.08871 | -1.12 | 0.264 | -0.27294 | 0.07479 |
X5 | -0.00013 | 0.00130 | -0.10 | 0.918 | -0.00268 | 0.00241 |
X6 | 0.00680 | 0.00660 | 1.03 | 0.303 | -0.00614 | 0.01974 |
X7 | -0.00001 | 0.00003 | -0.30 | 0.765 | -0.00007 | 0.00005 |
Changes in the probability of insolvency associated with variables X1 through X7 are not statistically significant, underscoring their limited predictive power. The slight increase linked to X1 (0.00000101) and the relatively greater increase linked to X6 (0.0067991) both lack statistical significance (p = 0.339 and p = 0.303, respectively), suggesting that these variables are not reliable predictors of insolvency.
Similarly, the marginal decreases in the probability of insolvency associated with increases in X2, X3, X4, X5, and X7 reflect a trend toward reduced financial risk as these variables rise. However, these effects are also statistically insignificant (p = 0.787, 0.943, 0.264, 0.918, and 0.765, respectively). These findings call into question the relevance and effectiveness of the variables employed in the Zavgren model as reliable indicators of financial distress.
The confusion matrix for the 2018 model reveals a complete absence of both true positives and false positives, indicating that the model failed to correctly identify any insolvent firms (see Table 9). This lack of sensitivity suggests that the model is ineffective for detecting cases of financial insolvency—a major limitation when the objective is to flag financially distressed firms. Although the model exhibits 100 % specificity, correctly classifying financially sound firms, this result should be interpreted with caution. The absence of true positives may reflect either an actual lack of insolvent firms in the sample or a flaw in the model’s ability to distinguish between solvent and insolvent firms.
Tabla 9. Matriz de confusión (2018)
Classification | D | ~D | Total | |
+ | 0 | 0 | 0 | |
- | 4 | 730 | 734 | |
Total | 4 | 730 | 734 | |
Classification + Prediction if probability of (D) > = .5 | ||||
True D is defined as R2018! = 0 | ||||
Sensitivity | Pr( +| D) | 0.00 % |
||
Specificity | Pr( -|~D) | 100.00 % |
||
Positive predictive value | Pr( D| +) | .% |
||
Negative predictive value | Pr(~D| -) | 99.46 % |
||
False + True positive rate ~D | Pr( +|~D) | 0.00 % |
||
False - True positive rate D | Pr( -| D) | 100.00 % |
||
False + Classification rate + | Pr(~D| +) | .% |
||
False - Classification rate - | Pr( D| -) | 0.54 % |
||
Correctly classified | 99.46 % |
|||
Furthermore, the high negative predictive value (99.46 %) indicates that when the model predicts financial soundness, it is generally correct. However, the positive predictive value is not applicable in this case due to the complete absence of both true positives and false positives. In contrast, the high false negative rate suggests that the model tends to misclassify insolvent firms as solvent. Although the overall classification accuracy of 99.46 % may appear satisfactory, it is overshadowed by the model’s inability to identify firms at risk of insolvency—an essential function in financial distress analysis.
2019 Logistic Regression Model
The 𝜒2 value for the 2019 model remains low, indicating that this model does not significantly enhance the prediction of financial insolvency compared to a null model (see Table 10). The R2 value is slightly lower than that of the previous year, reinforcing the notion that other variables not included in the model may be relevant in explaining insolvency outcomes.
Tabla 10. Resultado modelo de regresión logístico de probabilidad de insolvencia sector constructor de Colombia (2019)
Logistic Regression | No. of Obs. = | 734 |
||||
LR chi2(7)= | 6.86 |
|||||
Prob > chi2 = | 0.4435 |
|||||
Log-likelihood = | -21.407449 | Pseudo R2= | 0.1381 |
|||
R2019 | Coefficient | SE | z | P > z | [95 % CI] |
|
X1 | 0.00147 | 0.14500 | 0.01 | 0.992 | -0.28272 | 0.28566 |
X2 | -0.00130 | 0.00475 | -0.27 | 0.784 | -0.01060 | 0.00800 |
X3 | -0.00130 | 0.00550 | -0.24 | 0.813 | -0.01207 | 0.00947 |
X4 | -0.14234 | 0.26416 | -0.54 | 0.590 | -0.66008 | 0.37539 |
X5 | 2.80965 | 1.50147 | 1.87 | 0.061 | -0.13316 | 5.75247 |
X6 | 4.36053 | 1.73652 | 2.51 | 0.012 | 0.95701 | 7.76404 |
X7 | 0.00328 | 0.00456 | 0.72 | 0.472 | -0.00567 | 0.01222 |
_cons | -7.96657 | 1.54922 | -5.14 | 0.000 | -11.00298 | -4.93016 |
| Note: 2 prediction errors and 0 correct classifications. | ||||||
Variables X5 and X6 exhibit significance levels of 0.061 and 0.012, respectively. X6, in particular, emerges as statistically significant (p < 0.05), suggesting a potential relationship with financial insolvency. Variable X5 also approaches the conventional significance threshold, pointing to a potentially relevant influence. In contrast, variables X1, X2, X3, X4, and X7 do not reach statistical significance, as was also the case in the 2018 model. This implies that, individually, they are not reliable predictors of insolvency. While the 2019 model shows a modest improvement in the statistical relevance of some variables, it continues to exhibit limited overall predictive power for firms in the Colombian construction industry.
In 2019, X6 is the only variable approaching conventional statistical significance (p = 0.097), indicating that increases in X6 are marginally associated with a higher probability of insolvency, although the relationship is weakly significant (see Table 11). The remaining variables (X1 through X5 and X7) exhibit marginal changes in the probability of insolvency, but their high p-values (ranging from 0.496 to 0.992) indicate that none of these associations are statistically significant. Notably, variable X5 shows a positive marginal effect (0.0148436), implying a slight increase in the probability of insolvency as this variable rises. However, its significance remains limited (p = 0.156).
Tabla 11. Cambios marginales en las variables explicativas probabilidad de insolvencia sector constructor de Colombia (2019)
Delta Method |
||||||
dy/dx | SE | z | P > |z| | [95 % CI] |
||
X1 | 0.00001 | 0.00077 | 0.01 | 0.992 | -0.00149 | 0.00151 |
X2 | -0.00001 | 0.00003 | -0.27 | 0.786 | -0.00006 | 0.00004 |
X3 | -0.00001 | 0.00003 | -0.24 | 0.814 | -0.00006 | 0.00005 |
X4 | -0.00075 | 0.00144 | -0.52 | 0.600 | -0.00357 | 0.00206 |
X5 | 0.01484 | 0.01046 | 1.42 | 0.156 | -0.00565 | 0.03534 |
X6 | 0.02304 | 0.01389 | 1.66 | 0.097 | -0.00418 | 0.05025 |
X7 | 0.00002 | 0.00003 | 0.68 | 0.496 | -0.00003 | 0.00007 |
Compared to the 2018 model, which did not identify any significant variables, the 2019 model shows a slight improvement in detecting potentially relevant predictors. Nonetheless, the general absence of statistical significance across most variables in both years suggests that the Zavgren model’s variable set may not adequately capture the key determinants of financial distress within the Colombian construction industry.
The overall predictive performance of the 2019 model mirrors that of 2018. As with the previous year, the model failed to identify any true positives or false positives, resulting in 0% sensitivity and 100% specificity (see Table 12). This consistent inability to detect insolvent firms (true positives) in both years means that the model is ineffective in identifying financial distress, despite its strong performance in classifying financially sound firms.
Tabla 12. Matriz de confusión (2019)
Logistic Model for R2019 | ||||
Classification | D | ~D | Total | |
+ | 0 | 0 | 0 | |
- | 4 | 730 | 734 | |
Total | 4 | 730 | 734 | |
Classification + Prediction if probability of (D) > = .5 | ||||
True D is defined as R2019! =0 | ||||
Sensitivity | Pr( +| D) | 0.00 % |
||
Specificity | Pr( -|~D) | 100.00 % |
||
Positive predictive value | Pr( D| +) | .% |
||
Negative predictive value | Pr(~D| -) | 99.46 % |
||
False + True positive rate ~D | Pr( +|~D) | 0.00 % |
||
False - True positive rate D | Pr( -| D) | 100.00 % |
||
False + Classification rate + | Pr(~D| +) | . % |
||
False - Classification rate - | Pr( D| -) | 0.54 % |
||
Correctly classified | 99.46 % |
|||
The model’s negative predictive value remains high (99.46%), indicating a strong likelihood that firms classified as solvent are indeed financially sound. However, the absence of true positives and the presence of false negatives (4 in both years) point to a critical limitation in the model’s capacity to detect actual cases of insolvency.
2020 Logistic Regression Model
As in the models estimated for previous years, the 𝜒2 value for 2020 is low, suggesting that the model does not significantly improve the prediction of financial insolvency compared to a null model (see Table 13). However, the R2 value of 0.3101 represents an increase relative to earlier years, indicating an improvement in the model’s capacity to explain variability in insolvency outcomes. Despite this increase, the R2 remains at a modest level, which underscores the continued influence of factors not included in the model.
Tabla 13. Resultado modelo de regresión logístico de probabilidad de insolvencia sector constructor de Colombia (2020)
Logistic Regression | No. of Obs. = | 734 |
||||
LR chi2(7)= | 12.09 |
|||||
Prob > chi2 = | 0.0977 |
|||||
Log-likelihood = | -13.449024 | Pseudo R2 = | 0.3101 |
|||
R2020 | Coefficient | SE | Z | P > z | [95 % CI] |
|
X1 | -0.02471 | 0.17488 | -0.14 | 0.888 | -0.36746 | 0.31805 |
X2 | -0.00005 | 0.00523 | -0.01 | 0.993 | -0.01029 | 0.01020 |
X3 | 0.00759 | 0.01661 | 0.46 | 0.648 | -0.02496 | 0.04015 |
X4 | -0.67811 | 1.67486 | -0.40 | 0.686 | -3.96078 | 2.60456 |
X5 | 0.09553 | 0.17512 | 0.55 | 0.585 | -0.24770 | 0.43876 |
X6 | -0.00192 | 0.02125 | -0.09 | 0.928 | -0.04358 | 0.03974 |
X7 | -0.00739 | 0.00432 | -1.71 | 0.088 | -0.01586 | 0.00109 |
_cons | -5.52303 | 0.85975 | -6.42 | 0.000 | -7.20812 | -3.83795 |
| Note: 23 prediction errors and 0 correct classifications. | ||||||
Consistent with previous years, none of the variables included in the 2020 model achieve conventional significance levels, reinforcing the conclusion that these variables are not individually reliable predictors of insolvency for construction firms during this period. Unlike in 2019, where X6 showed marginal significance, all variables in 2020 display high p-values, indicating no statistically significant association with financial insolvency.
The lack of consistency in the statistical significance of variables across years may imply that the risk factors for financial insolvency are variable or that industry-specific market conditions shift from year to year. While the increased pseudo R2 in 2020 points to enhanced explanatory power, this gain remains modest. Overall, the 2020 results extend the trend observed in 2018 and 2019, where none of the variables exhibit a statistically significant influence on the probability of insolvency (see Table 14).
Tabla 14. Cambios marginales en las variables explicativas probabilidad de insolvencia sector constructor de Colombia (2020)
Delta Method |
||||||
dy/dx | SE | z | P > |z| | [95 % CI] |
||
X1 | -0.00007 | 0.00049 | -0.14 | 0.888 | -0.00103 | 0.00089 |
X2 | 0.00000 | 0.00001 | -0.01 | 0.993 | -0.00003 | 0.00003 |
X3 | 0.00002 | 0.00005 | 0.45 | 0.656 | -0.00007 | 0.00011 |
X4 | -0.00189 | 0.00483 | -0.39 | 0.696 | -0.01135 | 0.00758 |
X5 | 0.00027 | 0.00052 | 0.51 | 0.609 | -0.00075 | 0.00128 |
X6 | -0.00001 | 0.00006 | -0.09 | 0.928 | -0.00012 | 0.00011 |
X7 | -0.00002 | 0.00002 | -1.24 | 0.217 | -0.00005 | 0.00001 |
In 2020, the marginal effects indicate that small fluctuations in these variables have minimal impact. Specifically, small decreases in the probability of insolvency are associated with increases in X1, X2, X4, X6, and X7 (with marginal effects of -0.0000687, -0.000000132, -0.0018857, -0.00000534, and -0.0000205, respectively). Moreover, slight increases are observed for X3 and X5 (0.0000211 and 0.0002656, respectively). Nonetheless, the high p-values, ranging from 0.217 to 0.993, suggest that these changes are not statistically significant. When compared with the results from 2018 and 2019, the 2020 model reflects the consistent lack of statistical significance across variables over the three-year period.
The confusion matrix analysis for the 2020 model reveals an improvement in predictive performance relative to previous years. Unlike the 2018 and 2019 models, which failed to correctly identify any insolvent firms, the 2020 model successfully classified one true positive (i.e., one insolvent firm). This result yields a sensitivity of 33.33%, representing a notable enhancement in the model’s ability to detect financial insolvency (see Table 15).
Tabla 15. Confusion matrix (2020)
Logistic Model for R2020 | ||||
Classification | D | ~D | Total | |
+ | 1 | 0 | 1 | |
- | 2 | 731 | 733 | |
Total | 3 | 731 | 734 | |
Classification + Prediction if probability of (D) > = .5 | ||||
True D is defined as R2020! = 0 | ||||
Sensitivity | Pr( +| D) | 33.33 % |
||
Specificity | Pr( -|~D) | 100.00 % |
||
Positive predictive value | Pr( D| +) | 100.00 % |
||
Negative predictive value | Pr(~D| -) | 99.73 % |
||
False + True positive rate ~D | Pr( +|~D) | 0.00 % |
||
False - True positive rate D | Pr( -| D) | 66.67 % |
||
False + Classification rate + | Pr(~D| +) | 0.00 % |
||
False - Classification rate - | Pr( D| -) | 0.27 % |
||
Correctly classified | 99.73 % |
|||
Although the number of insolvent firms in the sample is small, the model’s ability to avoid false positives and to maintain 100% specificity—correctly classifying all solvent firms—is noteworthy. The resulting positive predictive value of 100% and negative predictive value of 99.73%, along with an overall classification accuracy of 99.73%, reinforce the model’s ability to predict financial soundness. However, the false negative rate of 66.67% indicates that the model continues to misclassify some insolvent firms as solvent, although this rate has decreased compared to the previous two years. This progress in identifying insolvent firms in 2020—though still limited—constitutes a step forward compared to 2018 and 2019, when the model failed to detect any true positives.
2021 Logistic Regression Model
In the 2021 model, the value of 𝜒2 increased compared to previous years but remains low, indicating that the model does not significantly improve the prediction of insolvency relative to a null model (see Table 16). However, the pseudo R2 value of 0.0446 is the lowest among the models estimated for 2018 to 2021, suggesting that the 2021 model has the weakest explanatory power in accounting for variability in insolvency outcomes.
Tabla 16. Resultado modelo de regresión logístico de probabilidad de insolvencia sector constructor de Colombia (2021)
Logistic Regression | No. of Obs. = | 734 |
||||
LR chi2(7)= | 3.93 |
|||||
Prob > chi2 = | 0.7874 |
|||||
Log-likelihood = | -42.14222 | Pseudo R2 = | 0.0446 |
|||
R2021 | Coefficient | SE | Z | P>z | [95 % CI] |
|
X1 | -0.00006 | 0.00128 | -0.04 | 0.965 | -0.00256 | 0.00245 |
X2 | 0.00003 | 0.00031 | 0.10 | 0.918 | -0.00058 | 0.00064 |
X3 | -0.00455 | 0.01857 | -0.24 | 0.807 | -0.04095 | 0.03186 |
X4 | -0.67097 | 0.89085 | -0.75 | 0.451 | -2.41700 | 1.07506 |
X5 | 0.46373 | 0.34852 | 1.33 | 0.183 | -0.21936 | 1.14682 |
X6 | 1.03636 | 0.60811 | 1.70 | 0.088 | -0.15551 | 2.22824 |
X7 | -0.00020 | 0.00302 | -0.06 | 0.948 | -0.00611 | 0.00571 |
_cons | -4.73571 | 0.57213 | -8.28 | 0.000 | -5.85705 | -3.61436 |
| Note: 10 prediction errors and 0 correct classifications. | ||||||
As in previous years, none of the variables reach conventional levels of statistical significance, confirming that, individually, they are not reliable predictors of insolvency for construction firms in 2021. Variable X6 exhibits a p-value of 0.088—the closest to statistical significance among all variables—but still falls short of the standard threshold. The variation in statistical significance observed across years suggests that either the relevant risk factors for insolvency change over time or the model fails to adequately capture them. Overall, the 2021 results continue the trend established in 2018–2020, in which variables X1 through X7 do not exert a statistically significant influence on the probability of insolvency (see Table 17).
Tabla 17. Cambios marginales en las variables explicativas probabilidad de insolvencia sector constructor de Colombia (2021)
Delta Method |
||||||
dy/dx | SE | z | P > |z| | [95 % CI] |
||
X1 | 0.00000 | 0.00001 | -0.04 | 0.965 | -0.00003 | 0.00003 |
X2 | 0.00000 | 0.00000 | 0.10 | 0.918 | -0.00001 | 0.00001 |
X3 | -0.00005 | 0.00020 | -0.24 | 0.807 | -0.00044 | 0.00034 |
X4 | -0.00715 | 0.00979 | -0.73 | 0.465 | -0.02633 | 0.01204 |
X5 | 0.00494 | 0.00397 | 1.24 | 0.214 | -0.00285 | 0.01273 |
X6 | 0.01104 | 0.00725 | 1.52 | 0.128 | -0.00316 | 0.02524 |
X7 | 0,00000 | 0.00003 | -0.06 | 0.948 | -0.00007 | 0.00006 |
The marginal effects for 2021 indicate that, although there are variations in the probability of insolvency associated with each variable, these are not sufficiently robust to be considered predictive. Specifically, marginal decreases are linked to increases in X1, X3, X4, and X7 (-0.0000006, -0.0000484, -0.0071462, and -0.00000208, respectively), while increases are linked to X2, X5, and X6 (0.000000342, 0.004939, and 0.0110379, respectively). These variations suggest possible trends, but their significance levels (P = 0.965, 0.807, 0.465, 0.214, 0.128, and 0.948) reveal limited statistical robustness. These results are consistent with earlier models, both in terms of the lack of statistical significance and the small magnitude of marginal effects.
The confusion matrix for 2021 mirrors the patterns observed in 2018 and 2019, confirming the model’s limited ability to identify insolvent firms (see Table 18).
Tabla 18. Matriz de confusión (2021)
Logistic Model for R2021 | ||||
Classification | D | ~D | Total | |
+ | 0 | 0 | 0 | |
- | 8 | 726 | 734 | |
Total | 8 | 726 | 734 | |
Classification + Prediction if probability of (D) > = .5 | ||||
True D is defined as R2021! = 0 | ||||
Sensitivity | Pr( +| D) | 0.00 % |
||
Specificity | Pr( -|~D) | 100.00 % |
||
Positive predictive value | Pr( D| +) | . % |
||
Negative predictive value | Pr(~D| -) | 98.91 % |
||
False + True positive rate ~D | Pr( +|~D) | 0.00 % |
||
False - True positive rate D | Pr( -| D) | 100.00 % |
||
False + Classification rate + | Pr(~D| +) | . % |
||
False - Classification rate - | Pr( D| -) | 1.09 % |
||
Correctly classified | 98.91 % |
|||
Unlike the 2020 model, which identified one true positive, the 2021 model detected none, yielding 0% sensitivity. This inability to detect insolvency, combined with the absence of false positives and 100% specificity, indicates that the model is highly effective at classifying solvent firms but fails to identify those at risk. In addition, the number of false negatives increased to eight, reflecting a decline in the model’s accuracy, as demonstrated by a negative predictive value of 98.91% and an overall correct classification rate of 98.91%. This decline in predictive performance relative to 2020 suggests inconsistency in the model’s effectiveness across years.
2022 Logistic Regression Model
In the 2022 model, 𝜒2 remains low, confirming that the model does not improve the prediction of insolvency compared to a null model (see Table 19). Moreover, the pseudo R2 value of 0.0446 is the lowest across all years analyzed, implying that this model has the weakest explanatory power for variability in financial insolvency probability.
Tabla Tabla 19. Resultado modelo de regresión logístico de probabilidad de insolvencia sector constructor de Colombia (2022)
Logistic Regression | No. of Obs. = | 734 |
||||
LR chi2(7)= | 3.64 |
|||||
Prob > chi2 = | 0.8204 |
|||||
Log-likelihood = | -55.304866 | Pseudo R2 = | 0.0318 |
|||
R2022 | Coefficient | SE | Z | P > z | [95 % CI] |
|
X1 | -0.02958 | 0.07356 | -0.40 | 0.688 | -0.17376 | 0.11459 |
X2 | -0.00075 | 0.00278 | -0.27 | 0.786 | -0.00620 | 0.00469 |
X3 | -0.00077 | 0.00517 | -0.15 | 0.881 | -0.01090 | 0.00935 |
X4 | -0.43073 | 0.66336 | -0.65 | 0.516 | -1.73090 | 0.86943 |
X5 | 1.24743 | 0.79246 | 1.57 | 0.115 | -0.30576 | 2.80063 |
X6 | 0.38777 | 0.80004 | 0.48 | 0.628 | -1.18029 | 1.95583 |
X7 | 0.00016 | 0.00045 | 0.35 | 0.730 | -0.00073 | 0.00104 |
_cons | -4.30007 | 0.51826 | -8.30 | 0.000 | -5.31584 | -3.28431 |
| Note: 7 prediction errors and 0 correct classifications. | ||||||
None of the variables reach conventional levels of statistical significance, indicating that, individually, they do not effectively predict insolvency in Colombian construction firms for 2022. Variable X5, with a p-value of 0.115, is the closest to the threshold, though it remains statistically insignificant. These results are consistent with previous years and reinforce the overall trend of limited predictive capacity, with the 2022 model exhibiting the weakest performance.
As in earlier models, the lack of consistent statistical significance among variables highlights either the dynamic nature of risk factors over time or the model’s inability to capture key determinants of insolvency. Moreover, the continued decline in pseudo R2 values across the five-year period suggests a diminishing capacity of the model to explain financial insolvency in the construction industry.
The marginal effects estimated for 2022 again reveal a lack of statistical significance of variables X1 through X7 (see Table 20). The trend is similar to that observed in earlier years, with minor changes in the probability of insolvency that do not reach statistical significance: decreases associated with increases in X1, X3, X4, and X7 (-0.0000006, -0.0000484, -0.0071462, and -0.00000208, respectively) and slight increases with X2, X5, and X6 (0.000000342, 0.004939, and 0.0110379). The p-values related to these estimates (0.965, 0.918, 0.807, 0.465, 0.214, 0.128, and 0.948) confirm a lack of statistical robustness in the relationship between these variables and financial insolvency.
Tabla 20. Cambios marginales en las variables explicativas probabilidad de insolvencia sector constructor de Colombia (2022)
Delta Method |
||||||
dy/dx | SE | z | P > |z| | [95 % CI] |
||
X1 | -0.00043 | 0.00108 | -0.40 | 0.689 | -0.00256 | 0.00169 |
X2 | -0.00001 | 0.00004 | -0.27 | 0.787 | -0.00009 | 0.00007 |
X3 | -0.00001 | 0.00008 | -0.15 | 0.881 | -0.00016 | 0.00014 |
X4 | -0.00631 | 0.00988 | -0.64 | 0.523 | -0.02567 | 0.01305 |
X5 | 0.01827 | 0.01252 | 1.46 | 0.144 | -0.00627 | 0.04280 |
X6 | 0.00568 | 0.01182 | 0.48 | 0.631 | -0.01748 | 0.02884 |
X7 | 0.00000 | 0.00001 | 0.34 | 0.731 | -0.00001 | 0.00002 |
Over the five-year period from 2018 to 2022, the analysis of marginal effects consistently reveals that none of the variables serve as statistically significant predictors of insolvency. Despite small year-over-year fluctuations, none of the observed effects reach significance, calling into question the ability of the variables employed in the Zavgren model to capture the true determinants of financial distress in the construction industry.
The confusion matrix for 2022 continues to reflect the model’s limitations in predictive performance (see Table 21). As in previous years, the 2022 model fails to identify any true positives, resulting in 0% sensitivity. While specificity remains at 100% due to the absence of false positives, indicating accurate classification of financially sound firms, the model does not detect any firms at risk of insolvency.
Tabla 21. Confusion matrix (2022)
Logistic Model for R2022 | ||||
Classification | D | ~D | Total | |
+ | 0 | 0 | 0 | |
- | 11 | 723 | 734 | |
Total | 11 | 723 | 734 | |
Classification + Prediction if probability of (D) > = .5 | ||||
True D is defined as R2022! = 0 | ||||
Sensitivity | Pr( +| D) | 0.00 % |
||
Specificity | Pr( -|~D) | 100.00 % |
||
Positive predictive value | Pr( D| +) | . % |
||
Negative predictive value | Pr(~D| -) | 98.50 % |
||
False + True positive rate ~D | Pr( +|~D) | 0.00 % |
||
False - True positive rate D | Pr( -| D) | 100.00 % |
||
False + Classification rate + | Pr(~D| +) | . % |
||
False - Classification rate - | Pr( D| -) | 1.50 % |
||
Correctly classified | 98.50 % |
|||
The model’s negative predictive value of 98.50% suggests that firms predicted to be solvent are indeed likely to be financially sound. However, the growing number of false negatives (11 in 2022 compared to 4 in 2018, 2 in 2020, and 8 in 2021) signals a decline in the model’s accuracy. The persistence of these issues over the years indicates that, while the model may reliably identify financial soundness, its practical usefulness is limited by its inability to detect key insolvency risks—an essential aspect for its application in financial analysis.
5. DISCUSSION
The results obtained from applying the Zavgren model to the Colombian construction industry between 2018 and 2022 reveal that a high proportion of firms—approximately 80% annually, except in 2020—were at risk of insolvency. This pattern is consistent with findings from previous studies, such as that by
These findings underscore the importance of complementing the Zavgren model with additional tools for monitoring financial health, particularly in industries highly exposed to external risks. This recommendation aligns with that of
Similarly, the model’s low sensitivity in detecting financially distressed firms in the Colombian construction industry represents a significant shortcoming. This issue is consistent with the findings of
This study provides an empirical assessment of the Zavgren model in a key economic sector in Colombia, offering insights into both its strengths and limitations. In comparison to studies by
Unlike studies in other sectors—such as retail (
Based on these findings, future lines of research should aim to deepen the understanding of financial insolvency through comparative and integrative approaches. In the first place, recalibrating the Zavgren model to fit the Colombian context—through the adjustment of coefficients based on industry-specific characteristics—could enhance its predictive accuracy. Additionally, comparative intersectoral studies could be conducted to evaluate the model’s performance across economic sectors with diverse capital structures, leverage ratios, and risk exposure levels.
A second line of research should explore the integration of macroeconomic indicators into prediction models to account for the potential impact of exogenous variables on organizations’ financial stability. Moreover, incorporating non-financial variables into bankruptcy risk analysis could offer a more comprehensive perspective on the phenomenon of financial insolvency.
As a third line of research, the implementation of hybrid models—combining the multivariate approach of the Altman Z-score with the logistic regression technique of the Zavgren model—could offer improved accuracy. It would also be valuable to compare the performance of classical models with alternative approaches based on artificial intelligence and machine learning within the Colombian context. Such comparisons could help assess the adaptability and predictive power of these techniques in emerging markets characterized by high uncertainty and volatility.
6. CONCLUSIONS
The COVID-19 pandemic exposed the Colombian construction industry’s high vulnerability to exogenous shocks, resulting in increased operational costs, reduced productivity, and adverse effects on projects of significant social value. In this context, implementing financial strategies that reduce insolvency risk and promote the financial stability of firms is essential. Predictive models of financial insolvency play a critical role in supporting business continuity, as they facilitate the early identification of financial distress and enable the adoption of preventive measures to reinforce organizational financial health.
Given the construction sector’s deep interdependence on other areas of the economy, firms in this industry must adopt an integrated and proactive approach to financial management. This includes effective working capital management, the strategic use of financial leverage, and the design of an optimal capital structure to reduce insolvency risk. The combined exposure to endogenous and exogenous factors demands flexible and adaptive financial strategies capable of responding to dynamic market conditions. As such, the use of predictive tools becomes indispensable for ensuring the long-term sustainability of firms operating in volatile environments.
Throughout the 2018–2022 period, the Zavgren model demonstrated limited predictive capacity when applied to the Colombian construction industry. Low χ² values consistently indicated no significant improvement in predicting insolvency compared to a null model. The findings suggest that the financial variables incorporated in the model do not adequately capture the key determinants of insolvency in this sector. Moreover, the lack of statistically significant results (p < 0.05) for most variables indicates inconsistencies in their individual contributions to predicting insolvency, reinforcing the need to revise or supplement the model with additional financial indicators.
The model’s performance, as reflected in the confusion matrix analysis, was characterized by low sensitivity and limited ability to identify true positives during the study period. Although it consistently achieved high specificity, its failure to detect financially distressed firms, especially in 2021 and 2022, raises concerns about its practical applicability. This limitation is exacerbated by the model’s reliance on true negatives for accurate classification. In addition, the marginal effects analysis further confirms the limited explanatory power of the variables used, as changes in the predicted probability of insolvency were consistently statistically insignificant. These findings point to the need to include additional explanatory factors and highlight the importance of reviewing or expanding the model’s structure to enhance its predictive power.
The results demonstrate that the Zavgren model serves as an early warning tool, albeit with limitations in capturing structural factors specific to the Colombian context. This limitation is largely due to its reliance solely on financial variables, without considering macroeconomic or industry-specific structural factors. Consequently, there is a clear need to design hybrid models that integrate firms’ financial indicators with macroeconomic variables such as inflation, interest rates, business cycles, and GDP performance. Such integration would enhance the model’s predictive and explanatory capacity, particularly in emerging economies where firms are more vulnerable to external shocks.
This study offers both theoretical and practical contributions. From a theoretical perspective, it demonstrates the inadequacy of the Zavgren model’s financial variables to explain insolvency risk in the Colombian construction sector, highlighting the importance of developing or adapting models that account for sectoral specificities and exogenous influences. From a practical standpoint, the findings emphasize the need for managers, shareholders, investors, and policymakers to reassess their approaches to insolvency risk management. Likewise, it is essential to implement more comprehensive analytical tools that incorporate financial, operational, and legal dimensions. Doing so would strengthen firms’ resilience to economic adversity and support the development of more robust insolvency prediction models, ultimately fostering sound financial practices that contribute to the country’s economic and social progress.
CONFLICTS OF INTEREST
The authors declare that they have no financial, professional, or personal conflicts of interest that could have inappropriately influenced the results or interpretations presented in this study.
AUTHOR CONTRIBUTIONS
All authors contributed substantially to the development of this research, as outlined below:
Andrés Caicedo Carrero: Conceptualization and design of the study; data collection, analysis, and interpretation; drafting of the manuscript.
Daniel Isaac Roque: Conceptualization and design of the study; data collection, analysis, and interpretation; drafting of the manuscript.
REFERENCES
- arrow_upward Alaka, H. A., Oyedele, L. M., Owolabi, H. A., Kumar, V., Ajayi, S. O., Akinade, O. O., & Bilal, M. (2018). Systematic review of bankruptcy prediction models: Towards a framework for tool selection. Expert Systems with Application, 94, 164-184. https://doi.org/10.1016/j.eswa.2017.10.040
- arrow_upward Andriani, S. F., Rahardja, L., Efriadi, A. R., & Cindi, R. J. (2023). Comparative Analysis of Financial Distress Models in Indonesian Multi-Industrial Manufacturing During COVID-19. International Journal of Digital Entrepreneurship and Business, 4(2), 108-118. https://doi.org/10.52238/ideb.v4i2.130
- arrow_upward Anton, C. E., Baba, C. M., & Bucșoiu, O. A. (2025). Perspectives on Integrating Risk Management and Sustainability for Financial Performance: A Systematic Literature Review. Sustainability, 17(8), 3456. https://doi.org/10.3390/su17083456
- arrow_upward Aziz, A., Emanuel, D. C., & Lawson, G. H. (1988). Bankruptcy prediction—An investigation of cash flow based models. Journal of Management Studies, 25(5), 419-437. https://doi.org/10.1111/j.1467-6486.1988.tb00708.x
- arrow_upward Balina, R., Idasz-Balina, M., & Azam Achsani, N. (2021). Predicting Insolvency of the Construction Companies in the Creditworthiness Assessment Process—Empirical Evidence from Poland. Journal of Risk and Financial Management, 14(10), 453. https://doi.org/10.3390/jrfm14100453
- arrow_upward Beade, Á., Rodríguez, M., & Santos, J. (2024). Multiperiod bankruptcy prediction models with interpretable single models. Computational Economics, 64(3), 1357-1390. https://doi.org/10.1007/s10614-023-10479-z
- arrow_upward Bermeo Chiriboga, D. C., & Armijos Cordero, J. C. (2021). Predicción de quiebra bajo el modelo Z2 Altman en empresas de construcción de edificios residenciales de la provincia del Azuay. Revista Economía y Política, (33), 48-63. https://doi.org/10.25097/rep.n33.2021.03
- arrow_upward Bohórquez Alfonso, G. N. (2019). Modelo de predictibilidad de quiebra para las empresas colombianas del subsector de servicios profesionales [tesis de maestría, Colegio de Estudios Superiores de Administración]. Repositorio CESA. http://hdl.handle.net/10726/2192
- arrow_upward Cámara Colombiana de la Construcción. (2022). Tendencias de la Construcción: Economía y coyuntura sectorial. Edición N.° 23. Camacol. https://camacol.co/sites/default/files/descargables/TENDENCIAS%20ED%2023%20-%20JUNIO%2010%20DE%202022-1-DE%20BAJA_compressed.pdf
- arrow_upward Charitou, A., Neophytou, E., & Charalambous, C. (2004). Predicting corporate failure: empirical evidence for the UK. European Accounting Review, 13(3), 465-497. https://doi.org/10.1080/0963818042000216811
- arrow_upward Dankiewicz, R. (2020). Analysis of companies’ bankruptcy in poland as compared with the cost of protection under trade credit insurance. Journal of International Studies, 13(4), 197-212. https://doi.org/10.14254/2071-8330.2020/13-4/14
- arrow_upward Dasilas, A., & Rigani, A. (2024). Machine learning techniques in bankruptcy prediction: A systematic literature review. Expert Systems with Applications, 255(Part C), 124761. https://doi.org/10.1016/j.eswa.2024.124761
- arrow_upward Dukalang, E., Zamzam, I., & Abu, Z. (2024). Analysis of Financial Distress Predictions Using Altman, Zavgren, Fulmer, Ohlson, Taffler, and Ca-Score Models as Early Warning Systems in Manufacturing Companies. Nominal Barometer Riset Akuntansi dan Manajemen, 13(1), 81-97. https://doi.org/10.21831/nominal.v13i1.65081
- arrow_upward Enshassi, A., Al-Hallaq, K., & Mohamed, S. (2006). Causes of contractor's business failure in developing countries: the case of Palestine. Journal of construction in developing countries, 11(2), 1-14. http://web.usm.my/jcdc/vol11_2_2006/1%20Adnan%20(p.1-14).pdf
- arrow_upward Im, H., Minchin, E., Hakim, H., & Zhang, Y. (2018). Monitoring the financial trends of construction firms in Korea, Japan, and the United States by using Bankruptcy Prediction Model. En C. Wang, C. Harper, Y. Lee, R. Harris & C. Berryman (eds.), Construction Research Congress 2018 (pp. 294-304). ASCE. https://ascelibrary.org/doi/10.1061/9780784481271.029
- arrow_upward Indriyanti, N. D., & Gustyana, T. T. (2021). Analysis of bankruptcy prediction using Altman Z-Score, Springate Grover, Zmijewski and Zavgren in retail trade sub sectors registered in Indonesia stock exchange period 2015-2019. International Journal of Advanced Research in Economics and Finance, 3(1), 21-31. https://myjms.mohe.gov.my/index.php/ijaref/article/view/12475
- arrow_upward International Monetary Fund. (2022). Colombia. 2022 Article IV Consultatio-Press Release; Staff Report; and Statement by the Executive Director for Colombia. IMF Country Report No. 22/97, 1-85. https://www.imf.org/-/media/Files/Publications/CR/2022/English/1COLEA2022002.ashx
- arrow_upward Isaac Roque, D., & Caicedo Carrero, A. (2021). Relación entre la creación de valor económico y la insolvencia financiera en empresas no cotizantes en el mercado de valores de Colombia (2016-2019). Semestre Económico, 24(57), 76-97. https://doi.org/10.22395/seec.v24n57a4
- arrow_upward Isaac-Roque, D., & Caicedo-Carrero, A. (2023). Relación entre los indicadores financieros del modelo Altman Z y el puntaje Z. Retos Revista de Ciencias de la Administración y Economía, 13(25), 129-148. https://doi.org/10.17163/ret.n25.2023.09
- arrow_upward Isaac-Roque, D., Caicedo-Carrero, A., & Muñoz-Álvarez, A. N. (2023). Capacidad predictiva del modelo Altman Z-Score en empresas declaradas en reorganización empresarial. Apuntes de Economía y Sociedad, 4(1), 129-141. https://doi.org/10.5377/aes.v4i1.16451
- arrow_upward Janrosl, V. S. E., Prima, A. P., & Yuliadi, Y. (2022). Potensi kebangkrutan menggunakan model Zavgren dan Altman pada perusahaan di Indonesia. Measurement Jurnal Akuntansi, 16(2), 159-165. https://www.journal.unrika.ac.id/index.php/measurement/article/view/4593
- arrow_upward Kanapickiene, R., & Marcinkevicius, R. (2014). Possibilities to apply classical bankruptcy prediction models in the construction sector in Lithuania. Economics and Management, 19(4), 317-332. http://dx.doi.org/10.5755/j01.em.19.4.8095
- arrow_upward Karas, M., & Řežnáková, M. (2012). Financial ratios as bankruptcy predictors: The Czech Republic case. En D. Pavelková, J. Strouhal, y M. Pasekova (eds.), Proceeding of the 1st WSEAS International Conference on Finance, Accounting and Auditing (pp. 56-67). Tomas Bata University in Zlín-Wseas. https://wseas.us/e-library/conferences/2012/Zlin/FAA/FAA-13.pdf
- arrow_upward Keasey, K., & Watson, R. (1987). Non-financial symptoms and the prediction of small company failure: a test of Argenti’s hypotheses. Journal of Business Finance & Accounting, 14(3), 335-354. https://doi.org/10.1111/j.1468-5957.1987.tb00099.x
- arrow_upward Klaudiusz Tomczak, S. (2023). General bankruptcy prediction models for the Visegrád Group. The stability over time. Operations Research and Decisions, 33(4), 171-187. https://doi.org/10.37190/ord230410
- arrow_upward Kliestik, T. (2018). The Application of Mathematical Modeling to Predict the Financial Health of Businesses. Advances in Economics Business and Management Research, 56, 298-302. https://doi.org/10.2991/febm-18.2018.67
- arrow_upward Kristanti, F. T. (2019). Financial Distress: Teori dan Perkembangannya dalam Konteks Indonesia. Intelegensia Media. https://inteligensiamedia.com/product/financial-distress-teori-dan-perkembangannya-dalam-konteks-indonesia/
- arrow_upward Kušter, D., Vuković, B., Milutinovic, S., Peštović, K., Tica, T., & Jakšić, D. (2023). Early Insolvency Prediction as a Key for Sustainable Business Growth. Sustainability, 15(21), 15304. https://doi.org/10.3390/su152115304
- arrow_upward Lin, Y. C., Padliansyah, R., Lu, Y. H., & Liu, W. R. (2025). Bankruptcy prediction: Integration of convolutional neural networks and explainable artificial intelligence techniques. International Journal of Accounting Information Systems, 56, 100744. https://doi.org/10.1016/j.accinf.2025.100744
- arrow_upward Lisnawati, L., Mirnawati, M., Sulaiman, F., & Sari, R. A. (2021). Z-Score and Zavgren Models in Implementing Financial Distress Management in Cigarette Companies. Enrichment: Journal of Management, 12(1), 669-686. https://enrichment.iocspublisher.org/index.php/enrichment/article/view/290
- arrow_upward Mehmood, A., & De Luca, F. (2023). Financial distress prediction in private firms: developing a model for troubled debt restructuring. Journal of Applied Accounting Research, 26(6), 1-18. https://doi.org/10.1108/JAAR-12-2022-0325
- arrow_upward Narvekar, A., & Gua, D. (2021). Bankruptcy prediction using machine learning and an application to the case of the COVID-19 recession. Data Science in Finance and Economics, 1(2), 180-195. https://doi.org/10.3934/DSFE.2021010
- arrow_upward Ohlson, J. A. (1980). Financial ratios and the probabilistic prediction of bankruptcy. Journal of Accounting Research, 18(1), 109-131. https://doi.org/10.2307/2490395
- arrow_upward Peña Ortiz, D. C., García Villarreal, J. A., & Morales Castro, A. (2018). Pronóstico de insolvencia financiera para empresas del sector construcción que cotizan en la bolsa caso: México y Colombia. En M. I. Redondo Ramírez, A. M. Barrera Rodríguez y C. C. Duque Gómez (eds.), Internacionalización de la Investigación en las Ciencias Sociales (pp. 259-277). Universidad Libre de Colombia.
- arrow_upward Platt, H. D., & Platt, M. B. (1990). Development of a class of stable predictive variables: the case of bankruptcy prediction. Journal of Business Finance & Accounting, 17(1), 31-51. https://doi.org/10.1111/j.1468-5957.1990.tb00548.x
- arrow_upward Prusak, B. (2018). Review of research into enterprise bankruptcy prediction in selected central and eastern European countries. International Journal of Financial Studies, 6(3), 60. https://doi.org/10.3390/ijfs6030060
- arrow_upward Radovanovic, J., & Haas, C. (2023). The evaluation of bankruptcy prediction models based on socio-economic costs. Expert Systems with Applications, 227, 120275. https://doi.org/10.1016/j.eswa.2023.120275
- arrow_upward Rivendra, U., Sudjono, S., & Saluy, A. (2021). Financial Distress Prediction: Case Study Plantation Companies Listed on Indonesia Stock Exchange. En S. Suraya, D. Asih, R. Briandana, M. Rohmadi y K. Saddhono (eds.), Proceedings of the 1st MICOSS Mercu Buana International Conference on Social Sciences, MICOSS 2020, September 28-29, 2020, Jakarta, Indonesia. EAI. http://dx.doi.org/10.4108/eai.28-9-2020.2307365
- arrow_upward Rizqon, M., & Yunita, I. (2024). Survival and Transformation: Assessing the Financial Resilience of Indonesian Tourism Companies Pre, During, and Post-COVID-19. International Research Journal of Economics and Management Studies IRJEMS, 3(2), 107-115. https://irjems.org/irjems-v3i2p115.html
- arrow_upward Roque, D. I., & Caicedo Carrero, A. (2022). Detección de insolvencia financiera mediante el modelo Z-Altman en empresas colombianas no cotizantes durante el periodo 2016-2019. Contabilidad y Negocios, 17(33), 167-192. https://doi.org/10.18800/contabilidad.202201.007
- arrow_upward Sarmiento Rojas, J. A., Hernández Carrillo, C. G., & Rueda Varón, M. J. (2022). Factores de permanencia empresarial del sector de la construcción en Colombia. Editorial UPTC.
- arrow_upward Sebastian, B. (2023). A study on the accuracy of bankruptcy models predicting financial distress levels of companies: evidence from Indian stock market [tesis de maestría, Christ Deemed to Be University]. http://dx.doi.org/10.2139/ssrn.4422924
- arrow_upward Sheppard, J. P. (1994). Strategy and bankruptcy: an exploration into organizational death. Journal of Management, 20(4), 795-833. https://doi.org/10.1016/0149-2063(94)90031-0
- arrow_upward Shi, Y., & Li, X. (2019a). A bibliometric study on intelligent techniques of bankruptcy prediction for corporate firms. Heliyon, 5(12), e02997. https://doi.org/10.1016/j.heliyon.2019.e02997
- arrow_upward Shi, Y., & Li, X. (2019b). An overview of bankruptcy prediction models for corporate firms: A systematic literature review. Intangible Capital, 15(2), 114-127. https://doi.org/10.3926/ic.1354
- arrow_upward Stankevičienė, J., & Prazdeckaitė, G. (2021). Analysis of the accuracy of bankruptcy prediction models: the case of Lithuanian companies. Apskaitos ir finansų mokslas ir studijos: problemos ir perspektyvos, 15(1), 44-53. https://doi.org/10.15544/ssaf.2021.05
- arrow_upward Talebnia, G., Karmozi, F., & Rahimi, S. (2016). Evaluating and comparing the ability to predict the bankruptcy prediction models of Zavgren and Springate in companies accepted in the Tehran Stock Exchange. Marketing and Branding Research, 3, 137-143. https://ssrn.com/abstract=3340454
- arrow_upward Urazán-Bonells, C. F., Rondón-Quintana, H. A., & Caicedo-Londoño, M. A. (2024). The Effects of Economic Sector GDP on Low-Income Housing Supply, Colombia’s Regions Case. Buildings, 14(1), 267. https://doi.org/10.3390/buildings14010267
- arrow_upward Vargas Franco, V. (2007). Estadística descriptiva para Ingeniería Ambiental con SPSS. Universidad Nacional de Colombia.
- arrow_upward Vásquez-Serpa, L. J., Rodríguez, C., Pérez-Núñez, J. R., & Navarro, C. (2025). Challenges of Artificial Intelligence for the Prevention and Identification of Bankruptcy Risk in Financial Institutions: A Systematic Review. Journal of Risk and Financial Management, 18(1), 26. https://doi.org/10.3390/jrfm18010026
- arrow_upward Wahyuni, I. A., Laba, A. R., & Rahim, F. R. (2024). Comparative Analysis of Altman Method Measurement, Springate, Zmijewski and Grover in Predicting Financial Distress. Economics and Digital Business Review, 5(2), 674-687. https://ojs.stieamkop.ac.id/index.php/ecotal/article/view/1700/1132
- arrow_upward Wang, J., Li, M., Moorhead, M., & Skitmore, M. (2025). Forecasting financial distress in listed Chinese construction firms: leveraging ensemble learning and non-financial variables. Construction Management and Economics, 43(3), 175-195. http://dx.doi.org/10.1080/01446193.2024.2403553
- arrow_upward Wardayani, W., & Maksum, A. (2020). Analisis Potensi Kebangkrutan: Perbandingan Model Altman dengan Zavgren. PERSPEKTIF, 9(2), 447-452. https://doi.org/10.31289/perspektif.v9i2.3946
- arrow_upward Wassie, F. A., & Lakatos, L. P. (2024). Key audit matters disclosure: do they reveal construction firm’s risk of financial distress? Evidence from Ethiopia. International Journal of Construction Management, 24(15), 1689-1697. https://doi.org/10.1080/15623599.2023.2286882
- arrow_upward Wicaksono, K., Musa, P., Bangun, A. A., Lestari, O. B., Aryunani, W., & Sukmono, S. (2022). Analysis of Financial Annual Reports for Bankruptcy Predictions Using Altman Z-Score Method. Journal of Intelligent Decision Support System (IDSS), 5(2), 44-52. https://doi.org/10.35335/idss.v5i2.79
- arrow_upward Zavgren, C. V. (1985). Assessing the vulnerability to failure of American industrial firms: a logistic analysis. Journal of Business Finance and Accounting, 12(1), 19-45. https://doi.org/10.1111/j.1468-5957.1985.tb00077.x

 Google