Challenges and Opportunities for Integrated Reporting in Latin American SMEs: Insights From Business Practice
Desafíos y oportunidades del reporte integrado en pymes latinoamericanas: perspectivas desde la práctica empresarial
 PDF
Received: May 18, 2025
Accepted: December 23, 2025
Vélez Ramírez, R. A., Marco-Fondevila, M., y Moneva, J. M. (2026). Challenges and Opportunities for Integrated Reporting in Latin American SMEs: Insights From Business Practice. Revista CEA, 12(28), e3493. https://doi.org/10.22430/24223182.3493
Abstract
Objective: To identify the main obstacles and opportunities faced by Latin American SMEs in implementing Integrated Reporting (ir)—a strategic response to current social and environmental challenges that facilitates the disclosure of responsible and sustainable initiatives within the business sector.
Design/Methodology: This mixed-methods study was conducted in six Latin American countries: Argentina, Brazil, Colombia, Ecuador, Mexico, and Peru. Data were collected through a survey administered to 100 business leaders, scholars, and researchers, complemented by a semi-structured interview with 27 highly regarded professionals from across the region.
Findings: The study revealed that ir is not exclusive to global corporations. Latin American smes also engage in sustainable strategies, including financing social projects, paying for green products, and pursuing environmental certifications. However, 71% of these enterprises fail to apply social or environmental reporting standards, mainly due to limited methodological knowledge, perceived high implementation costs, lack of qualified personnel, and absence of legal requirements. The results also showed that enterprises with more than ten years of operation have a greater capacity to establish csr policies. Finally, there is a direct relationship between csr and ir —the former provides the content and the latter offers the structure for efficiently communicating value creation to stakeholders.
Conclusions: Despite its pitfalls, ir functions as a dynamic instrument that integrates csr principles and provides a holistic view of organizational performance, facilitating communication with stakeholders and contributing to building a more sustainable future.
Originality: This study highlights how smes can demonstrate value creation and legitimacy to stakeholders through ir. It also opens new avenues for research, such as the analysis of Latin American enterprises and their impact on investors’ decision-making.
Keywords: sustainability standards, smes, integrated reporting, Corporate Social Responsibility, sustainability.
JEL codes: M21, M41, M48.
Highlights
Resumen
Objetivo: Identificar los principales obstáculos y oportunidades a los que se enfrentan las pymes latinoamericanas a la hora de implementar el reporte integrado (ri), una respuesta estratégica a los retos sociales y medioambientales actuales que facilita la divulgación de iniciativas responsables y sostenibles en el sector empresarial.
Metodología: esta investigación de enfoque mixto, que tuvo como población objetivo seis países latinoamericanos: Argentina, Brasil, Colombia, Ecuador, México y Perú, se fundamentó en la aplicación de 100 encuestas a empresarios, académicos e investigadores, complementadas con 27 entrevistas semiestructuradas realizadas a profesionales de reconocido prestigio latinoamericano.
Resultados: el estudio reveló que el reporte integrado no solo es para empresas globales; las pymes latinoamericanas también generan estrategias sostenibles como financiamiento en proyectos sostenibles, pago por productos sostenibles y certificaciones ambientales. Sin embargo, hay barreras importantes: el 71 % de las empresas no aplican estándares de balance social o ambiental, principalmente por desconocimiento de metodologías, percepción de altos costos de implementación, falta de personal calificado y ausencia de obligatoriedad legal. La investigación demuestra que las empresas con más de 10 años de trayectoria tienen mayor capacidad para establecer políticas de Responsabilidad Social Empresarial (rse). Finalmente, existe una relación directa entre la rse y el reporte integrado: la primera proporciona el contenido y el segundo ofrece la estructura para comunicar eficazmente la creación de valor a los grupos de interés.
Conclusiones: el reporte integrado funciona como instrumento dinámico que integra principios de responsabilidad social empresarial y proporciona una visión holística del desempeño organizacional, facilitando la comunicación con los stakeholders y contribuyendo a la construcción de un futuro más sostenible.
Originalidad: este estudio es clave para que las pymes mundiales demuestren su creación de valor y legitimidad ante los stakeholders. También abre nuevas líneas de investigación, como el análisis de empresas latinoamericanas y su impacto en las decisiones de los inversores.
Palabras clave: estándares de sostenibilidad, pymes, reporte integrado, responsabilidad social empresarial, sostenibilidad.
códigos JEL: M21, M41, M48.
Highlights
1. INTRODUCTION
Currently, major social and environmental challenges such as climate change require the business sector—the main driver of economic development—to play a key role in mitigating environmental damage and reducing poverty through the implementation of Corporate Social Responsibility (CSR) practices (
Against this backdrop, standards such as the sustainability reports of the
Around the globe, academic and professional interest in ir has increased rapidly, recognizing its importance for creating value over time (
Voluntary disclosure of corporate assets has gained relevance among enterprises and governance bodies as an alternative means of communicating actions to stakeholders. Financial statements, along with their disclosures and annexes, contain information on the enterprise situation and performance, revealing various aspects of the value creation process (
Thus, this article aims to provide Latin American smes with the tools required to apply the European Common Reporting Framework. To this end, it identifies the challenges these firms face and offers insights into the future development of a reporting model that reflects their relationship with csr practices and value creation, thereby facilitating managerial decision-making through relevant indicators.
This paper is organized into six sections. Following this introduction, Section 2 outlines the historical and conceptual background of ir, from the nineteenth century to the present. Section 3 describes the mixed-methods methodology employed, including the data collection instruments and the sample used. Sections 4 and 5 present the results and discussion in relation to the hypotheses concerning the application of ir in Latin American smes. Finally, Section 6 offers the study’s conclusions, along with its limitations and recommendations for future research.
2. THEORETICAL FRAMEWORK
To address ir, it is necessary to deeply understand the theoretical frameworks that explain the way organizations legitimize their actions, respond to stakeholder demands, and adapt to regulatory and institutional environments. The integration of these conceptual perspectives is key to analyzing how enterprises, particularly smes, communicate their value creation process around the six capitals defined by the iirc (financial, manufactured, intellectual, human, social and relationship, and natural) over different time horizons. In this regard, the legitimacy theory, the stakeholder theory, and the institutional theory offer complementary foundations for managing the harmonization, quality, and credibility of reporting in response to social, regulatory, and market pressures (
Figure 1 illustrates a cyclical and progressive model for implementing ir in Latin American smes, highlighting its continuous and dynamic nature. The diagram shows how the adoption of ir evolves gradually according to organizational capacities and institutional context, integrating strategy, sustainability, and value creation.
Legitimacy Theory
The legitimacy theory holds that organizational continuity depends on social acceptance and alignment with values shared by society. According to
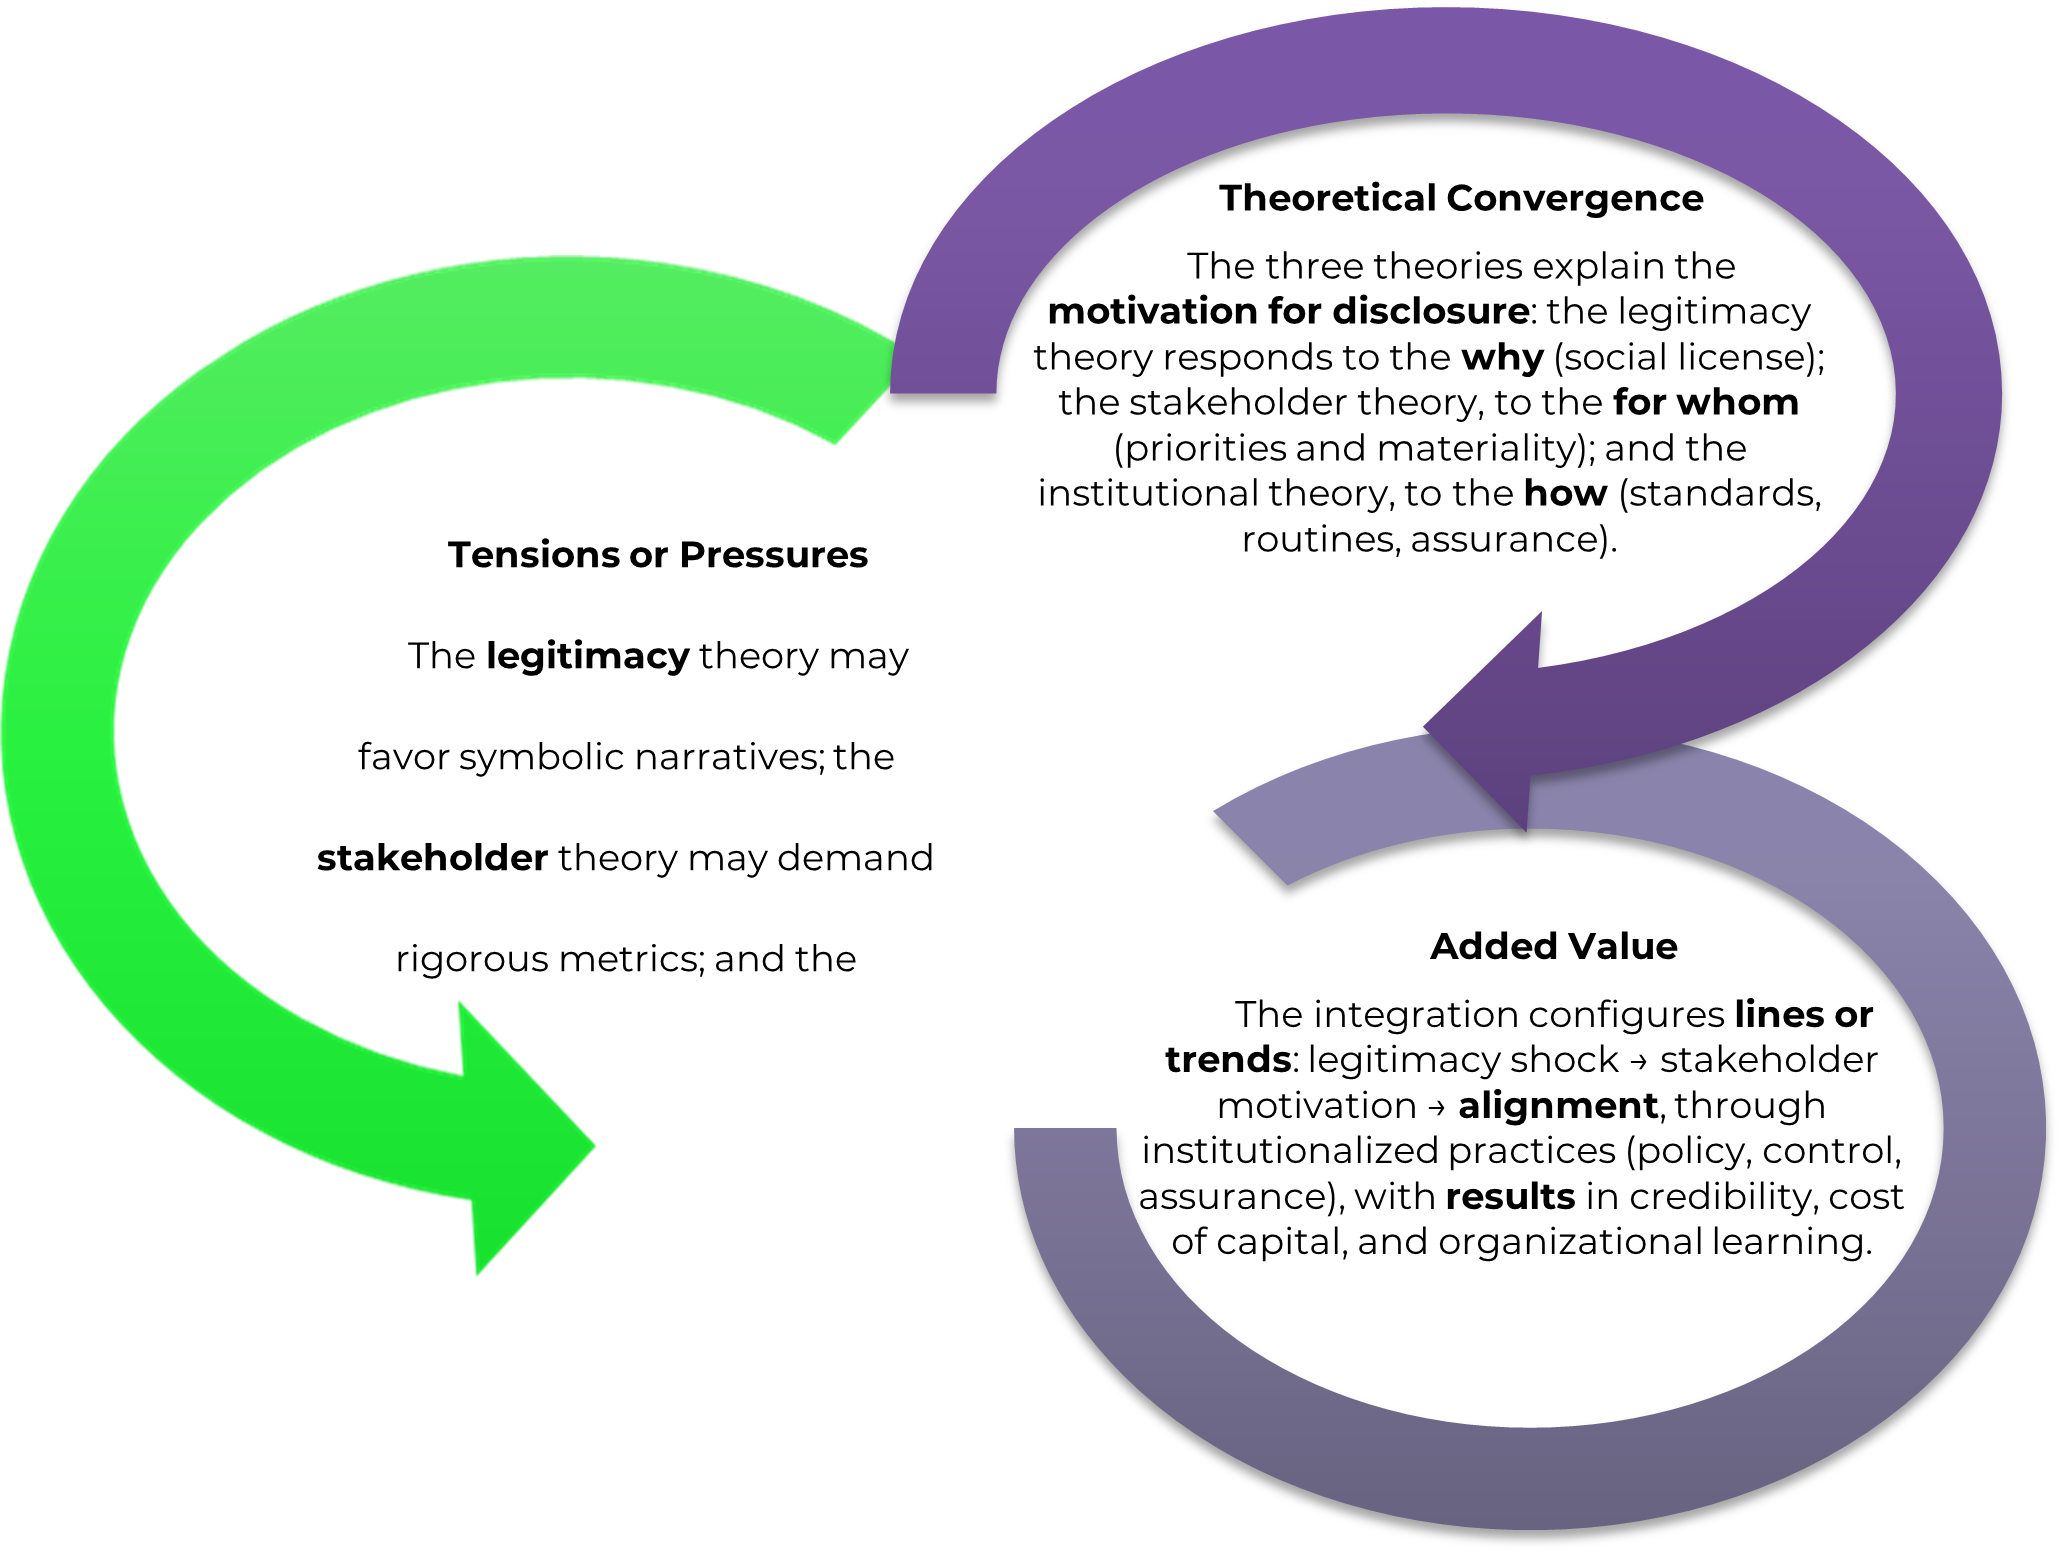
Figura 1. Integración teórica del reporte integrado
Source: Authors’ own work.
Stakeholder Theory
Formulated by
Institutional Theory
Rooted in the work of Veblen (
Taken together, these three theories offer insights into how legitimacy socially justifies disclosure, how stakeholders define their relational and accountability dimensions, and how institutions establish the frameworks that structure and standardize ir practices. Their interaction positions ir as a tool not only for communication purposes but also for strategic management and sustainability.
Historical Evolution and International Integrated Reporting Frameworks
Since the mid-twentieth century, accounting information has undergone a gradual transformation toward the incorporation of social, environmental, and ethical variables. In the 1970s, traditional financial statements began to be supplemented with social reports (
The Jenkins Report, prepared by the
The iasb has maintained a traditional ir philosophy by articulating accounting and legal standards. In this sense, non-financial information is presented as a complement to financial disclosures. One of the most generally recognized and applied models in social and environmental reporting is the Sustainability Reporting Framework of the gri (
Simultaneously, initiatives such as the
South Africa became a pioneer by making ir mandatory in 2010 for companies listed on the Johannesburg Stock Exchange (
In Europe, Directive 2014/95/ue—issued by the European Parliament and the Council of the European Union—required the inclusion of non-financial information in the management reports of public-interest entities (
Furthermore, the merger between the sasb and the iirc gave rise to the
Based on the above, Table 1 summarizes the historical evolution of corporate reporting models, highlighting the transition from exclusively financial statements to integrated frameworks that articulate economic, social, and environmental dimensions. This advancement reflects changes in stakeholder demands and the growing recognition of sustainability as a central component in the creation of organizational value.
Tabla 1. Evolución del reporting sobre información financiera y no financiera
| Decade | Type of Report | Characteristic |
| Before the 1970s | Financial statements | Predominantly financial dimension |
| 1970s–1980s | Reports focused on financial information | Financial dimension with little social and environmental information |
| Isolated reports on social or environmental information | One sustainability dimension (social or environmental) | |
| 1990s | Isolated reports on financial information | Financial dimension |
| Specialized sustainability reports that combine social and environmental information | Two sustainability dimensions (social and environmental) | |
| 2000s | Initiatives to present sustainability and financial information in a global report | Predominance of the financial dimension and emergence of non-financial information |
| Present | A single integrated report | Three balanced sustainability dimensions (financial, social, and environmental) |
In summary, both theory and practice configure the conceptual framework of ir. From a theoretical perspective, it is based on legitimacy, stakeholders, and the institutions that shape the dynamics of corporate disclosure. From a practical point of view, it has been developed through global standards—gri, sasb, csrd, iso 26000, Value Reporting Foundation—that aim to harmonize transparency, comparability, and accountability. In this regard, ir not only communicates value creation but also strengthens stakeholder confidence and contributes to organizational sustainability through the articulation of financial, social, and environmental performance (
3. METHODOLOGY
This study employed a mixed-methods approach with a descriptive and explanatory scope to identify the main obstacles and opportunities faced by Latin American smes when implementing ir in the regional business context. To this end, it combined quantitative and qualitative techinques through a triangular methodological design that integrated three phases: literature review, surveys, and semi-structured interviews.
In the first phase, the literature review centered on ir and sustainability. The search was conducted in two internationally recognized scientific databases, namely Scopus and Web of Science, following the guidelines proposed by
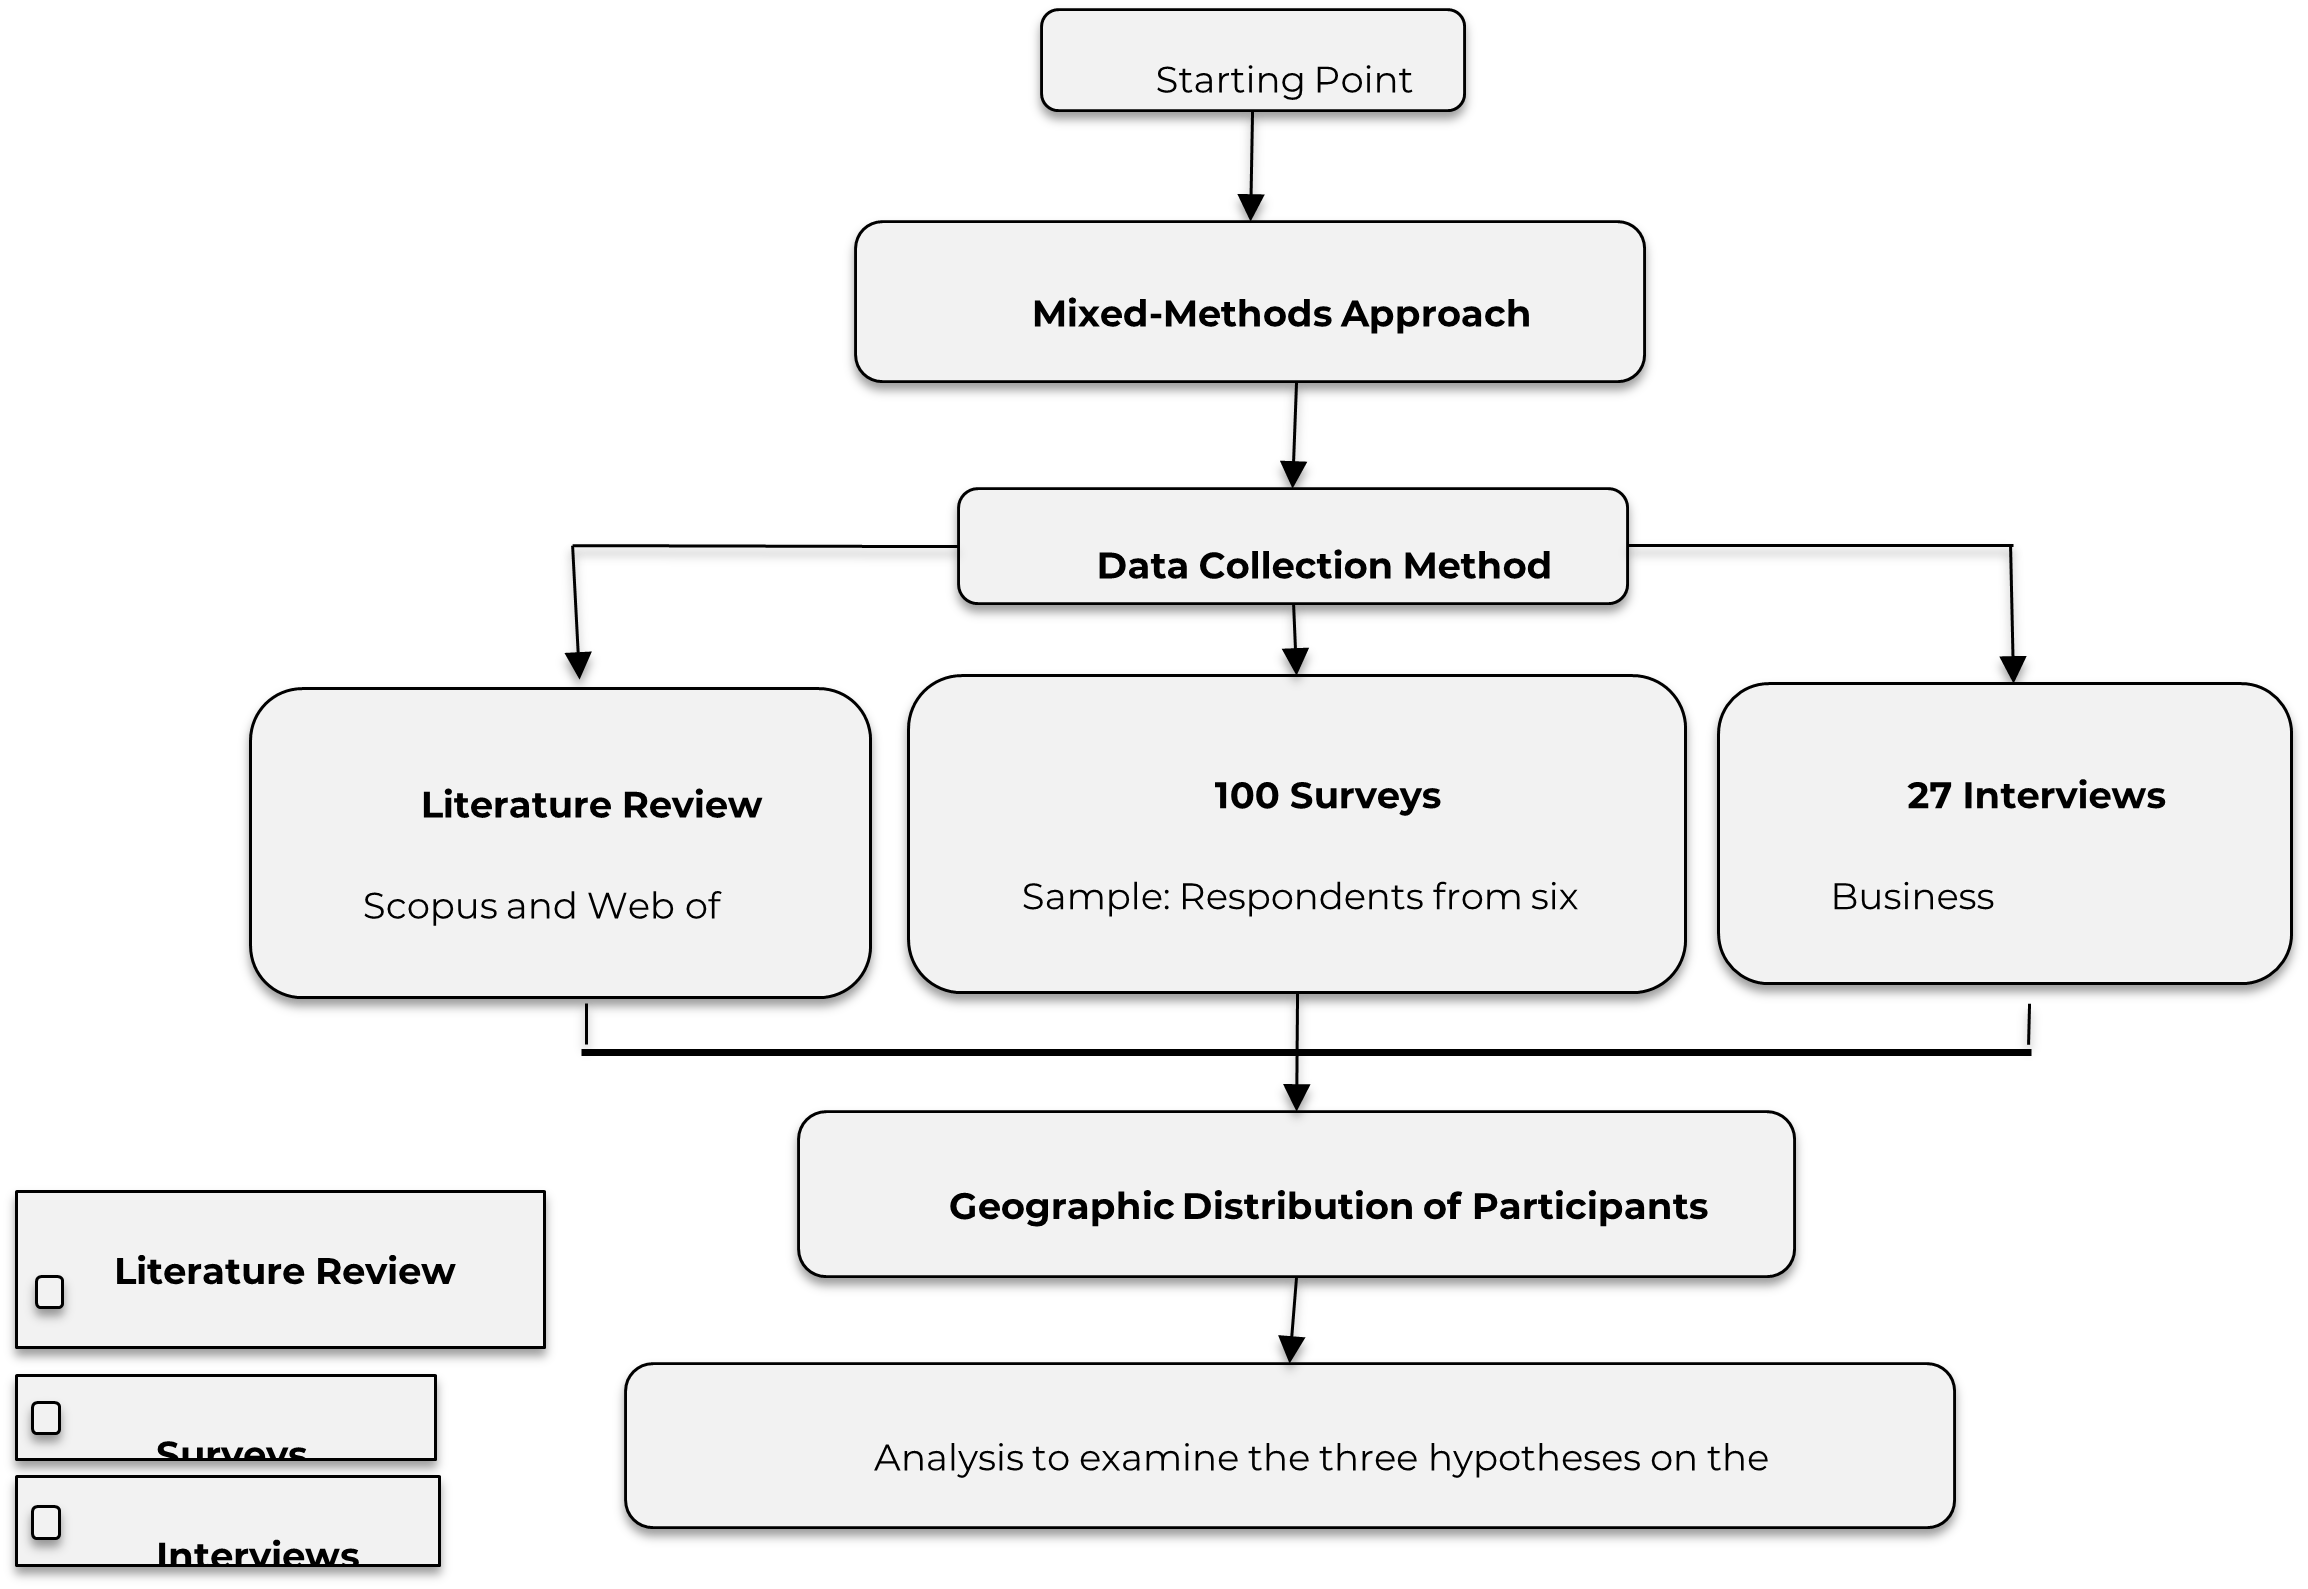
Figura 2. Metodología para analizar la implementación del reporte integrado
Source: Created by the authors.
In the second phase, a structured questionnaire was administered to a target population of 900 participants, comprising entrepreneurs, scholars, consultants, and researchers linked to the Latin American business sector. A total of 100 valid responses were obtained, exceeding the 96 required to guarantee a 90 % confidence level and an 8 % margin of error. The instrument consisted of 17 questions inquiring about the application of csr principles, the perceived benefits of ir, the barriers identified, and the existence of management indicators. Responses were received from six Latin American countries: Argentina, Brazil, Colombia, Ecuador, Mexico, and Peru, which ensured regional representativeness and allowed for the recognition of common patterns and contextual differences in the implementation of ir.
The third phase involved the collection of qualitative information through ten semi-structured interviews with business representatives, government officials, and field experts. The interviewees were from Argentina, Colombia, Chile, Ecuador, and Peru, which provided a diversity of perspectives on the challenges, opportunities, and barriers associated with the adoption of ir in smes across the region.
Finally, the data analysis was designed in an integrated manner to test the formulated hypotheses. Information gathered from the three sources—literature review, surveys, and interviews—was triangulated. This methodological approach made it possible to contrast theoretical perspectives with business practices, strengthen the validity and robustness of the results, and offer a holistic understanding of the phenomenon.
4. RESULTS
The results of this study provide deeper insights about the level of progress, appropriation, and challenges of ir in Latin America, particularly in the context of smes. Consequently, the findings are presented in an integrated manner, articulating quantitative and qualitative evidence and establishing connections with the contemporary literature on corporate sustainability, business transparency, and international sustainability reporting standards.
The evidence suggests that the region is undergoing a process of institutional and organizational maturation around sustainability. Although ir has not yet reached significant levels of adoption among Latin American smes, clear signs of progress point to growing incorporation of non-financial reporting practices, sustainability-oriented strategic thinking, and long-term value management.
Global Context and Relevance of Integrated Reporting
Over the past 15 years, ir has evolved from a voluntary initiative promoted by international organizations into a global benchmark for the strategic disclosure of corporate performance (
By 2025, the number of organizations worldwide adopting the ir framework exceeded 2,500, representing a 35 % increase compared to 2022 (
- the consolidation of stricter regulatory frameworks in Europe (such as the csrd).
- the issuance of global standards by the
International Sustainability Standards Board (ISSB, 2024 ). - pressure from institutional investors demanding clear information on climate and sustainability risks.
- growing expectations from consumers, financial institutions, and civil society.
These factors have contributed to an environment where non-financial disclosure is no longer merely a reputational concern but a strategic and legal requirement, particularly for organizations with international exposure (
Stakeholder Engagement Practices
The results show that Latin American smes have begun to incorporate sustainability-oriented practices in their interaction with key stakeholders, particularly customers and suppliers. Although these practices do not in themselves constitute ir, they do represent a step toward integrated thinking, one of the pillars of ir.
The data presented in Figure 3 reveal that:
- 47.1 % of companies use csr to enhance their product pricing, reflecting that offering healthy and sustainable products increases consumers' willingness to pay a premium for them.
- 5.9 % of enterprises finance third-party sustainable projects, suggesting the presence of strategic alliances linked to sustainability.
- 17.6 % prioritize environmentally friendly products, indicating the integration of sustainability criteria into the supply chain.
- 29.4 % pursue environmental certifications, which implies an explicit interest in strengthening institutional legitimacy.
These practices are aligned with ir principles, which propose that value creation is a relational and dynamic process constructed jointly by the organization and its environment.
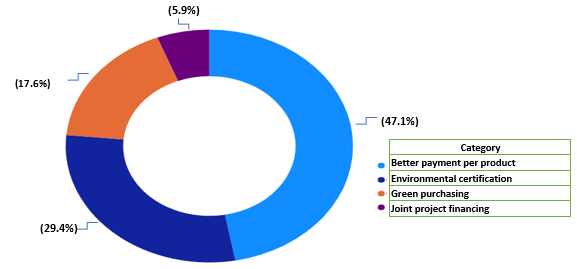
Figura 3. Aspectos que aplican los grupos de interés
Source: Authors’ own work based on survey data.
Additionally, these practices were found to be more developed in enterprises with over ten years of operation, suggesting that organizational consolidation is a relevant predictor of the adoption of sustainability-oriented practices.
Evolution of the Strategic Dimension in Small and Medium-Sized Enterprises
This study revealed a transition in the way Latin American smes approach strategic management. Although these enterprises have historically been characterized by reactive operations and low levels of formalization, the information compiled in Figure 4 shows emerging changes in the following key areas:
- 26.4 % make individual or group decisions, suggesting that strategic management remains concentrated in a few individuals within the organization.
- 15.8 % track green purchases, indicating a growing integration of sustainable criteria in procurement decisions.
- 13.8 % use risk and opportunity matrices, reflecting greater awareness of the need to anticipate scenarios and manage uncertainty.
- 13.4 % prioritize resource allocation, evidencing efforts to plan the efficient use of available capital.
- 11.6 % conduct environmental analysis, signaling an orientation toward understanding the competitive and sectoral context.
- 9.3 % monitor competitors, suggesting an increasing interest in market positioning.
- 8.0 % develop improvement plans, implying an organizational culture oriented toward continuous improvement.
- 1.7 % participate in business fairs, indicating that external networking and commercial visibility remain underdeveloped practices
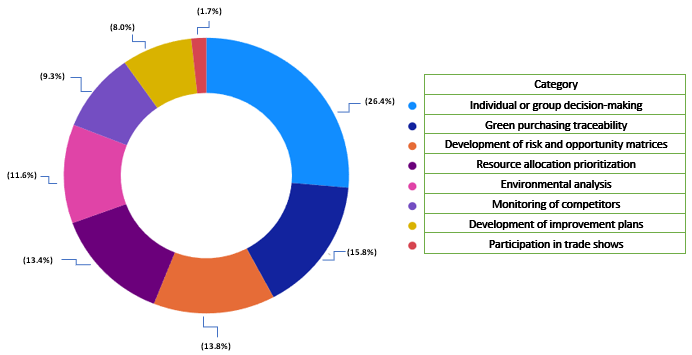
Figura 4. Actividades de gestión de las empresas
Source: Authors’ own work based on survey data.
Although incipient, these activities reveal that smes are incorporating management tools typically used by more sophisticated and professionalized organizations. This behavior is consistent with previous studies suggesting that the formalization of strategic processes is a prerequisite for adopting non-financial reporting and advanced corporate information models. Notably, smes engaging in strategic activities are more likely to implement Environmental, Social, and Governance (esg) practices, laying the groundwork for the eventual introduction of ir.
Organizational History and Internal Capacities
Business history emerges as a determining factor. Figure 5 shows that 67 % of enterprises have been operating for over ten years, and 22 % for more than 5 years, which has a positive influence on the adoption of sustainability models due to:
- accumulation of organizational experience.
- greater administrative and financial stability.
- expansion of external networks and social fabric.
- increased institutional pressure to comply with emerging standards.
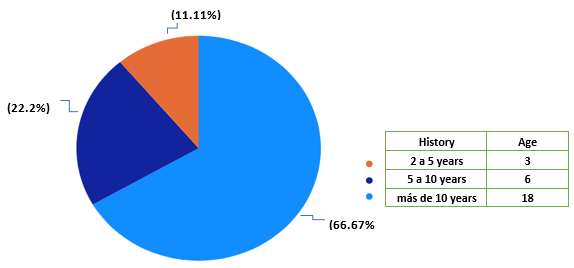
Figura 5. Edad de las empesas
Source: Authors’ own work based on survey data.
However, as shown in Figure 6, nearly 70.37 % of companies implement some form of social or environmental reporting, reflecting significant progress in sustainable reporting culture. However, the remaining 29.63 % have yet to do so, highlighting the persistent gap between interest and capacity — a recurring finding in regional studies by the
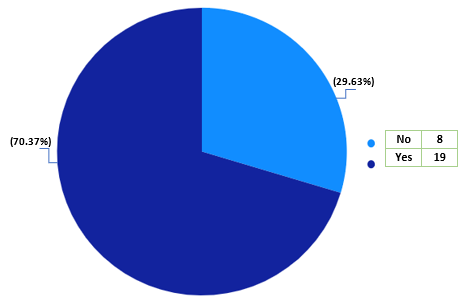
Figura 6. Aplicación de modelos de reporte integrado
Source: Authors’ own work based on survey data.
The most common reasons for not reporting include:
- absence of standardized processes
- budget constraints
- lack of personnel trained in sustainability and reporting
- perception that these models are designed for large enterprises.
Structural Barriers to the Adoption of Integrated Reporting
Figure 7 synthesizes the main barriers faced by Latin American smes in adopting non-financial reporting and Integrated Reporting (IR). The surveys and interviews conducted with representatives of these organizations made it possible to identify several concrete obstacles that explain why they have yet to incorporate either practice into their management processes.
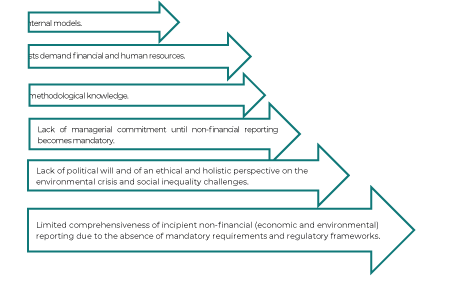
Figura 7. Barreras a modelos no financieros y reporte integrado
Source: Authors’ own work.
Lack of methodological knowledge leads the findings, accounting for 32 % of responses. Business owners and experts alike acknowledged having no clear understanding of how to develop this type of report, with several noting that, faced with this uncertainty, they resort to applying their own internal models that do not necessarily align with recognized international standards. This finding reveals that the barrier is not a lack of willingness, but rather the absence of accessible, context-specific technical guidance.
At 28 %, the perceived high cost of implementation ranks second. Across both instruments, a recurring view emerged: these processes demand financial resources that SMEs are simply not in a position to allocate, particularly when no legal obligation exists to justify the investment.
Lack of specialized personnel, at 22 %, occupies third place. SMEs typically operate with lean teams managing multiple responsibilities simultaneously, making it difficult to assign staff to processes that also require specific technical expertise in non-financial reporting matters.
Finally, the absence of mandatory regulatory frameworks concentrates 18 % of responses. Several participants were explicit on this point: management interest in adopting these models tends to surface only when a binding legal requirement is in place. This, combined with the fact that non-financial reporting remains unregulated across a significant number of countries in the region, confirms that the normative environment continues to be a decisive factor in whether implementation moves forward or stalls indefinitely.
Taken together, the results obtained through the applied instruments demonstrate that these barriers do not operate independently. They form an interconnected cycle in which weak regulation diminishes institutional commitment, limited knowledge constrains the capacity to act, and the scarcity of both human and financial resources ultimately brings any meaningful progress to a halt. Overcoming them will require not only political will and an ethical, holistic vision of the environmental and social challenges confronting the region, but also a sustained and genuine commitment from academia, the public sector, and organizations themselves to build the foundational conditions that make ir adoption a realistic and viable path for Latin American SMEs.
Human Capital Practices and Internal Sustainability
Internally, as illustrated in Figure 8, human capital practices show significant progress toward more sustainable labor models, including:
- Performance bonuses (31.6 %)
- Teleworking (19.3 %)
- Government benefits (16.4 %)
- Education allowance (14.2 %)
- Food allowance (10.5 8201%)
- Flexible working hours (8 %)
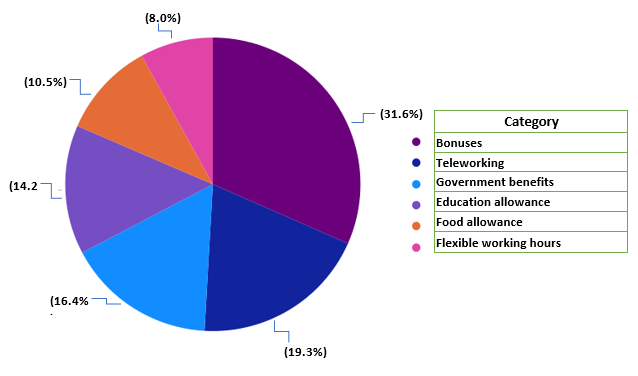
Figura 8. Recursos humanos aplicados en la empresa
Source: Authors’ own work based on survey data.
Performance bonuses stand out at 31.6 %, indicating that financial incentives remain the most widely used tool for motivating and retaining staff. This is followed by teleworking at 19.3 %, whose presence reflects the adaptation that many companies were compelled to undertake in response to the changes brought about by the pandemic, a practice that some have since maintained as a permanent part of their management model.
Government benefits (16.4 %) and education allowances (14.2 %) rank third and fourth respectively, showing that a portion of these organizations take advantage of existing regulatory frameworks and invest in training as a pathway for human talent development. With a smaller share, food allowances (10.5 %) address workers' basic needs, while flexible working hours (8.0 %) record the lowest adoption rate, a finding worth highlighting given their widely recognized influence on employee well-being and overall productivity.
The results show that Latin American SMEs tend to prioritize direct financial incentives over flexibility and development strategies, aspects that, in the medium and long term, carry greater weight in organizational sustainability and the quality of life of their workforce.
Qualitative Findings: Insights from Latin American Experts
The experts interviewed agreed that:
- ir is conceptually well understood but poorly implemented in the region.
- many organizations produce “integrated reports” without complying with iirc principles.
- a descriptive approach prevails over a strategic one.
- adoption is higher among benefit corporations, certified b organizations, and exporters.
- smes lack clear regulatory incentives.
- there is a gap between theoretical knowledge and technical capabilities.
The interviewees emphasized the need for:
- specialized training in sustainability and esg reporting.
- simplified standards for smes (as proposed by the ifrs Foundation in its 2024–2027 agenda).
- incorporation of integrated thinking in universities and business associations.
- stronger institutional pressure, especially from the financial system.
Overall, the results indicate that, in Latin America, ir is evolving from a declarative to a strategic approach. Although adoption among smes is still limited, signs of progress are evident in terms of:
- greater awareness of sustainability.
- professionalization of business management.
- increased strategic interaction with stakeholders.
- regulatory advances in specific countries.
- emerging processes of risk and human capital management.
Eventually, the consolidation of ir in the region will depend on factors such as:
- institutional strengthening in business regulation.
- internal technical training in reporting methodologies.
- reduction of economic and technological gaps.
- dissemination of models adapted to smes.
5. DISCUSSION
The implementation of ir is a strategic mechanism that benefits both internal management and the external positioning of organizations because it coherently articulates economic, social, and environmental information. In this regard, Table 2 provides a comparative overview of the evolution and scope of the main sustainability reporting models, showing how traditional approaches focused on isolated dimensions have gradually led to more comprehensive frameworks. Unlike previous standards—such as those developed by the
Tabla 2. Comparación de informes de sostenibilidad
| IBASE | CILEA (2013) | ILO | AECA (2004-2015) | GRI | IR | |
| ECONOMIC | ||||||
| Net income | Gross sales | Net sales | Social and environmental investment | Value added created | Direct economic value created | Strategy and analysis |
| Gross income | Total value added | Investment income | External capital | Employee compensation | Operating expenses | Business model |
| Gross payroll | Taxes paid to government | Economic value distributed | Equity | State ownership | Community investments | Performance |
| SOCIAL | ||||||
| Internal social indicators | Social and labor characteristics | Human resources | External capital payment | Culture | Organizational profile | Corporate governance |
| Food allowance | Social services | Health | Undistributed earnings | Training | Operational structure | Risks and opportunities |
| Private pension | Integration and development | Education | Contributions to society | Professional development | Infrastructure investments | Resource strategy |
| ENVIRONMENTAL | ||||||
| Occupational health | Internal operations | Organizational culture | Value-added statement | Childcare services | Markets served | Organizational description |
| Personal protective equipment | Environmental services | Profit sharing | Environmental investment | Employee benefits | Organizational size | Future prospects |
| Workplace safety | Environmental impact | Other benefits | Organizational needs | Wellness programs | Significant changes | Basis of preparation |
The evolutionary shift from reporting frameworks focused exclusively on basic economic indicators, such as net sales or gross revenue, to multidimensional systems integrating social and environmental variables responds to growing stakeholder pressure for more comprehensive and effective accountability. This transition highlights the limitations of traditional financial statements in capturing the complexity of value creation in the contemporary business context.
In this respect, Table 3 condenses and compares the main internal and external benefits associated with the adoption of ir. It shows the way this approach strengthens not only strategic management, decision-making, and organizational governance but also transparency, reputation, and stakeholder relations.
Tabla 3. Comparación detallada de los beneficios internos y externos del reporte integrado
| Internal Benefits | External Benefits |
| Improved managerial decision-making | Accountability culture |
| Communication of strategic aspects across organizational levels | Elimination of barriers in business areas |
| Collaborative thinking | Synergy and knowledge sharing |
| Increased stakeholder involvement | Collaborative work in the organizational environment |
| Awareness of risks and opportunities | Improvement of organizational relations |
| Enhanced organizational reputation | Awareness of value creation processes |
| Organizational competitiveness | Trust among stakeholders |
| Information on capital decisions | Opportunities for professional development |
| Information on corporate governance | Creation of a quality policy |
| Improvement of internal communication across functional areas | Improved image, visibility, and positioning |
| Summary: ir creates value both internally, by optimizing organizational management, and externally, by strengthening stakeholder relationships and improving corporate reputation. | |
The results of this study confirm that the adoption of ir has a dual impact. On the one hand, it improves decision-making processes and internal strategic coherence; on the other hand, it strengthens accountability and reputation among stakeholders. This duality shows that ir goes beyond simply communicating information—it becomes a mechanism that integrates governance, sustainability, and long-term value creation (
Internally, evidence suggests that ir acts as a strategic alignment tool, articulating financial and non-financial objectives and promoting the dissemination of relevant information across organizational levels. This approach encourages the comprehensive management of the six capitals proposed by the iirc (financial, manufactured, intellectual, human, social and relationship, and natural), strengthening enterprises’ ability to anticipate risks, optimize resources, and guide decision-making toward sustainability.
From an external perspective, ir contributes to consolidating a culture of transparency and accountability, improving stakeholder relations and projecting a more responsible image to the market (
The findings also underscore the need to reinforce sme participation in these processes. Given that over 90 % of the global business fabric is made up of micro- and small enterprises, raising awareness of their impacts and contributions is key to moving toward a more inclusive and sustainable economic model. However, these organizations face considerable obstacles, including lack of resources, insufficient technical training, and limited knowledge of sustainability frameworks and ir.
Against this backdrop, Figure 9 summarizes the main factors influencing the adoption of ir in Latin American smes. It compares the elements that enable its implementation, the structural barriers and challenges it faces, and the emerging opportunities derived from its incorporation. The diagram confirms the dynamic and context-dependent nature of ir in smes, demonstrating that its application depends as much on internal capacities and institutional support as on regulatory, cultural, and market conditions.
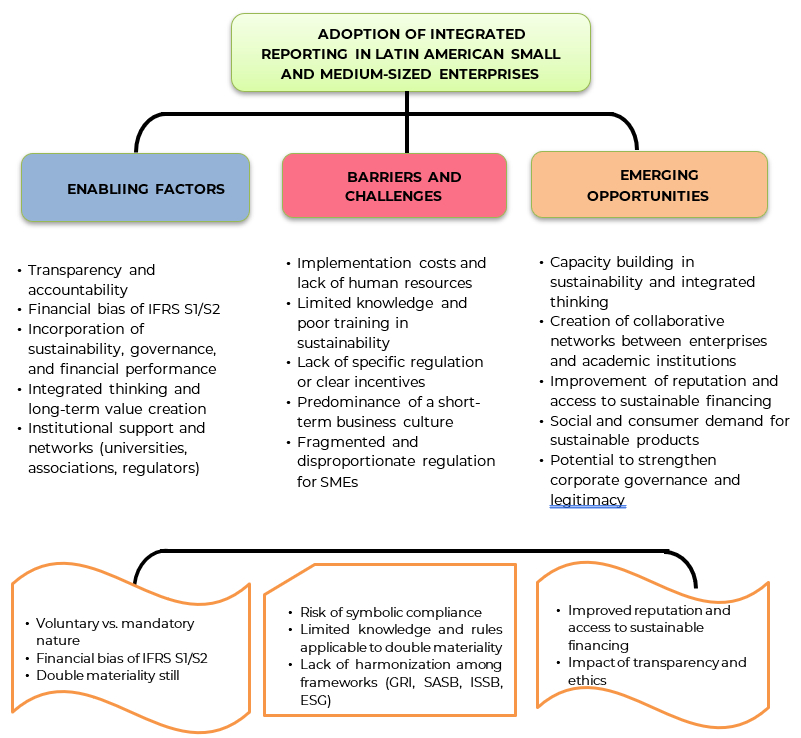
Figura 9. Adopción del reporte integrado en pymes latinoamericanas
Source: Authors’ own work.
This study revealed that many Latin American enterprises use the term “integrated report” but fail to apply the iirc principles. In practice, they tend to prepare partial compilations of financial, sustainability, and governance information, with little conceptual and strategic connection. This situation highlights a knowledge gap among managers regarding the essence of integrated thinking and esg criteria, which limits the transformative potential of ir.
The promotion of a wider and more effective adoption of ir in Latin American smes requires a comprehensive approach that combines training personnel, simplifying regulatory frameworks, and creating appropriate incentives. Education in sustainability and ir should be a priority within universities, business associations, and professional bodies in order to develop capabilities in impact measurement, capital management, and value communication. Academic institutions play a crucial role in this process not only because of their training capacity but also due to their influence on the generation and dissemination of applied knowledge.
The Latin American case, and particularly the Colombian context, shows that publicly traded companies have made progress in sustainability reporting. However, stronger regulation and greater commitment from supervisory bodies and government institutions are still needed. In unlisted companies, owners and managers remain underprepared on issues such as sustainability, circular economy, the Sustainable Development Goals, and ir (
Likewise, one of the critical factors identified is the shortage of professionals specializing in sustainability and corporate reporting. Based on the academic experience of universities, it has been confirmed that, despite advances in outreach and training programs, professionals still have significant gaps in their technical mastery of ir and sustainable management. Thus, there is a clear need to incorporate these topics into undergraduate and continuing-education curricula, with an interdisciplinary approach that combines accounting, finance, administration, and social sciences.
Generally speaking, this discussion confirms that ir has the potential to become a key tool for creating sustainable value and organizational legitimacy. However, its impact depends on institutional maturity, managerial commitment, and a regulatory environment that encourages transparency. Latin American smes have the strategic opportunity to adopt this model, even though this would entail reinforcing their technical capacities, improving their governance, and developing a sustainability-oriented organizational culture.
Finally, future research should further examine the impact of ir on decision-making and governance processes and explore the possibility of moving toward a unified instrument that aligns financial and non-financial information with global standards. Addressing this challenge would contribute to improving not only the comparability and credibility of reports but also corporate reputation and confidence in enterprises, thereby consolidating ir as an effective vehicle for sustainability and business transformation in Latin America.
6. CONCLUSIONS
The evolutionary transition from social balance to ir has facilitated a deeper and more inclusive integration of economic, social, and environmental aspects into corporate governance. The analysis of various csr standards and practices shows that ir has become an essential tool for harmonizing these dimensions, functioning as a channel for communication between enterprises and their stakeholders. This interconnection enhances transparency and effectiveness in the disclosure of social and environmental actions and results, contributing to the common good and the construction of a more sustainable future.
The results of this study establish a significant correlation between business strategy and performance in Latin American smes. Entrepreneurs and managers of these organizations show increasing awareness of the importance of analyzing their environment, prioritizing resource allocation, and proactively managing risks. The fact that respondents give relevance to environmental analysis (29 %) and resource allocation (18 %) weakens the belief that smes have no intention of applying a strategic approach aimed at creating long-term sustainable value.
According to 32 % of the enterprises studied, the main obstacle to adopting non-financial reporting is their lack of familiarity with ir models. In 22 % of enterprises, this limitation is exacerbated by a shortage of qualified personnel, which highlights a relevant shortfall in internal technical capacity. Furthermore, approximately 71 % of enterprises have not yet implemented any type of social or environmental reporting, which significantly hinders their ability to create, measure, and communicate value in terms of sustainability.
For smes, the perception of high implementation costs remains a major barrier and accounts for 28 % of non-financial reporting omissions. This situation creates a complex cycle because the enterprises that could benefit most from better communicating their sustainable value are precisely those that deal with the greatest restrictions in accessing these tools. In consequence, their competitiveness and growth potential become limited in markets that increasingly demand transparency and sustainability.
The absence of legal requirements accounts for 18 % of the reasons for not implementing ir, highlighting a legal gap that circumscribes the widespread adoption of these practices. Tax incentives have been introduced in countries such as Brazil, Colombia, and Mexico since 2023, as well as more demanding regulatory frameworks such as the Climate Reporting Law in Chile and the expanded governance model requirements in Colombia since 2024. However, fragmentation persists in the Latin American regulatory landscape, causing uncertainty and inconsistencies in application (
The challenges faced by Latin American smes in implementing ir are mainly linked to the high information collection costs; the absence of mandatory regulatory frameworks; and the shortage of human resources, financing, and specialized training. This issue calls for strategic coordination between higher education institutions, governments, and the business sector (i.e., the triple helix). Together, they can develop alternatives that promote the building and strengthening of capacities in the field of ir for the preparation of sustainability reports that convey the reality of smes in the region.
The main limitations of this study include the restricted scope of the sample, given that participation was concentrated on a small number of experts in Latin America. Similarly, the limited set of countries reduced the possibility of generalizing the results to the entire region. In addition, the evolution of ir adoption over time and its long-term impact on value creation could not be observed because of the cross-sectional nature of the study. In the qualitative component, the limited availability of experts and managers with in-depth knowledge of ir restricted the diversity of perspectives analyzed. Despite these constraints, this work provides a solid basis for future research that can delve deeper into the longitudinal, comparative, and sectoral analyses of ir in the Latin American context.
Based on the results, new research avenues emerge in the sphere of ir from economic, social, and environmental perspectives in smes around the world. Particularly, emphasis should be placed on microenterprises, whose process in the adoption of these new instruments is the most complex due to the multiple difficulties previously identified. This area of research offers an unexplored field for yielding more detailed insights about the specific challenges and opportunities faced by microenterprises.
CONFLICTS OF INTEREST
The authors declare no financial, professional, or personal conflicts of interest that could have inappropriately influenced the results or interpretations presented in this study.
AUTHOR CONTRIBUTIONS
This article derives from the PhD research conducted by the lead author under the supervision of two dissertation advisors at the University of Zaragoza (Spain). The doctoral student was therefore in charge of the conceptualization, design, and development of the study, as well as the drafting of the manuscript. The final version of the paper was reviewed and approved by the advisors.
REFERENCES
- arrow_upward Abeywardana, N. L. E., Ferdous Azam, S. M., & Kevin Low, L. T. (2021). Theoretical Review on Integrated Reporting. International Journal Of Scientific & Technology Research, 10(5), 99-111. https://www.ijstr.org/final-print/may2021/Theoretical-Review-On-Integrated-Reporting.pdf
- arrow_upward Abhayawansa, S. A. (2014). A review of guidelines and frameworks on external reporting of intellectual capital. Journal of Intellectual Capital, 15(1), 100-141. https://doi.org/10.1108/JIC-04-2013-0046
- arrow_upward Abhayawansa, S., Guthrie, J., & Bernardi, C. (2019). Intellectual capital accounting in the age of integrated reporting: A commentary. Journal of Intellectual Capital, 20(1), 2-10. https://doi.org/10.1108/JIC-01-2019-223
- arrow_upward Adams, C. A. (2015). The international integrated reporting council: A call to action. Critical Perspectives on Accounting, 27, 23-28. https://www.sciencedirect.com/science/article/abs/pii/S1045235414000732
- arrow_upward American Institute of Certified Public Accountants. (1994). Improving Business Reporting - A Customer Focus: Meeting the Information Needs of Investors and Creditors. The AICPA Special Committee On Financial Reporting -The Jenkins Report. https://egrove.olemiss.edu/aicpa_comm
- arrow_upward Bebbington, J., Kirk, E. A., & Larrinaga, C. (2012). The production of normativity: A comparison of reporting regimes in Spain and the UK. Accounting, Organizations and Society, 37(2), 78-94. https://doi.org/10.1016/j.aos.2012.01.001
- arrow_upward Beck, C., Dumay, J., & Frost, G. (2017). In pursuit of a 'single source of truth': From threatened legitimacy to integrated reporting. Journal of Business Ethics, 141(1), 191-205. https://doi.org/10.1007/s10551-014-2423-1
- arrow_upward Busco, C., Malafronte, I., Pereira, J., & Starita, M. G. (2019). The determinants of companies' levels of integration: Does one size fit all? The British Accounting Review, 51(3), 277-298. https://doi.org/10.1016/j.bar.2019.01.002
- arrow_upward Caballero Caballero, I., & Balaguer Vegas, A. I. (1987). NTP 687: Responsabilidad social de las empresas: Modelo de Balance Social de ANDI-OIT (I). https://www.cso.go.cr/legislacion/notas_tecnicas_preventivas_insht/NTP%20687%20-%20Responsabilidad%20social%20de%20las%20empresas%20Modelo%20de%20Balance%20Social%20de%20ANDI%20-%20OIT%20(I).pdf
- arrow_upward Chiba, S., Talbot, D., & Boiral, O. (2018). Sustainability adrift: An evaluation of the credibility of sustainability information disclosed by public organizations. Accounting Forum, 42(4), 328-340. https://doi.org/10.1016/j.accfor.2018.09.006
- arrow_upward Comité de Integración Latino Europa y América [CILEA]. (2013). Estudios Internacionales CILEA 2013/2 Propuesta de modelo de Balance Social y Ambiental para Pymes. https://www.cilea.info/dettpubblicazioni-Estudios_Internacionales_CILEA_2013_2_%E2%80%93_traducci%C3%B3n_en_ingl%C3%A9s/15_770/ita/
- arrow_upward Comisión Económica para América Latina y el Caribe [CEPAL]. (2024). Sostenibilidad empresarial en América Latina: Retos y oportunidades para las Pymes. Naciones Unidas.
- arrow_upward Deegan, C. (2002). Introduction: The legitimising effect of social and environmental disclosures – a theoretical foundation. Accounting, Auditing & Accountability Journal, 15(3), 282-311. https://doi.org/10.1108/09513570210435852
- arrow_upward Deloitte. (2024). Normas internacionales de sostenibilidad y clima NIIF S1 y S2. https://gestionderiesgo.org/wp-content/uploads/2024/10/05.-Normas-de-Sostenibilidad-NIIF-S1-y-S2-Gustavo-Arias.pdf
- arrow_upward DiMaggio, P. J., & Powell, W. W. (1983). The Iron Cage Revisited: Institutional Isomorphism and Collective Rationality in Organizational Fields. American Sociological Review, 48(2), 147-160. https://doi.org/10.2307/2095101
- arrow_upward Freeman, R. E., & McVea, J. (2001). A Stakeholder Approach to Strategic Management [paper]. University of Virginia - Darden School of Business. http://papers.ssrn.com/paper.taf?abstract_id=263511
- arrow_upward European Commission. (2025). Corporate sustainability reporting. https://finance.ec.europa.eu/capital-markets-union-and-financial-markets/company-reporting-and-auditing/company-reporting/corporate-sustainability-reporting_en
- arrow_upward Ficco, C., García, G., Sader, G., & Luna Valenzuela, J. (2021). El capital intelectual en el reporte integrado: Un estudio exploratorio en el mercado de capitales argentino a partir del análisis de datos textuales. RAN. Revistas Academia y Negocios, 7(2), 105-122. https://doi.org/10.29393/ran7-1cicf40001
- arrow_upward Ficco, C., & Luna Valenzuela, J. (2021). Divulgación de información no financiera sobre capital intelectual en el reporte integrado: Un estudio de caso en el mercado de capitales argentino. Contaduría Universidad de Antioquia, (79), 39-62. https://doi.org/10.17533/udea.rc.n79a02
- arrow_upward Fifka, M. (2012). The development and state of research on social and environmental reporting in global comparison. Journal für Betriebswirtschaft, 62(1), 45-84. https://doi.org/10.1007/s11301-012-0083-8
- arrow_upward Figueras, A. J., & Morero, H. A. (2013). La teoría del consumo y de los ciclos en Thorstein Veblen. Revista de Economía Institucional, 15(28). https://revistas.uexternado.edu.co/index.php/ecoins/article/view/3465
- arrow_upward Fortanier, F., Kolk, A., & Pinkse, J. (2011). Harmonization in CSR reporting: MNEs and global CSR standards. Management International Review, 51(5), 665-696. https://doi.org/10.1007/s11575-011-0089-9
- arrow_upward Global Reporting Initiative [GRI]. (2002). The global leader for sustainability reporting. https://www.globalreporting.org/
- arrow_upward Hahn, R., & Kühnen, M. (2013). Determinants of sustainability reporting: A review of results, trends, theory, and opportunities in an expanding field of research. Journal of Cleaner Production, 59, 5-21. https://doi.org/10.1016/j.jclepro.2013.07.005
- arrow_upward Halid, S., Mahmud, R., Zakaria, N. B., & Rahman, R. A. (2021). Does Board Monitoring Affect Integrated Reporting Disclosure for Better Transparency and Sustainability? Universal Journal of Accounting and Finance, 9(5), 1049-1057. https://doi.org/10.13189/ujaf.2021.090515
- arrow_upward Instituto Argentino de Responsabilidad Social [IARSE]. (s.f.). ¿Quiénes somos?. https://iarse.org/quienes-somos/
- arrow_upward IFRS Foundation. (2023). NIIF S1. Norma NIIF® de Información a Revelar sobre Sostenibilidad. Requerimientos Generales para la Información Financiera a Revelar relacionada con la Sostenibilidad NIIF S1 y S2. https://www.ifrs.org/content/dam/ifrs/publications/pdf-standards-issb/spanish/2023/issued/part-a/es-issb-2023-a-ifrs-s1-general-requirements-for-disclosure-of-sustainability-related-financial-information.pdf?bypass=on
- arrow_upward International Association for Bridge and Structural Engineers (IBASE). (2007). Modelo Balance Social IBASE. https://comunicarseweb.com/wp-content/uploads/1321904976_30361780-Modelo-de-Balance-Social-IBASE-Version-en-Espanol-2007.pdf
- arrow_upward International Integrated Reporting Council [IIRC]. (2013). Integrated Reporting Now part of IFRS Foundation. https://integratedreporting.ifrs.org/wp-content/uploads/2015/03/13-12-08-THE-INTERNATIONAL-IR-FRAMEWORK-SPANISH-1.pdf
- arrow_upward International Organization for Standardization [ISO]. (2010). ISO 26000 Social Responsibility. https://www.iso.org/iso-26000-social-responsibility.html
- arrow_upward International Sustainability Standards Board [ISSB]. (2024). Climate-related Disclosures. ifrs Foundation. https://www.ifrs.org/projects/completed-projects/2023/climate-related-disclosures/
- arrow_upward Jensen, J. C., & Berg, N. (2012). Determinants of Traditional Sustainability Reporting Versus Integrated Reporting: An Institutionalist Approach. Business Strategy and the Environment, 21(5), 299-316. https://doi.org/10.1002/bse.740
- arrow_upward Laplume, A. O., Sonpar, K., & Litz, R. A. (2008). Stakeholder Theory: Reviewing a Theory That Moves Us. Journal of Management, 34(6), 1152-1189. https://doi.org/10.1177/0149206308324322
- arrow_upward Lefebvre. (2023.). La CSRD o Directiva de Reporte de Sostenibilidad Corporativa. https://lefebvre.es/esg/environmental/noticias-informes-de-sostenibilidad-la-ue-llega-a-un-acuerdo-sobre-el-csrd
- arrow_upward López, A. I., & Coelho, A. M. (2018). Engaged in integrated reporting? Evidence across multiple organizations. European Business Review, 30(4), 398-426. https://doi.org/10.1108/EBR-12-2016-0161
- arrow_upward Macias, H. A., & Farfan Lievano, A. (2017). Integrated reporting as a strategy for firm growth: Multiple case study in Colombia. Meditari Accountancy Research, 25(4), 605.628. https://doi.org/10.1108/MEDAR-11-2016-0099
- arrow_upward Masiero, L., Goffi, G., & Cucculelli, M. (2023). Corporate social responsibility and investment preferences of tour operators. Journal of Travel Research, 62(3), 574-592. https://doi.org/10.1177/00472875221120402
- arrow_upward Meyer, J. W., & Rowan, B.. (1977). Institutionalized Organizations: Formal Structure as Myth and Ceremony. American Journal of Sociology, 83(2). https://www.journals.uchicago.edu/doi/epdf/10.1086/226550
- arrow_upward Monteiro, T. A., Giuliani, A. C., Cavazos-Arroyo, & Kassouf Pizzinatto, N. (2015). Mezcla del marketing verde: Una perspectiva teórica. Cuadernos del Cimbage, (17), 103-126. http://www.redalyc.org/articulo.oa?id=46243484005
- arrow_upward Morrós Ribera, J. (2014). La materialidad en los informes de sostenibilidad: Las propuestas de GRI, IIRC y SASB. II Jornada ACCID. https://doi.org/10.13140/2.1.3487.5848
- arrow_upward Pacto Mundial Red Española. (2018). Comunicado el progreso 2018. Una visión integrada en sostenibilidad y reporting. https://www.pactomundial.org/wp-content/uploads/2019/03/Comunicando_el_progreso_2018_Una_vision_integrada_en_sostenibilidad_y_re....pdf
- arrow_upward Parlamento Europeo, y Consejo de la Unión Europea. (1995). Directiva 2014/95/UE. Unión Europea. https://www.boe.es/doue/2014/330/L00001-00009.pdf
- arrow_upward Pranckutė, R. (2021). Web of Science (WoS) and Scopus: The titans of Bibliographic Information in Today's Academic World. Publications, 9(1), 12. https://doi.org/10.3390/PUBLICATIONS9010012
- arrow_upward Rivera-Arrubla, Y. A., Zorio-Grima, A., & García-Benau, M. A. (2016). El concepto de informe integrado como innovación en reporting corporativo. Journal of Innovation & Knowledge, 1(3), 144-155. https://doi.org/10.1016/j.jik.2016.01.016
- arrow_upward Rupley, K. H., Brown, D., & Marshall, S. (2017). Evolution of corporate reporting: From stand-alone corporate social responsibility reporting to integrated reporting. Research in Accounting Regulation, 29(2), 172-176. https://doi.org/10.1016/j.racreg.2017.09.010
- arrow_upward Sierra García, L., García Benau, M. A., & Zorio, A. (2014). Credibility in Latin America of corporate social responsibility reports. RAE Revista de Administracao de Empresas, 54(1), 28-38. https://doi.org/10.1590/S0034-759020140104
- arrow_upward Sust4ain. (2021). IRC y SASB forman la Value Reporting Foundation, que proporciona un conjunto completo de herramientas para evaluar, gestionar y comunicar el valor. https://sust4in.com/iirc-y-sasb-forman-la-value-reporting-foundation-que-proporciona-un-conjunto-completo-de-herramientas-para-evaluar-gestionar-y-comunicar-el-valor/
- arrow_upward Stent, W., & Dowler, T. (2015). Early assessments of the gap between integrated reporting and current corporate reporting. Meditari Accountancy Research, 23(1), 92-117. https://doi.org/10.1108/MEDAR-02-2014-0026
- arrow_upward Value Reporting Foundation. (2024). Integrated Thinking & Strategy: State of play in global markets. https://www.valuereportingfoundation.org/
- arrow_upward Vélez Ramírez, R. A., Moneva Abadía, J. M., & Marco Fondevila, M. Á. (2024). El Reporte Integrado como instrumento comunicador de la RSE en América Latina. Contaduría Universidad de Antioquia, (84), 99-120. https://doi.org/10.17533/udea.rc.n84a05
- arrow_upward Villanueva García, J., Zorio Grima, A., & García Benau, M. A. (2015). Supervisores bursátiles, gobierno corporativo y cumplimiento de las NIIF: el caso de la CNMV. Innovar, 25(55), 89-100. https://doi.org/10.15446/innovar.v25n55.47198
- arrow_upward Weber, M. (1964). Economía y Sociedad Esbozo de sociología comprensiva. Fondo de Cultura Económica.
ANNEXES
Annex 1.
Anexo 1. Tabla de datos de entrada y salida para el modelo DEA
Economic inequality variables | Fiscal mechanism variables |
|||||||||||
Income level | Country | Year | Domestic violence: Prevalence of intimate partner violence per 10,000 inhabitants | Violence (homicides) | Gini | Pobrez | Adult literacy rate (% of people aged 15 and above) | Informality (waged workers employed, % of total employment) | GDP growth (annual %) | Revenue, excluding donations (% of GDP) | Social contributions (% of revenue) | Subsidies and other transfers (% of expense) |
High | Spain | 2010 | 1.1 | 395 | 35.2 | 0.5 | 99.71 | 16.7 | 0.2 | 27.0 | 42.0 | 78.6 |
2011 | 0.8 | 388 | 35.7 | 0.9 | 99.73 | 16.4 | -0.8 | 26.4 | 42.1 | 78.7 |
||
2012 | 0.7 | 345 | 35.4 | 0.6 | 99.7 | 17.3 | -3.0 | 27.6 | 42.6 | 78.8 |
||
2013 | 0.7 | 329 | 36.2 | 0.8 | 99.56 | 17.9 | -1.4 | 26.4 | 42.9 | 78.6 |
||
2014 | 0.7 | 298 | 36.1 | 0.5 | 99.47 | 17.6 | 1.4 | 27.2 | 43.0 | 78.5 |
||
2015 | 0.7 | 294 | 36.2 | 0.6 | 99.39 | 17.3 | 3.8 | 26.3 | 43.2 | 78.6 |
||
2016 | 0.7 | 294 | 35.8 | 0.7 | 98.79 | 16.9 | 3.0 | 26.9 | 43.1 | 79.4 |
||
2017 | 0.7 | 325 | 34.7 | 0.5 | 97.27 | 16.5 | 3.0 | 27.1 | 43.3 | 79.5 |
||
2018 | 0.8 | 275 | 34.7 | 0.6 | 98.2 | 16.0 | 2.4 | 27.9 | 42.4 | 79.3 |
||
2019 | 1.2 | 262 | 34.7 | 0.6 | 98.4 | 15.7 | 2.0 | 28.0 | 43.8 | 80.1 |
||
2020 | 0.9 | 261 | 34.7 | 0.6 | 98.7 | 15.6 | 1.1 | 28.1 | 43.8 | 80.1 |
||
High | United Kingdom | 2010 | 5.9 | 1.014 | 0.1 | 0.9 | 98.0 | 14.0 | 1.9 | 34.4 | 21.7 | 57.1 |
2011 | 5.8 | 924 | 0.3 | 0.8 | 98.1 | 14.2 | 1.5 | 34.7 | 21.4 | 57.0 |
||
2012 | 6.0 | 932 | 0.1 | 0.8 | 98.4 | 14.6 | 1.5 | 34.1 | 21.2 | 57.0 |
||
2013 | 7.4 | 908 | 0.1 | 0.8 | 99.7 | 14.6 | 2.1 | 34.9 | 20.8 | 57.0 |
||
2014 | 5.6 | 899 | 0.1 | 1.0 | 99.9 | 15.2 | 2.6 | 34.2 | 20.9 | 56.7 |
||
2015 | 7.4 | 886 | 0.1 | 0.9 | 99.9 | 15.0 | 2.4 | 34.4 | 21.2 | 57.2 |
||
2016 | 5.9 | 963 | 0.1 | 0.9 | 99.7 | 15.4 | 1.9 | 34.9 | 21.4 | 56.2 |
||
2017 | 6.2 | 973 | 0.2 | 1.0 | 99.5 | 15.4 | 1.9 | 35.4 | 21.5 | 55.1 |
||
2018 | 6.9 | 884 | 0.2 | 0.9 | 99.3 | 15.1 | 1.3 | 35.4 | 21.6 | 55.1 |
||
2019 | 7.2 | 868 | 0.2 | 0.9 | 99.4 | 15.6 | 1.5 | 35.4 | 22.6 | 54.7 |
||
2020 | 6.6 | 869 | 0.2 | 0.9 | 99.6 | 15.5 | 0.4 | 35.4 | 22.5 | 54.7 |
||
High | United States | 2010 | 17.9 | 16.912 | 40.0 | 12.6 | 93.37 | 7.04 | 2.6 | 16.5 | 39.3 | 62.7 |
2011 | 19.2 | 16.746 | 40.9 | 13 | 92.44 | 6.82 | 1.6 | 16.7 | 34.8 | 62.1 |
||
2012 | 17.4 | 17.233 | 40.9 | 14.9 | 92.79 | 6.75 | 2.2 | 16.8 | 34.4 | 62.4 |
||
2013 | 16.6 | 16.616 | 40.7 | 15.8 | 92.81 | 6.59 | 1.8 | 18.9 | 34.5 | 63.9 |
||
2014 | 19.3 | 16.277 | 41.5 | 15.8 | 93.23 | 6.45 | 2.5 | 18.9 | 34.3 | 64.5 |
||
2015 | 21.8 | 18.364 | 41.2 | 15.5 | 93.9 | 6.44 | 2.9 | 19.1 | 34.2 | 65.8 |
||
2016 | 18.7 | 20.069 | 41.1 | 15.1 | 95.07 | 6.39 | 1.6 | 18.7 | 35.0 | 65.9 |
||
2017 | 17.3 | 20.383 | 41.2 | 14.6 | 94.63 | 6.25 | 2.4 | 19.5 | 33.7 | 65.7 |
||
2018 | 16.3 | 18.902 | 41.4 | 14.1 | 94.1 | 6.28 | 2.9 | 17.5 | 37.3 | 65.0 |
||
2019 | 18.6 | 18976 | 41.4 | 14.2 | 94.2 | 6.09 | 2.2 | 17.5 | 37.5 | 64.9 |
||
2020 | 17.5 | 18975 | 41.5 | 14 | 94.3 | 6.10 | 1.2 | 17.5 | 37.5 | 64.8 |
||
High | Germany | 2010 | 4.4 | 124 | 30.2 | 0 | 94.6 | 11.6 | 4.2 | 28.0 | 55.5 | 77.9 |
2011 | 4.6 | 125 | 30.5 | 0 | 94.6 | 11.7 | 3.9 | 28.3 | 54.3 | 80.5 |
||
2012 | 5.0 | 124 | 30.9 | 0 | 94.6 | 11.6 | 0.4 | 28.6 | 54.4 | 80.6 |
||
2013 | 12.2 | 117 | 31.1 | 0 | 94.6 | 11.2 | 0.4 | 28.5 | 54.4 | 81.7 |
||
2014 | 12.6 | 114 | 30.9 | 0 | 94.6 | 11.0 | 2.2 | 28.5 | 54.4 | 82.2 |
||
2015 | 12.7 | 114 | 31.7 | 0 | 95.1 | 10.8 | 1.5 | 28.5 | 54.7 | 82.9 |
||
2016 | 24.0 | 111 | 31.9 | 0 | 95.6 | 10.4 | 2.2 | 28.4 | 55.3 | 82.9 |
||
2017 | 13.9 | 113 | 28.9 | 0 | 96.5 | 10.2 | 2.6 | 28.6 | 55.5 | 82.1 |
||
2018 | 14.1 | 113 | 28.9 | 0 | 97.2 | 9.9 | 1.3 | 29.0 | 55.4 | 82.9 |
||
2019 | 14.2 | 112 | 28.8 | 0 | 98.3 | 9.6 | 0.6 | 29.4 | 55.6 | 83.0 |
||
2020 | 14.2 | 112 | 28.8 | 0 | 99.4 | 9.6 | 0.1 | 29.4 | 55.5 | 83.1 |
||
Upper-Middle | Colombia | 2010 | 17.2 | 28.046 | 54.6 | 2.8 | 93.4 | 53.4 | 4.5 | 21.6 | 12.5 | 41.8 |
2011 | 18.1 | 26.241 | 53.5 | 2.3 | 93.6 | 53.5 | 6.9 | 23.5 | 18.0 | 34.9 |
||
2012 | 15.7 | 25.268 | 52.6 | 2.3 | 93.4 | 53.2 | 3.9 | 26.3 | 20.1 | 51.2 |
||
2013 | 14.9 | 23.994 | 52.6 | 2.2 | 93.8 | 52.3 | 5.1 | 24.5 | 13.0 | 54.7 |
||
2014 | 22.9 | 22.391 | 52.6 | 2 | 94.2 | 51.5 | 4.5 | 23.4 | 15.9 | 58.8 |
||
2015 | 18.4 | 21.100 | 51 | 1.7 | 94.2 | 51.0 | 3.0 | 24.1 | 16.4 | 59.9 |
||
2016 | 24.9 | 20.750 | 50.6 | 1.8 | 94.7 | 51.1 | 2.1 | 24.2 | 18.2 | 48.6 |
||
2017 | 18.4 | 20.189 | 49.7 | 1.6 | 94.9 | 51.1 | 1.4 | 22.6 | 7.3 | 55.3 |
||
2018 | 19.5 | 19.860 | 50.4 | 1.7 | 95.1 | 51.4 | 2.5 | 23.3 | 11.2 | 58.1 |
||
2019 | 15.1 | 19.268 | 51.3 | 1.9 | 95.1 | 49.6 | 3.3 | 24.2 | 11.5 | 60.4 |
||
2020 | 17.2 | 19.261 | 51.3 | 2 | 95.0 | 50.1 | -6.8 | 24.2 | 11.5 | 60.3 |
||
Upper-Middle | Mexico | 2010 | 14.2 | 26.162 | 47.2 | 1.6 | 93.1 | 33.4 | 5.1 | 18.0 | 11.5 | 61.4 |
2011 | 16.7 | 28.456 | 47.5 | 1.4 | 93.5 | 33.7 | 3.7 | 18.9 | 10.9 | 61.1 |
||
2012 | 14.3 | 26.582 | 48.7 | 1.2 | 94.2 | 33.0 | 3.6 | 18.7 | 11.1 | 58.2 |
||
2013 | 12.7 | 22.882 | 48.6 | 1.1 | 94.0 | 32.9 | 1.4 | 18.8 | 11.5 | 62.4 |
||
2014 | 14.1 | 20.143 | 48.7 | 1.1 | 94.6 | 32.2 | 2.8 | 18.3 | 11.8 | 63.5 |
||
2015 | 12.5 | 20.853 | 47.3 | 0.9 | 94.5 | 32.1 | 3.3 | 19.0 | 11.6 | 64.5 |
||
2016 | 11.9 | 24.794 | 46.3 | 0.6 | 94.9 | 31.7 | 2.6 | 19.8 | 10.9 | 64.3 |
||
2017 | 10.7 | 31.646 | 46.8 | 0.6 | 95.0 | 31.4 | 2.1 | 20.0 | 10.7 | 63.6 |
||
2018 | 9.5 | 30.590 | 45.4 | 0.5 | 95.4 | 31.6 | 2.2 | 18.8 | 11.5 | 64.1 |
||
2019 | 9.8 | 32.450 | 45.4 | 0.5 | 95.4 | 31.9 | -0.1 | 18.6 | 12.2 | 65.4 |
||
2020 | 9.4 | 32.440 | 45.3 | 0.5 | 95.6 | 32.0 | -8.2 | 18.6 | 12.1 | 65.3 |
||
Upper-Middle | Brazil | 2010 | 6.2 | 60.959 | 52.9 | 1.8 | 90.4 | 32.1 | 7.5 | 29.0 | 31.6 | 57.9 |
2011 | 7.2 | 60.598 | 52.9 | 1.9 | 91.4 | 31.5 | 4.0 | 29.1 | 31.9 | 57.1 |
||
2012 | 9.4 | 65.011 | 53.5 | 1.4 | 91.3 | 29.9 | 1.9 | 29.6 | 31.5 | 59.2 |
||
2013 | 12.4 | 63.943 | 52.8 | 1 | 91.5 | 30.1 | 3.0 | 28.7 | 32.3 | 59.1 |
||
2014 | 7.2 | 64.564 | 52.1 | 0.9 | 91.7 | 30.0 | 0.5 | 27.4 | 33.8 | 58.8 |
||
2015 | 6.9 | 64.859 | 51.9 | 1.1 | 92.0 | 31.3 | -3.5 | 29.3 | 31.6 | 52.1 |
||
2016 | 6.8 | 67.937 | 53.3 | 1.4 | 92.8 | 31.8 | -3.3 | 29.6 | 31.2 | 56.9 |
||
2017 | 19.3 | 68.886 | 53.3 | 1.6 | 93.1 | 32.3 | 1.3 | 27.9 | 33.8 | 59.4 |
||
2018 | 36.4 | 68.129 | 53.9 | 1.6 | 93.2 | 32.8 | 1.3 | 29.1 | 32.3 | 59.0 |
||
2019 | 56.4 | 68.779 | 53.4 | 1.7 | 93.6 | 33.1 | 1.1 | 29.7 | 31.8 | 61.7 |
||
2020 | 49.5 | 68.770 | 53.8 | 1.7 | 93.9 | 33.1 | -0.8 | 29.5 | 31.8 | 61.7 |
||
Upper-Middle | Russia | 2010 | 15.1 | 19.013 | 39.5 | 0 | 94.1 | 6.8 | 4.5 | 26.1 | 20.3 | 60.5 |
2011 | 14.3 | 17.650 | 39.7 | 0 | 95.4 | 7.0 | 4.3 | 29.1 | 19.5 | 59.8 |
||
2012 | 12.6 | 16.275 | 40.7 | 0 | 96.3 | 6.9 | 4.0 | 27.2 | 21.0 | 59.4 |
||
2013 | 14.6 | 16.048 | 40.9 | 0 | 96.2 | 7.2 | 1.8 | 26.5 | 25.2 | 61.2 |
||
2014 | 17.9 | 16.519 | 39.9 | 0 | 94.4 | 7.2 | 0.7 | 27.2 | 26.1 | 66.3 |
||
2015 | 16.3 | 16.645 | 37.7 | 0 | 95.7 | 7.2 | -2.0 | 24.5 | 21.4 | 68.9 |
||
2016 | 19.1 | 15.868 | 36.8 | 0 | 96.7 | 7.5 | 0.2 | 24.3 | 26.5 | 71.2 |
||
2017 | 24.9 | 13.316 | 37.2 | 0 | 95.1 | 6.6 | 1.8 | 24.5 | 22.9 | 70.6 |
||
2018 | 22.4 | 12.296 | 37.5 | 0 | 96.4 | 6.8 | 2.5 | 27.3 | 21.9 | 68.8 |
||
2019 | 21.4 | 11.450 | 37.4 | 0 | 98.6 | 8.2 | 1.3 | 27.4 | 22.4 | 69.0 |
||
2020 | 18.6 | 11.452 | 37.5 | 0 | 99.4 | 8.14. | 0.7 | 27.1 | 22.3 | 68.9 |
||
Lower-Middle | Nigeria | 2010 | 65.1 | 17.110 | 36.1 | 13.4 | 64.1 | 82.6 | 8.0 | 16.4 | 7.2 | 0.0 |
2011 | 66.5 | 17.229 | 36.6 | 11.9 | 63.4 | 81.1 | 5.3 | 19.0 | 7.2 | 0.0 |
||
2012 | 64.3 | 17.287 | 38.7 | 12.5 | 62.5 | 81.6 | 4.2 | 20.9 | 7.0 | 0.0 |
||
2013 | 69.4 | 17.573 | 39.4 | 12.7 | 64.1 | 81.9 | 6.7 | 24.3 | 7.5 | 0.0 |
||
2014 | 68.0 | 17.868 | 38.4 | 12.5 | 63.7 | 81.6 | 6.3 | 27.6 | 8.2 | 0.0 |
||
2015 | 64.1 | 18.026 | 36.7 | 11.6 | 63.6 | 82.3 | 2.7 | 24.4 | 8.0 | 0.0 |
||
2016 | 68.2 | 18.210 | 36.4 | 13.4 | 62.1 | 82.6 | -1.6 | 21.6 | 8.0 | 0.0 |
||
2017 | 72.1 | 18.250 | 36.4 | 12.6 | 62.5 | 81.5 | 0.8 | 24.0 | 4.2 | 0.0 |
||
2018 | 74.3 | 18.305 | 35.1 | 12.5 | 62.4 | 80.5 | 1.9 | 23.3 | 4.3 | 0.0 |
||
2019 | 78.3 | 18.407 | 35.4 | 12.4 | 62.9 | 79.9 | 2.2 | 28.9 | 4.8 | 0.0 |
||
2020 | 79.4 | 18.408 | 35.2 | 12.6 | 62.0 | 79.9 | 1.5 | 28.9 | 4.9 | 0.0 |
||
Lower-Middle | Nicaragua | 2010 | 7.5 | 858 | 47.3 | 1.4 | 81.3 | 48.8 | 4.4 | 14.7 | 0.0 | 37.1 |
2011 | 6.9 | 821 | 47.5 | 1.2 | 81.4 | 48.1 | 6.3 | 15.8 | 0.0 | 34.3 |
||
2012 | 9.2 | 767 | 47.4 | 1.3 | 80.3 | 47.3 | 6.5 | 16.4 | 0.0 | 33.7 |
||
2013 | 6.1 | 715 | 48.6 | 1.1 | 80.7 | 46.5 | 4.9 | 16.2 | 0.0 | 34.1 |
||
2014 | 7.5 | 667 | 46.2 | 0.8 | 81.2 | 45.7 | 4.8 | 16.4 | 0.0 | 32.3 |
||
2015 | 4.4 | 637 | 46.1 | 0.9 | 81.3 | 44.8 | 4.8 | 16.7 | 0.0 | 34.4 |
||
2016 | 7.1 | 607 | 46.2 | 0.8 | 81.2 | 43.9 | 4.6 | 17.4 | 0.0 | 31.8 |
||
2017 | 11.9 | 614 | 46.8 | 0.9 | 82.6 | 43.0 | 4.6 | 17.8 | 0.0 | 31.9 |
||
2018 | 12.5 | 631 | 46.2 | 1.0 | 82.4 | 42.8 | -3.9 | 16.9 | 0.0 | 32.0 |
||
2019 | 14.9 | 619 | 46.2 | 0.9 | 82.5 | 42.7 | -3.9 | 19.1 | 0.0 | 28.9 |
||
2020 | 16.2 | 620 | 46.2 | 0.8 | 82.1 | 42.6 | -5.7 | 19.2 | 0.0 | 28.9 |
||
Lower-Middle | El Salvador | 2010 | 5.0 | 4.429 | 43.5 | 1.5 | 84.5 | 41.8 | 2.1 | 22.0 | 11.6 | 22.5 |
2011 | 7.6 | 4.376 | 42.3 | 1.1 | 85.5 | 41.7 | 3.8 | 23.2 | 10.2 | 24.9 |
||
2012 | 5.6 | 3.884 | 41.8 | 1.0 | 85.4 | 41.8 | 2.8 | 22.7 | 11.2 | 24.4 |
||
2013 | 9.0 | 3.981 | 43.4 | 0.8 | 86.8 | 41.9 | 2.2 | 21.1 | 11.0 | 14.7 |
||
2014 | 7.0 | 4.657 | 41.6 | 0.7 | 87.0 | 39.6 | 1.7 | 20.6 | 11.3 | 27.7 |
||
2015 | 6.7 | 5.537 | 40.6 | 0.4 | 88.0 | 40.4 | 2.4 | 20.8 | 11.6 | 28.5 |
||
2016 | 7.0 | 5.483 | 40.0 | 0.5 | 88.1 | 40.0 | 2.5 | 23.7 | 11.2 | 21.6 |
||
2017 | 10.8 | 5.109 | 38.0 | 0.4 | 88.5 | 40.2 | 2.2 | 25.1 | 10.6 | 19.4 |
||
2018 | 14.6 | 5.345 | 38.6 | 0.3 | 89.0 | 38.8 | 2.4 | 24.9 | 9.7 | 17.7 |
||
2019 | 15.2 | 5.485 | 38.8 | 0.2 | 89.1 | 39.1 | 2.4 | 24.0 | 11.2 | 19.7 |
||
2020 | 14.1 | 5.487 | 38.8 | 0.2 | 89.1 | 39.1 | 1.1 | 24.0 | 11.2 | 19.7 |
||
Lower-Middle | India | 2010 | 21.6 | 53.464 | 36.4 | 4.8 | 69.4 | 83.3 | 8.5 | 13.2 | 0.3 | 37.0 |
2011 | 23.2 | 53.957 | 35.7 | 4.6 | 69.3 | 82.0 | 5.2 | 11.5 | 0.1 | 37.3 |
||
2012 | 22.0 | 53.904 | 35.4 | 4.7 | 69.4 | 80.7 | 5.5 | 12.6 | 0.2 | 38.8 |
||
2013 | 22.5 | 53.470 | 35.9 | 4.1 | 70.1 | 80.1 | 6.4 | 12.6 | 0.2 | 40.5 |
||
2014 | 17.6 | 53.309 | 35.8 | 3.9 | 70.6 | 79.5 | 7.4 | 11.6 | 0.1 | 37.7 |
||
2015 | 20.0 | 52.314 | 35.1 | 4.7 | 71.5 | 78.8 | 8.0 | 12.4 | 0.1 | 40.7 |
||
2016 | 23.0 | 51.532 | 35.8 | 4.2 | 72.9 | 78.1 | 8.3 | 12.9 | 0.1 | 42.7 |
||
2017 | 22.3 | 52.057 | 35.7 | 4.6 | 73.4 | 77.3 | 7.0 | 12.7 | 0.1 | 44.1 |
||
2018 | 23.1 | 51.979 | 35.6 | 4.1 | 74.6 | 76.5 | 6.1 | 13.1 | 0.1 | 44.6 |
||
2019 | 22.9 | 51.767 | 35.7 | 4.8 | 74.4 | 75.8 | 4.2 | 13.1 | 0.1 | 44.5 |
||
2020 | 23.5 | 51.766 | 35.7 | 4.9 | 74.2 | 75.5 | 2.1 | 13.1 | 0.1 | 44.5 |
||
Low | Afganistan | 2010 | 49 | 2.638 | 27.4 | 61.2 | 31.1 | 88.6 | 14.4 | 11.1 | 0.3 | 1.8 |
2011 | 29 | 2.666 | 27.3 | 61.4 | 31.4 | 87.9 | 0.4 | 11.5 | 0.3 | 2.1 |
||
2012 | 52 | 2.702 | 27.8 | 61.5 | 31.4 | 86.6 | 12.8 | 10.2 | 0.5 | 2.7 |
||
2013 | 46 | 2.783 | 27.8 | 61.7 | 31.6 | 85.7 | 5.6 | 9.4 | 0.5 | 2.9 |
||
2014 | 41 | 2.853 | 28.6 | 61.1 | 31.9 | 84.9 | 2.7 | 8.6 | 0.6 | 3.9 |
||
2015 | 49 | 3.130 | 28.4 | 61.7 | 32.4 | 84.2 | 1.5 | 10.1 | 0.6 | 4.5 |
||
2016 | 49 | 3.191 | 28.6 | 61.8 | 35.9 | 83.5 | 2.3 | 12.7 | 0.6 | 8.4 |
||
2017 | 45 | 3.031 | 28.1 | 61.3 | 38.4 | 82.5 | 2.6 | 13.0 | 0.6 | 10.5 |
||
2018 | 51 | 3.168 | 27.8 | 61 | 43.1 | 82.3 | 1.2 | 12.9 | 0.6 | 10.4 |
||
2019 | 55 | 3.217 | 28.3 | 61.3 | 43.5 | 82.2 | 3.9 | 13.1 | 0.6 | 10.5 |
||
2020 | 57 | 3.219 | 28.6 | 61.6 | 43.7 | 82.3 | 1.3 | 13.0 | 0.6 | 10.5 |
||
Low | Haiti | 2010 | 14.9 | 2.120 | 42.6 | 7.9 | 60.1 | 75.3 | -3.8 | 10.1 | 0.0 | 0.0 |
2011 | 13.9 | 2.118 | 46.1 | 8.1 | 60.7 | 74.7 | 6.2 | 10.5 | 0.0 | 0.0 |
||
2012 | 19.3 | 2.142 | 41.1 | 8.0 | 60.4 | 74.6 | 0.6 | 9.2 | 0.0 | 0.0 |
||
2013 | 17.8 | 2.173 | 42.6 | 8.1 | 61.4 | 74.3 | 3.1 | 9.4 | 0.0 | 0.0 |
||
2014 | 13.2 | 2.200 | 42.7 | 8.3 | 61.9 | 74.0 | 3.4 | 8.3 | 0.0 | 0.0 |
||
2015 | 28.0 | 2.221 | 43.1 | 8.4 | 61.4 | 73.8 | 1.6 | 9.1 | 0.0 | 0.0 |
||
2016 | 5.6 | 2.244 | 43.5 | 7.9 | 61.5 | 73.8 | 1.7 | 10.7 | 0.0 | 0.0 |
||
2017 | 8.5 | 2.265 | 43.6 | 8.1 | 61.7 | 73.7 | 2.3 | 11.0 | 0.0 | 0.0 |
||
2018 | 15.3 | 2.305 | 43.7 | 8.1 | 61.7 | 73.5 | 1.7 | 11.9 | 0.0 | 0.0 |
||
2019 | 17.8 | 2.330 | 43.6 | 8.0 | 61.7 | 73.5 | -1.7 | 11.1 | 0.0 | 0.0 |
||
2020 | 16.7 | 2.331 | 42.1 | 8.2 | 61.8 | 73.5 | -5.7 | 11.0 | 0.0 | 0.0 |
||
Low | Uganda | 2010 | 25.5 | 3.808 | 40.9 | 37.9 | 73.2 | 81.3 | 5.6 | 11.3 | 0.0 | 30.4 |
2011 | 25.0 | 4.186 | 40.8 | 38.1 | 73.1 | 80.1 | 9.4 | 11.2 | 0.0 | 30.8 |
||
2012 | 33.4 | 4.435 | 41.1 | 40.3 | 70.3 | 79.5 | 3.8 | 11.5 | 0.0 | 30.4 |
||
2013 | 30.2 | 4.605 | 41 | 40.2 | 70.4 | 79.2 | 3.6 | 11.1 | 0.0 | 29.4 |
||
2014 | 29.7 | 4.885 | 41.1 | 40.9 | 70.5 | 79.0 | 5.1 | 11.4 | 0.0 | 29.7 |
||
2015 | 29.9 | 5.041 | 41.6 | 41.2 | 70.6 | 78.6 | 5.2 | 11.6 | 0.0 | 30.6 |
||
2016 | 31.0 | 5.205 | 41.4 | 40.6 | 71.9 | 78.3 | 4.8 | 12.0 | 0.0 | 27.9 |
||
2017 | 30.2 | 5.405 | 42.8 | 40.7 | 70.8 | 78.3 | 3.8 | 12.4 | 0.0 | 28.7 |
||
2018 | 36.2 | 5.867 | 42.9 | 40.1 | 72.6 | 77.8 | 6.2 | 12.5 | 0.0 | 18.3 |
||
2019 | 38.2 | 6.175 | 42.8 | 41.3 | 76.5 | 77.3 | 6.8 | 13.2 | 0.0 | 28.9 |
||
2020 | 34.1 | 6.174 | 42.8 | 41.6 | 76.2 | 77.3 | 4.1 | 13.2 | 0.0 | 28.6 |
||
Low | Madagascar | 2010 | 24.3 | 1.718 | 42.4 | 71.7 | 70.6 | 90.7 | 0.6 | 10.6 | 6.6 | 26.5 |
2011 | 21.2 | 1.727 | 42.3 | 70.7 | 70.4 | 89.9 | 1.6 | 9.7 | 7.1 | 30.7 |
||
2012 | 26.1 | 1.700 | 42.6 | 70.7 | 71.6 | 89.0 | 3.0 | 9.2 | 3.1 | 32.7 |
||
2013 | 23.4 | 1.715 | 42.6 | 70.2 | 72.4 | 89.2 | 2.3 | 9.5 | 4.3 | 36.5 |
||
2014 | 21.9 | 1.744 | 42.8 | 70.6 | 72.1 | 89.2 | 3.3 | 9.3 | 3.9 | 36.2 |
||
2015 | 20.1 | 1.731 | 42.7 | 70.1 | 73.6 | 89.4 | 3.1 | 9.8 | 3.8 | 34.4 |
||
2016 | 17.5 | 1.739 | 42.9 | 70.5 | 73.8 | 89.2 | 4.0 | 10.1 | 2.8 | 32.3 |
||
2017 | 16.8 | 1.761 | 42.5 | 70.7 | 73.4 | 89.0 | 3.9 | 10.9 | 3.0 | 40.2 |
||
2018 | 17.5 | 1.761 | 42.4 | 70.7 | 74.2 | 88.2 | 4.6 | 11.4 | 5.0 | 30.5 |
||
2019 | 18.4 | 1.749 | 42.1 | 70.7 | 74.8 | 87.8 | 4.9 | 11.6 | 4.1 | 37.1 |
||
2020 | 14.8 | 1748 | 42.8 | 70.7 | 74.8 | 87.1 | 1.7 | 11.6 | 4.2 | 37.1 |
||
Annex 2. RStudio code for the development of the Data Envelopment Analysis
> View(Datos1)
> summary(Datos1)
> describe(Datos1)
> describe(Datos1$VioFam)
> describe(Datos1$Homic)|
> describe(Datos1$Gini)
> describe(Datos1$Pobrez)
> describe(Datos1$Alfabet)
> describe(Datos1$PIB)
> describe(Datos1$Recaud)
> describe(Datos1$Contribuc)
> describe(Datos1$Transf)
> class(Datos1)
> str(Datos1)
> x<- with(Datos1. cbind(VioFam. Homic. Gini. Pobrez. Alfabet))
> y<-matrix(Datos1$Transf)
> y<-matrix(Datos1$PIB)
> y<-matrix(Datos1$Informal)
> y<-matrix(Datos1$Recaud)
> y<-matrix(Datos1$Contribuc)
> bcc<- dea(x.y. RTS = "vrs". ORIENTATION = "in")
> bcc
> shapiro.test(bcc$eff)
> eff(bcc)
> data.frame(bcc$eff)
> summary(bcc)
> sl<- slack(x.y. bcc)
> data.frame(eff(bcc). eff(sl).sl$slack. sl$sx. sl$sy. lambda(sl))
> dea.plot(x.y. RTS = "vrs". ORIENTATION = "in-out")
> bccb<- dea.boot(x.y. NREP = 3000. RTS = "vrs". ORIENTATION = "in". alpha = 0.05)
> bccb
> superbcc <- sdea(x.y. RTS = "vrs". ORIENTATION = "in")
> superbcc
> print(peers(superbcc. NAMES = TRUE). quote = FALSE)
> excess(bcc. x)
> ccr<- dea(x.y. RTS = "crs". ORIENTATION = "in")
> ccr
> shapiro.test(ccr$eff)
> dea.plot(x.y. RTS = "crs". ORIENTATION = "in-out". add = TRUE. lty="dashed")
> superccr <- sdea(x.y. RTS = "crs". ORIENTATION = "in")
> superccr
> rint(peers(superccr.NAMES = TRUE).quote = FALSE)

 Google