Determination of Uncertainty in Measuring Instruments in Electrical Engineering Programs
Determinación de la incertidumbre en instrumentos en programas de ingeniería eléctrica
Received: July 26, 2019
Accepted: September 02, 2019
Abstract
When electrical engineering students start their instrumentation and measurement course, they have previously taken calculus, physics, probability, and statistics. However, they have problems to apply the knowledge they acquired to solve problems related to electrical measurements and variables in the profession, such as water flows, solar radiation, wind speed and water levels. This paper shows how to integrate all the concepts involved in the process to calculate measurement uncertainty in order to improve the way the results of measurements and/or error determination processes are described. For that purpose, this study presents an applied exercise and a methodological process by means of an example, where the value of a resistance is determined taking into account the data of voltage and current measurements and using few data. The objective is to focus the process on estimating Type A and Type B uncertainty and the factors that affect the measurement processes, such as uncertainty due to random variations of the measured signals, instrument defects, imprecision of the instruments, or their resolution. During the calculation of uncertainty proposed here, students use the probabilistic knowledge they have acquired after they determined the value of the uncertainty U from the combined uncertainty u𝑐 `(R)`, where the coverage factor is taken into account. This allows us to learn about the importance of expressing the results with higher (+) or lower (-) values of uncertainty. In the exercise carried out in this work, `R = 733.31 +/- 8.10 ohm`.
Keywords: Measurement Uncertainty, Measurement Errors, Engineering Education, Electric Variables, Design Methodology.
Resumen
Cuando los alumnos de Ingeniería Eléctrica inician el curso de Instrumentación y medidas, han visto previamente los cursos de Cálculo, Física, Probabilidad y Estadística; sin embargo, tienen problemas para aplicar los conocimientos adquiridos en la solución de problemas relacionados con mediciones, no solo eléctricas sino de las variables que tienen que ver con el ejercicio de la profesión como lo son: caudales de agua, radiación solar, velocidad del viento y niveles de agua. El artículo muestra cómo integrar todos los conceptos mencionados en el proceso de determinación de la incertidumbre en medidas, con el fin de mejorar la forma como se describen los resultados de los procesos de medición y/o determinación de errores. Con este propósito, se muestra el proceso metodológico descrito mediante un ejemplo para determinar el valor de una resistencia, teniendo en cuenta los datos de las medidas de voltaje y corriente, utilizando pocos datos. El objetivo es conocer la incertidumbre Tipo A, Tipo B y los factores que afectan los procesos de medida debida a: incertidumbre por variaciones aleatorias de las señales medidas, incertidumbre por defectos de los instrumentos, incertidumbre por imprecisión de los instrumentos e incertidumbre por resolución de los mismos. Durante el cálculo de la incertidumbre, el estudiante usa el conocimiento probabilístico adquirido después de determinar el valor de la incertidumbre U, a partir de la incertidumbre combinada u𝑐 `(R)`, donde se tiene en cuenta el factor de cobertura. Esto permite aprender la importancia de expresar los resultados con valores superiores (+) o inferiores (-) de incertidumbre. Para el caso del ejercicio desarrollado: `R = 733,31 +/- 8,10 ohm`.
Palabras clave: Incertidumbre en medición, errores de medición, educación en ingeniería, variables eléctricas, diseño metodológico.
1. INTRODUCTION
When learning methodologies are discussed, the conditions that individuals have to produce changes in their mental patterns and representations are part of the conversation because they allow the evolution of preexisting knowledge through learning material, interactions, or discovery. However, learning is a personal experience in the thinking and acting process [
Currently, most devices people use measure a significant number of variables and can be controlled by the so-called Internet of Things (IoT) [
Therefore, the accuracy of data acquisition such variables should be studied in the classrooms of the universities where engineering programs are taught. Actually, most students take measurements without caring about the precision of the uncertainty. For that reason, methodologies that lead students to adopt appropriate measurement practices should be found due to the importance of measurement accuracy. In the process of training engineers, in some of their courses, it is necessary to take measurements; for that reason, it is important to precisely define the concepts and procedures to reduce the error as much as possible and be certain about the reliability of the measurement. Taking this into account, the following question arises: ¿What could be an appropriate methodology, for university courses of electrical engineering, to make measurements taking into account uncertainty factors?
Such methodology should include multiple concepts: uncertainty, absolute error, dispersion measurements, fundamental statistical concepts, and clear theoretical components that are required for taking measurements. Regarding uncertainty, it is essential to know how to express its types, which are present in the process of taking measurements, and the process to calculate it.
Many types of instruments can be used in measurement tests, and multiple data collection alternatives are available; nevertheless, it is essential to look for the highest possible precision and accuracy. Importantly, the criteria used to carry out selecting instruments and data collection methods is based on experience, knowledge, processes, and appropriate calculations, but, above all, on following the methodology taught in class, because on it depends the calculation of appropriate measures according to particular objectives and with minimum error levels.
This paper describes a teaching process for engineering students that is followed to determine the value of a resistance based on measurements and uncertainties of voltage and current measurements. Section 2 is a literature review of the main theoretical concepts included in the development of the methodology. Section 3 explains and justifies the methodological process carried out by the teacher. Section 4 introduces the implementation and the results obtained from an exercise completed by students.
2. THEORETICAL FRAMEWORK
If appropriate classroom strategies for common goals are used, students develop interpersonal strategies and higher levels of thinking knowledge [
Active learning, a student-centered approach directly focused on the process, is being promoted because it has been shown to address significant activities and critical thinking, thus developing skills such as teamwork, problem solving, and analysis [
In activities involving electrical devices and measuring equipment, it is difficult to identify and evaluate the incompleteness of the results accurately and efficiently. There are techniques, such as problem probability density functions, to estimate measurement uncertainty [
To calculate measurement uncertainty as proposed in this work, engineering students must clearly understand the following concepts related to different types of measurements that will be carried out.
2.1 Voltage Measurements
For controlling the operating conditions of the elements that compose an electrical system, it is necessary to monitor variables such as voltage [
2.2 Current Measurements
Intensity, in mathematical terms, is defined, for electric current `i`, as the variation of load `q` in a time interval `t`. Electric current is calculated in amperes [
2.3 Resistance Measurements
Electrical resistance is the opposition of electrical conductors to the electric current, that is, their opposition to moving electrons [
2.4 Statistical Measures of Interest
In engineering, the correct use of statistics must be understood as a tool to analyze variables. A data set can have many observations and statistics is used to summarize this numerical information and infer properties about a population [
2.4.1 Arithmetic Mean
For energy devices to be reliable, careful calculations must be carried out in order to ensure that their electrical parameters and other characteristics are optimal [
`x= 1/n ∑x_i ` (1)
2.4.2 Variance
Variance measures the dispersion of the data around the mean. If it is low, the values of the set are mainly grouped; if it is high, the elements are scattered [
`σ^2= (∑_(i=1)^n(x_i-x)^2 )/N` (2)
2.4.3 Standard Deviation
Standard deviation, the most common dispersion measure, indicates how scattered the data are with respect to the mean; the higher the standard deviation, the greater the dispersion of the data [
`σ= √((∑_(i=1)^n(x_i-x)^2)/N)` (3)
2.5 Measurement Errors
The supervision and real-time operation of electrical energy systems require precise measurements [
ΕAbs = AverValueMeasures- Real val (3)
The error value is important and provides a general idea of the accuracy of the instrument being used to perform the measurement. However, to improve the expression that characterizes the error, it must be accompanied by the uncertainty, which is calculate based on the Guide to the expression of Uncertainty in Measurement (GUM). The latter provides a method to evaluate the uncertainty based on the law of propagation of uncertainty and the characterization of the output by a Gaussian distribution [
`Ε= E_Abs+/-U_x` (5)
Where, `U_x` denotes the composite uncertainty of that measure.
2.6 Uncertainty Expression
The word “uncertainty” means doubt, and “measurement uncertainty” means doubt about the validity of the result of a measurement. The ideal method to evaluate and express the uncertainty of the result of a measurement must be [
Most common types of uncertainty in the literature:
-Uncertainty: The parameter associated with the result of a measurement, which characterizes the dispersion of the values. It is evaluated as follows: typical uncertainty, Type A evaluation, Type B evaluation, and combined typical uncertainty.
-Expanded uncertainty: The interval around the result of a measurement, and in which a significant fraction of the distribution of values that could reasonably be attributed to the measurement is expected to be found [
3. METHODOLOGY
The methodology for calculating the uncertainty of a measurement that was taught and followed by engineering students in this work is summarized in eight steps (Fig. 1). The teaching strategy adopted in this study is project-based learning because it draws on the benefits of problem-based learning and allows students to follow a detailed methodology where they learn about the two most commonly used types of uncertainty: (1) Type A and how it must be determined based on the measurements obtained during the experiment; and (2) Type B, which specially refers to patterns of uncertainty of the instruments, which are normally provided by the manufacturer.
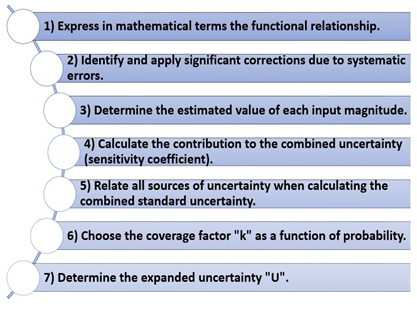
The first step is to express, in mathematical terms, the dependence of the magnitude of output with respect to the input. Then, significant corrections due to systematic errors are identified and applied. The estimated value of each input variable is determined with statistical analysis, calculating, for each input variable, the contribution to the combined uncertainty and observing whether there is a correlation between the random variables. Next, a coverage factor `k` is selected as a function of the probability to determine the expanded uncertainty U. Finally, the result of the measurement is expressed, indicating the estimated output, the associated expanded uncertainty, the coverage factor, and the type of assumed distribution.
4. RESULT TO DETERMINE THE ERROR AND UNCERTAINTY
To measure resistance, engineering students usually employ a precision multimeter or a Wheatstone bridge, which is an electrical circuit used to measure unknown resistances [
Fig. 2 shows the assembly suggested to students, which includes DC power supply, ammeter, voltmeter, and resistance, whose value must be determined.
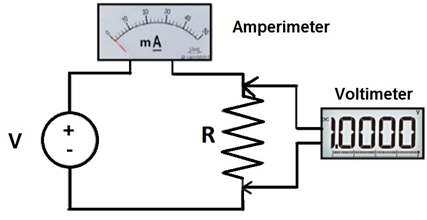
The lab instruments used in this exercise have the following characteristics: Voltmeter: 4 ½ digits; range, 0 – 200 V; data supplied by the manufacturer in relation to the error, ± 0.2 % of the reading + 1 digit; and internal resistance, 20 mΩ. Ammeter: Class 1 analogue instrument; range, 200 mA; αmax 200 divisions; and internal resistance, (Ra) = 50 mΩ.
With these instruments, three initial measurements were taken; they are shown in Table 1:
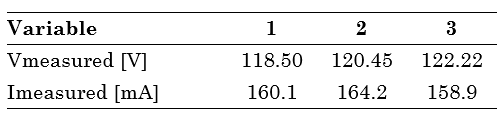
Students seek to determine the value of `R` with a probability of 99 %, taking into account relevant aspects so that the value is as accurate as possible, and the expanded uncertainty assuming an expansion factor `K=2`.
4.1 Representation of the function domain problem
This is one of the most important aspects in the process of training of engineers: developing students’ skills to associate variables of the real world with a mathematical expression that relates and represents them. At this point students are prepared to represent the objective function with the external variables that affect the magnitude determination of the target problem, based on the overall functions (6) and (7).
The function that should be analyzed is related to the calculation of the value of Resistance R from the measured variables Voltage `V` and Current `I`. The measured voltage includes the voltage drop in the ammeter due to the internal resistance of the same (`R_a`), which should be subtracted to determine the exact value on the resistance. Then, the net voltage on the resistance R will be (8).
`Y=f(X_1,X_2,…,X_N )=R` (6)
`R=f(Vmeasured,Imeasured)` (7)
`V_r=V-(IR_a ) R=(Vr-IR_a)/I` (8)
4.2 Sources of Uncertainty
In this methodology students should analyze and determine uncertainties produced by the following factors: random variations in the measured voltage, random variations in the measured current, operating malfunction of the voltmeter, ammeter malfunction, finite resolution of the voltmeter, difficulty to read the ammeter, and combined uncertainty.
4.3 Uncertainty due to random variations in the measured voltage
To determine the average voltage of the measurements should be calculated, as shown in (9). The experimental standard deviation of the measured voltage is expressed in (10).
`V_average=1/3 ∑_(i=1)^3(V_i ) =120,39 V` (9)
`S_((V measured) )=√(1/(3-1) ∑_(i=1)^3(V_measured(i) -V_average )^2 ) S_((V measured) )=1.8604 V` (10)
If the measurements include less than 10 samples, the t-student distribution is used, with the degrees of freedom for samples n, (in this case `n=3` and a 68.27 % probability), to ensure that the range has up to one standard deviation; for that purpose, factor t [
`U_((V measured) )≅t S_((V measured) )/√n=1.32* (1.8604 V)/√3 U_((V measured))=1.4178 V` (11)
4.4 Uncertainty by random variations in the measured current
This type of uncertainty is evaluated as Type A uncertainty; therefore, it is necessary to calculate the average and the standard deviation as in, (12), (13) and (14).
`I_average=1/3 ∑_(i=1)^3(I_i ) `
`I_average=163.63 mA=0.16363 A ` (12)
`S_((I measured) ) √(1/(3-1) ∑_(i=1)^3(I_measure(i) -I_aver )^2 )=3.28 mA` (13)
`U_((I measured) )≅t S_((I measured) )/√n=1.32*(3.2868 mA)/√3=2.5248 mA =0.00252A` (14)
4.4 Uncertainty by random variations in the measured current
This type of uncertainty is evaluated as Type A uncertainty; therefore, it is necessary to calculate the average and the standard deviation as in, (12), (13) and (14).
4.5 Uncertainty due to malfunction of the voltmeter
In this case, professors explain to students that uncertainty due to malfunction of the voltmeter, because it is a digital device, is directly related to the error that the manufacturer specifies, that is to say, the “Accuracy Class” of the instrument (15).
`Error_( voltmeter operation)=±(0.20% rea+1 dig)`
`Error_(voltmeter operation)=(0.2/100*120,39 V+0.01) =0.25078 V` (15)
Uncertainty due to the incorrect operation of the voltmeter is given by the norm as a rectangular distribution (16).
`U_((voltmeter operation) )=a/√3 U_((voltmeter operation))=(0.25078 V)/√3 =0.14478 V` (16)
4.6 Uncertainty due to ammeter malfunction
Analogously, the uncertainty, in the case of the current measurement made with the analogue ammeter, is related to the error in the readings provided by the manufacturer, which is called “Class” and a rectangular probability distribution, (17) and (18):
`Error_(ammeter reading)=±(Class*Scope)/(α max)`
`Error_(ammeter reading)=1 mA` (17)
`u_((func ammet))=a/√3 =0.5773 mA=0.0005773A` (18)
4.7 Uncertainty caused by the finite resolution of the voltmeter
The instrument is 4 ½ digits; therefore, it must be taken into account that the reading would have five digits, the first of which would be number 1. The maximum readingis 19999 on the scale of 200 volts, and the maximum measurement is 199.99; hence, its resolution is 0.01 V. By the the Guide to the expression of Uncertainty in Measurement (GUM), uncertainty is associated with the rectangular distribution (19):
`U_((voltmeter resolution))=a/√3 =0.00288 V` (19)
4.8 Uncertainty due to difficulty to read the ammeter
As it is a class 1 instrument, its reading uncertainty is ¼ of division, which is the minimum acceptable variation (20) y (21). This type of uncertainty is associated to the rectangular distribution taking into account the uncertainty rules.
`I_( Minimal Appreciable Variation)=1/4 div*Scope/(α max) =0.25 mA` (20)
`U_((difficulty lect amp))=a/√3=0.1443 mA=0.00014A` (21)
4.9 Correlation Determination
Starting from the simple observation of the circuit, one may determine that there is a correlation because there is variation in the supply voltage V, which leads to a change in the current `` of the circuit that is circulating through resistance R. The objective is that the student notices the direct relationship between the physical phenomena, the concept, and the mathematical representation Conceptually, the correlation is mathematically [
`r(X_i,X_j )=(covariance (X_i X_j))/√(variance X_i variance X_j )` (22)
The covariance associated with the estimates of two input magnitudes `X_i` and `X_j` may be considered equal to cero or negligible when the input magnitudes `X_i` and `X_j` are independent, one of them is constant, or there is not enough information to evaluate it. In order to evaluate the (22), students are instructed to use few measurement values so that they complete the process manually, without help from a computer, and understand the operation they are performing (23).
For this problem, it will be necessary to determine the correlation between the average `Voltage = V_measured` and average `Current =I_measured`. We should take into account that the product of the two standard deviations (24), can also be seen in (23).
`r(X_i,X_j )=(1/(3-1) ∑_(k=1)^3(X_((ik) )-X_(i average))(X_((jk) )-X_(j average)))/(S_(Xi _measured ) *S_(Xj _measured ) )` (23)
`(V_measured,I_measured )=(1/(3-1) ∑_(i=1)^3(V_measured(i) -V_average)(I_measured(i) -I_average))/(S_(V_measured )*S_(I_measured ) )` (24)
This means that the two variables are strongly and positively correlated.
4.10 Combined Uncertainty
The measurements evaluated in this study are correlated because a variation in the voltage led to a linear change in the current passing through the resistance, and this is demonstrated with the calculation of the correlation coefficient (25). The objective function for this problem is:
`R=(Vaverage-Iaverage(R_a))/(I average) =733.31 ohm` (25)
It is important to take into account that, to obtain this expression and facilitate its derivation, `R_a` must be assumed as a small value, which is why the term is negligible (26).
`C_v=∂R/∂V=1/I_average = 1/(163.63*10^(-3) A)= 0,1227 A^(-1)` (26)
`C_i=∂R/∂I=-Vaverage/I_average^2 = (120.39 V)/(0.16363^2 A) = 4496.39 V/A^2`
After these values are obtained, the uncertainty for correlated variables is calculated solving the derivatives as (27).
`U_c (R)^2= (1/I_average )^2 (U_((Vmeasure) )^2+U_((func volt) )^2+U_((resol volt) )^2 )` (27)
`+(-V_average/I_average^2 )^2 (U_((Imeasure) )^2+U_((func amp) )^2+U_((dific lect amp) )^2 )`
`+ 2(1/I_average ) (-V_average/I_average^2 )(U_((Vmeasure)) *U_((Imeasure)*) r(V_measure,I_measure ))`
After the (27) is evaluated with each of the terms, it is possible to obtain the value of the combined uncertainty, which is (28).
`U_c (R)^2=75.85 + 135.52 + (-194.89)` (28)
`U_c (R)^2= 16.48 ohm`
`U_c (R)= 4.05 ohm`
As the problem requires an expansion with a coverage factor `k=2`, it is obtained from (29).
𝑈 = u𝑐`(R)` = 2. u𝑐`(R)` = 2*4.05 ohm=8.10 ohm (29)
Thus, the final `R` value determined with this method is (30):
`R=733,31 +/- 8,10 ohm` (30)
5. DISCUSSIONS
With the exercise previously described, engineering students learn how to model a real-life problem through mathematical expressions that represent functions related to different variables (see (8)). Using this methodology, students will understand the importance of taking accurate measurements through the incorporation of uncertainty factors. To obtain this (25), students need to relate variables that are obtained as measurements (current and voltage) in order to determine the value of the resistance `(R)`. The ation, by itself, gives an approximate value of `R` in ohms, but to obtain a more realistic value, uncertainty U(Vmeasured,Imeasured) must be incorporated. Such uncertainty depends on two correlated variables, as demonstrated after the correlation coefficient is calculated. In order to evaluate the equations, students should use few measurement values so that they complete the process manually, without help from a computer, and understand the operation.
A basic and elementary circuit was selected in order to focus this study the process on the methodology, the application of statistics, probability, differential calculation, and the conceptual side of uncertainty rather than the complex equations that may arise in a capacitive or inductive circuit.
Students can thus learn about the two most commonly used types of uncertainty: (1) Type A, how it must be determined based on the measurements obtained during the experiment; and (2) Type B, which especially refers to the patterns of uncertainty of the instruments, which is normally provided by the manufacturer. The implementation of this type of methodology, which makes learning methods more accurate, has a direct impact on students’ performance and the knowledge they obtain due to the precision and extra work they carry out.
6. CONCLUSIONS
Unlike the engineering teaching processes analyzed in the state of the art, the proposed methodology allows students to interact with the devices and understand, with mathematical calculations, the importance of applying statistics to solve real problems such as measurement uncertainty.
After the correlation coefficient is determined `r(V_measured,I_measured )=0,99257476` and a result close to (1) positive is observed, students learn and prove that there is correlation in the practice circuit: the voltage variation leads to a proportional current variation. In this case, that could be an indicator to determine the value of the combined uncertainty, which complicates the mathematical calculation to determine that value (see (27)).
Four fundamental sources of uncertainty were taken into account for each of the variables: random variations of the measured signals, instrument defects, instrument imprecision, and instrument resolution. Even if more uncertainty factors may be taken into account, students learn that they must consider possible uncertainty factors in their professional life.
During the calculation of the uncertainty, students use the probabilistic knowledge they acquired after they determined the value of the uncertainty U from the combined uncertainty u𝑐 `(R)`, where the coverage factor is taken into account. This allows us to learn the importance of expressing the results with higher (+) or lower (-) values of uncertainty. In the case of the exercise carried out in this work, R = 733.31 +/ 8.10 ohm.
7. ACKNOWLEDGMENTS
The authors would like to thank Universidad Distrital Francisco José de Caldas and the research group GESETIC, who made this study possible.
8. REFERENCES
- arrow_upward [1] G. López and S. Acuña, "Aprendizaje cooperativo en el aula," Inventio, vol. 7, no. 14, pp. 29–38, Apr. 2011
- arrow_upward [2] R. R. Yager and J. P. Espada, "New Advances in the Internet of Things," 1st ed., Jordán, Ed. Springer International Publishing, 2018.
- arrow_upward [3] E. J. Hernández-Leal, N. D. Duque-Méndez, and J. Moreno-Cadavid, "Big Data: una exploración de investigaciones, tecnologías y casos de aplicación," TecnoLógicas, vol. 20, no. 39, pp. 15–38, May. 2017. https://doi.org/10.22430/22565337.685
- arrow_upward [4] J. Botero Valencia, L. Castaño Londoño, and D. Marquez Viloria, "Trends in the Internet of Things," TecnoLógicas, vol. 22, no. 44, pp. 1–2, Jan. 2019. https://doi.org/10.22430/22565337.1241
- arrow_upward [5] O. Revelo-Sánchez, C. A. Collazos-Ordóñez, and J. A. Jiménez-Toledo, "El trabajo colaborativo como estrategia didáctica para la enseñanza/aprendizaje de la programación: una revisión sistemática de literatura," TecnoLógicas, vol. 21, no. 41, pp. 115–134. Jan. 2018. https://doi.org/10.22430/22565337.731
- arrow_upward [6] J. I. Cocunubo-Suárez, J. A. Parra-Valencia, and J. E. Otálora-Luna, "Propuesta para la evaluación de Entornos Virtuales de Enseñanza Aprendizaje con base en estándares de Usabilidad," TecnoLógicas, vol. 21, no. 41, pp. 135–147. Jan. 2018. https://doi.org/10.22430/22565337.732
- arrow_upward [7] M. Hernández-de-Menéndez, A. Vallejo Guevara, J. C. Tudón Martínez, D. Hernández Alcántara, and R. Morales-Menendez, "Active learning in engineering education. A review of fundamentals, best practices and experiences," Int. J. Interact. Des. Manuf., vol. 13, no. 3, pp. 909–922, Sep. 2019. https://doi.org/10.1007/s12008-019-00557-8
- arrow_upward [8] A. M. Ruiz-Ortega, J. J. Gallardo-Rodríguez, E. Navarro-López, and M. del C. Cerón-García, "Project-led-education experience as a partial strategy in first years of engineering courses," Educ. Chem. Eng., vol. 29, pp. 1–8, Oct. 2019. https://doi.org/10.1016/j.ece.2019.05.004
- arrow_upward [9] X. Xie, X. Li, D. Bi, Q. Zhou, S. Xie, and Y. Xie, "Measurement Uncertainty Estimation for Electromagnetism Devices and Equipment Using Extreme Fisher Information," IEEE Trans. Appl. Supercond., vol. 26, no. 7, pp. 1–5, Oct. 2016. https://doi.org/10.1109/TASC.2016.2610723
- arrow_upward [10] J. J. Cárdenas-Monsalve, A. F. Ramírez-Barrera, and E. Delgado-Trejos, "Evaluación y aplicación de la incertidumbre de medición en la determinación de las emisiones de fuentes fijas: una revisión," TecnoLógicas, vol. 21, no. 42, pp. 231–244, May. 2018. https://doi.org/10.22430/22565337.790
- arrow_upward [11] H. A. Canseco, I. López, J. C. Olivares Galván, J. Jiménez, F. González and R. Escarela Pérez "Diseño y construcción de un prototipo de adquisición de datos para diagnosticar fallas de cortocircuito en transformadores," Pist. Educ., no. 38, vol. 120, pp. 598–615, Oct. 2016.
- arrow_upward [12] C. G. López Calvachi, "Diseño e implementación de un prototipo de medición de consumo eléctrico inalámbrico para artículos del hogar monitoreado mediante una página web", Tesis pregrado, Facultad de ingeniería y ciencias aplicadas, Universidad de las Américas, Quito, 2018. [En línea] Disponible en: http://dspace.udla.edu.ec/handle/33000/8978
- arrow_upward [13] A. I. V. Fernández, J. T. D. las Muelas, L. A. Toribio, M. S. Pérez, R. M. Andrade, and S. S. Sánchez, Fundamentos básicos de la electricidad y magnetismo, 1st ed. Universidad Autónoma San Francisco, 2009.
- arrow_upward [14] I. Kestin, "Statistics in medicine," Anaesth. Intensive Care Med., vol. 13, no. 4, pp. 181–188. Apr. 2012. https://doi.org/10.1016/j.mpaic.2012.01.006.
- arrow_upward [15] M. S. Muthuvalu, V. S. Asirvadam, and G. Mashadov, "Performance analysis of Arithmetic Mean method in determining peak junction temperature of semiconductor device," Ain Shams Eng. J., vol. 6, no. 4, pp. 1203–1210. Dec. 2015. https://doi.org/10.1016/j.asej.2015.04.007
- arrow_upward [16] A. Rodríguez Rodríguez, R. J. Lima Pisco, M. A. Padilla Orlando, T. Y. Garcia Ponce, R. Y. Vera Loor, and J. C. Pino Tarragó, La estadística: gnosis del ser humano. Editorial Científica 3Ciencias, 2018. https://doi.org/10.17993/CcyLl.2018.14
- arrow_upward [17] M. E. Gamboa, "Estadística aplicada a la investigación educativa," Rev. Dilemas Contemp. Educ. Política y Valores, vol. 2, no. 2, pp. 1–32, Oct. 2018.
- arrow_upward [18] B. E. B. Carvalho and N. G. Bretas, "Gross error processing in state estimation: Comparing the residual and the error tests," in 2017 IEEE Manchester PowerTech, Manchester, 2017, pp. 1–5. https://doi.org/10.1109/PTC.2017.7980921
- arrow_upward [19] V. Witkovsky, G. Wimmer, Z. Durisova, S. Duris, and R. Palencar, "Brief overview of methods for measurement uncertainty analysis: GUM uncertainty framework, Monte Carlo method, characteristic function approach," in 2017 11th International Conference on Measurement, Smolenice, 2017, pp. 35–38. https://doi.org/10.23919/MEASUREMENT.2017.7983530
- arrow_upward [20] O. A. de Acreditación, Estadistica Procedimientos para la evaluación de la incertidumbre de la medición, 1st ed. Irma, 2018. http://materias.fi.uba.ar/6644/info/varios/errores/IRAM%2035050%202001.pdf
- arrow_upward [21] W. A. Schmid and R. J. L. Martínez, Guía para la expresión de la incertidumbre de la medición, 1st ed. Centro Nacional de Metrología, 2000.
- arrow_upward [22] E. Alnasser, "A Novel Fully Analog Null Instrument for Resistive Wheatstone Bridge With a Single Resistive Sensor," IEEE Sens. J., vol. 18, no. 2, pp. 635–640, Jan. 2018. https://doi.org/10.1109/JSEN.2017.2777010
- arrow_upward [23] Joint Committee for Guides in Metrology (JCGM), "Evaluation of measurement data — Guide to the expression of uncertainty in measurement", Guides to the expression of uncertainty in measurement, 2008. https://www.bipm.org/utils/common/documents/jcgm/JCGM_100_2008_E.pdf
- arrow_upward [24] I. P. Pokrajac, D. Vucic, and P. Okiljevic, "Direct position determination of wideband signals: Coherent and noncoherent approach," in 2013 11th International Conference on Telecommunications in Modern Satellite, Cable and Broadcasting Services (TELSIKS), Servia, 2013, pp. 77–80. https://doi.org/10.1109/TELSKS.2013.6704897