Multi-modal RGB-D Image Segmentation from Appearance and Geometric Depth Maps
Segmentación multi-modal de imágenes RGB-D a partir de mapas de apariencia y de profundidad geométrica
Received: 15 Noviembre 2019
Accepted: 15 Abril 2020
Abstract
Classical image segmentation algorithms exploit the detection of similarities and discontinuities of different visual cues to define and differentiate multiple regions of interest in images. However, due to the high variability and uncertainty of image data, producing accurate results is difficult. In other words, segmentation based just on color is often insufficient for a large percentage of real-life scenes. This work presents a novel multi-modal segmentation strategy that integrates depth and appearance cues from RGB-D images by building a hierarchical region-based representation, i.e., a multi-modal segmentation tree (MM-tree). For this purpose, RGB-D image pairs are represented in a complementary fashion by different segmentation maps. Based on color images, a color segmentation tree (C-tree) is created to obtain segmented and over-segmented maps. From depth images, two independent segmentation maps are derived by computing planar and 3D edge primitives. Then, an iterative region merging process can be used to locally group the previously obtained maps into the MM-tree. Finally, the top emerging MM-tree level coherently integrates the available information from depth and appearance maps. The experiments were conducted using the NYU-Depth V2 RGB-D dataset, which demonstrated the competitive results of our strategy compared to state-of-the-art segmentation methods. Specifically, using test images, our method reached average scores of 0.56 in Segmentation Covering and 2.13 in Variation of Information.
Keywords: Image segmentation, over-segmentation, RGB-D images, depth information, multi-modal segmentation.
Resumen
Los algoritmos clásicos de segmentación de imágenes explotan la detección de similitudes y discontinuidades en diferentes señales visuales, para definir regiones de interés en imágenes. Sin embargo, debido a la alta variabilidad e incertidumbre en los datos de imagen, se dificulta generar resultados acertados. En otras palabras, la segmentación basada solo en color a menudo no es suficiente para un gran porcentaje de escenas reales. Este trabajo presenta una nueva estrategia de segmentación multi-modal que integra señales de profundidad y apariencia desde imágenes RGB-D, por medio de una representación jerárquica basada en regiones, es decir, un árbol de segmentación multi-modal (MM-tree). Para ello, la imagen RGB-D es descrita de manera complementaria por diferentes mapas de segmentación. A partir de la imagen de color, se implementa un árbol de segmentación de color (C-tree) para obtener mapas de segmentación y sobre-segmentación. Desde de la imagen de profundidad, se derivan dos mapas de segmentación independientes, los cuales se basan en el cálculo de primitivas de planos y de bordes 3D. Seguidamente, un proceso de fusión jerárquico de regiones permite agrupar de manera local los mapas obtenidos anteriormente en el MM-tree. Por último, el nivel superior emergente del MM-tree integra coherentemente la información disponible en los mapas de profundidad y apariencia. Los experimentos se realizaron con el conjunto de imágenes RGB-D del NYU-Depth V2, evidenciando resultados competitivos, con respecto a los métodos de segmentación del estado del arte. Específicamente, en las imágenes de prueba, se obtuvieron puntajes promedio de 0.56 en la medida de Segmentation Covering y 2.13 en Variation of Information
Palabras clave: segmentación de imágenes, sobre-segmentación, imágenes RGB-D, información de profundidad, segmentación multi-modal.
1. INTRODUCTION
Segmentation is a well-known, challenging problem in computer vision. State-of-the-art research has traditionally tackled this problem using appearance data and analytical models for the integration of global and local color cues in order to define object boundaries [
Nonetheless, the performance of these approaches remains limited because of the diversity and ambiguity of natural images.
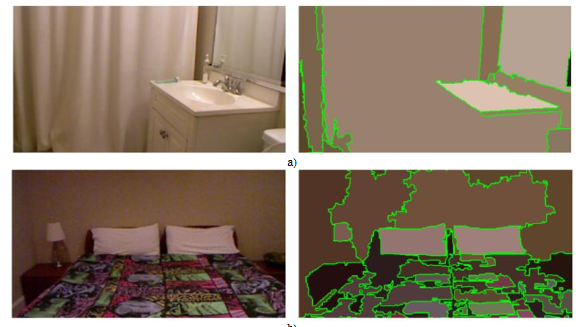
Typical segmentation, therefore, often results in either over-segmented (the image is divided into too many regions) or under-segmented scenes (too few regions), as illustrated in Fig. 1.
Recently, the emergence of RGB-D cameras has improved the 3D geometry analysis of indoor scenarios by capturing depth information [
For instance, a volumetric superpixel representation of target images was computed in [
Alternatively, to capture a variety of color and depth features, kernel descriptors have been used on different over-segmentations [
Their representative results were outperformed in [
Other approaches propose to cluster RGB-D data with a subsequent globally-optimal segmentation applying graph theory [
In addition to classical schemes, learning-based methods have become much more popular in recent years due to their improved performance [
Their main limitation is the extensive need of massive amounts of labeled data to achieve proper object modeling. Furthermore, such strategies train closed models with a lot of hyper-parameters linked to the source data format, thus limiting their flexibility to incorporate new segmentation cues. Moreover, learning-based segmentation commonly addresses the problem from a higher level, in which a category object prediction is the most relevant task.
In contrast, in this work, we are interested in finding region proposals by explicit boundary integration of both depth and appearance sources of information, which does not require intense training procedures. It is important to note, however, that such segmentation results are commonly used as input of learning-based methods, which can perform object detection and classification based on multiple image segments. Therefore, throughout this paper, we do not consider a comparison of our method with learning-based methods, but we do highlight the importance of generating good region proposals to follow subsequent steps of semantic image understanding. For a more detailed discussion on learning-based methods, see [
This paper presents a multi-modal segmentation framework that integrates independent appearance and depth segmentation maps in a multi-modal segmentation tree (MM-Tree) by means of hierarchical region merging process [
The principal contribution is the definition of a coherency term that enables the consensus merging of color and depth information into the MR-tree structure. In contrast to previous approaches, we start the segmentation pipeline by processing both color and depth channels separately.
On the one hand, a color segmentation tree (C-tree) allowed us to obtain two appearance-based segmentation maps. On the other hand, we computed planar and 3D edge segmentation maps only from depth data in order to encode geometrical object information, thus achieving a better global shape description. Then, by building the proposed MM-tree representation, independent segmentation maps can be hierarchically merged following a general agreement metric between segmented regions. Such process is carried out iteratively, thus enabling us to generate different tree levels that integrate irregular shapes with semantic object coherency. In particular, a higher confidence level was assigned to depth maps because of their robustness in describing the global shape of objects, while the appearance maps are mostly useful to locally regularize the contours of segmented regions. As a result, the top level of the MM-tree hierarchy recovers and coherently integrates the available information from each color and depth channel in RGB-D images, allowing a more tractable analysis of such multi-modal and independent sources. An evaluation of our approach using the public NYUD2 dataset [
2. PROPOSED APPROACH
In this work, we present a multi-modal strategy to segment scene regions by integrating independent geometrical depth and appearance maps into a multi-modal tree structure, namely, the MM-tree.
The general pipeline we propose is illustrated in Fig. 2. In it, part subfigure (a) shows the color-based tree representation (C-tree) that was implemented to manage different granularity scales from color space. From this C-tree, a first over-segmented map (C-over-segmentation) was generated as basis map for the region merging, that is, a primary layer. A more compact appearance segmentation was also obtained as support layer (C-segmentation) for further fusion support of the color space. Regarding depth information, Fig. 2 b) presents the main steps to generate the geometrical depth maps. Here, conventional pre-processing steps were followed to align color and depth data and generate 3D point clouds [
This computation allows us to iteratively fuse segmentation maps from the proposed color and depth layers. The process is done by merging adjacent regions on the primary layer applying a similarity support layer criterion [
2.1. Color Segmentation Tree: C-tree
In this study, a first pair of segmentation maps are obtained from color cues by using the widely recognized hierarchical scheme in [
The C-over-segmentation layer is the most granular map, considered as a primary layer due to its role as the first level of the MM-tree, which can initialize the region merging process with many fusion possibilities (see Fig. 2 (c)). In turn, the C-segmentation layer, with considerably fewer regions, introduces an additional support layer to lead the regional agreement alongside the proposed depth maps (see Fig. 2 (b)). For the sake of simplicity, throughout this paper, we will just adopt the gPb term when referring to the whole gPb-OWT-UCM scheme [1], hereafter referred to as the gPb algorithm.
2.2. Geometric Depth Maps
As complementary information, we considered depth primitives computed from the projected 3D point distribution of the depth image, namely, the 3D point cloud [
2.2.1. 3D-edge Segmentation
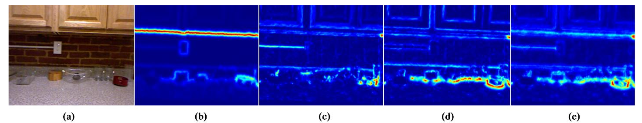
Edge information was used to describe 3D discontinuities and changes in surface orientations. In this study, a coarse geometrical scene segmentation was achieved by firstly computing 3D gradients from the 3D point cloud, as shown in Fig. 2 (b). For this purpose, we implemented the approximated model of 3D-edge detection proposed in [
Fig. 3 is a set of examples of these types of gradients. Subsequently, by using the OWT-UCM framework [
2.2.2. Planar Segmentation
A planar surface representation [
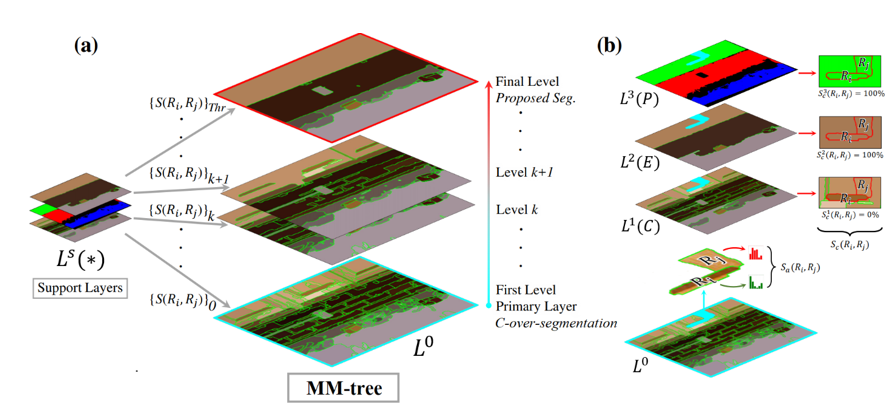
2.3 Multi-modal Segmentation Tree: MM-tree
In this paper, we propose a multi-modal segmentation tree (MM-tree) that leverages depth and appearance segmentation maps through a hierarchical region merging step (HRM) [
Source: Created by the authors.
The support layers Ls (*) encode coarse regions that guide the merging process of small regions in the primary layer L0 Each Ls (*) consists of m different image regions Ls = {Rs1, Rs2,…, Rsk,…, Rsm} generally with m ≪ n. At each step of the HRM, two adjacent regions on the primary layer Ri,Rj ∈ L0 are considered, with a total cardinality of | Ri |⋅| Rj | pixel pairs. Such region pair is spatially projected on a particular matching region Rsk on each support layer Ls in order to assess coherency across depth- and appearance-based maps. This coherency is measured by means of an overlapping rule between Ri,Rj ∈ L0 (see Fig. 4 (b)), which is mathematically expressed in (1) as the joint similarity S(Ri,Rj).
S(Ri,Rj) = (1-λa) Sc + λa Sa (1)
Where
The first term in (1), Sc ∈[0, 1], is a cross-region evidence accumulation (CREA). This term measures the coherency between two adjacent regions Ri,Rj on the primary layer L0 w.r.t. spatially coincident regions Rsk over the three supporting layers Ls. Sc then contributes to the merging of (Ri,Rj) by taking into account its overlapping percentage across each Ls, under the assumption that they may represent the same entity, mostly in terms of depth (as it can be noted in the use of two supporting depth maps and only one color map). For instance, the maximum value of Sc is reached on a particular support layer when the whole pixel distribution of Ri and Rj concur in Rsk.
Otherwise, if only part of the pixels intersects Rsk, a partial coherency is obtained w.r.t. the number of overlapping pixels and the two region sizes. In general, the Sc similarity score has a major depth weight on the final regional merging decision, since the definition of coarse object shapes is better reflected in the respective depth maps.
The second term, Sa ∈[0, 1], adds an appearance similarity consideration by computing a local histogram representation hR (b) of each compared region. For this purpose, we obtain a CIE-Lab color histogram where Nb is the number of histogram bins. Then, a similarity rule is adopted according to the chi-squared distance χ2 of adjacent region histograms (hRi, hRj) [
Finally, the parameter λa ∈[0, 1] allows the method to regularize the contribution percentage of the appearance similarity Sa.
Thus, by using (1) as a similarity region rule, the HRM is carried out in an iterative manner to gradually build the MM-tree.
Specifically, at each iteration, the two regions with the highest S(Ri,Rj) are merged into a new, larger region. This creates a new tree level where the number of regions has decreased by one. The MM-tree structure then codes new segmentation levels with new region associations (see Fig. 4 (a)). A similarly stopping criterion SThr defines the selection of a specific MM-tree level as the final segmentation. That is, if, from the whole region distribution in L0, there are no remaining adjacent region pairs with significant joint similarity S, the algorithm completes a final segmentation and the iterative process must stop.
In this paper, we propose a multi-modal tree representation (MR-Tree) that hierarchically integrates seminal segmentations obtained from color and depth information. The MR-tree generation process is based on a previous approach that operates only on the RGB space [
Therefore, a complex texture computation, originally considered in [
3. EXPERIMENTAL SETUP
3.1 Dataset and Implementation Details
The proposed strategy was evaluated on the public NYUD2 dataset [
The images capture diverse indoor scenarios of private apartments and commercial accommodations. The NYUD2 dataset is very challenging due to its high scene variability, numerous and cluttered objects, and multiple perspectives. Two image subsets were extracted for the evaluation steps in this study: Tuning set and Test set. For tuning experiments (section 3.2), the tuning set contained 290 randomly selected images (20 % of the total dataset). For the quantitative performance evaluation (section 4.2), we used the remaining images, that is, 1159 pictures.
The experiments were conducted in 64-bit MATLAB R2016b (Ubuntu Linux) on a workstation with an Intel Core i7 CPU (4 cores, 8 threads) processor and 32 GB of RAM. MATLAB libraries Image Processing and Computer Vision toolboxes were required. The specific state-of-the-art segmentation algorithms used as components of this study, as well as those used for comparison, are original implementations by the authors in MATLAB software.
The execution time of the complete pipeline for segmenting a single image was 282.6 seconds on average, which mostly depends on the complexity and number of objects in the imaged scene. This overall duration covers 4 steps with the following typical individual times: 121.1 sec (C-tree, section 2.1), 32.6 sec (3D-edge segmentation, section 2.2.1), 0.14 sec (planar segmentation, section 2.2.2), and 128.8 sec (MM-tree, section 2.3).
3.2. Performance Measures
Three standard metrics were selected to quantitatively evaluate the performance of the segmentation results compared with human ground truth: Segmentation Covering [
3.2.1. Segmentation Covering
Segmentation covering has been widely used for comparing the similarity of segmented regions with respect to ground-truth labels [
where N denotes the total number of pixels in the image and a value of 1 indicates perfect covering. Therefore, the segmentation is considered better as C approaches 1.
3.2.2 Rand Index
Let us consider two segmentations S and G of N pixels {x1,x2,…,xN } that assign labels {li} and {l’i} respectively, to a pixel xi. The Rand Index RI can be computed as the ratio of the number of pixel pairs having the same label relationship in S and G. [
Such ratio is then defined by (4). Where I is the identity function and is the number of possible unique pairs among N pixels. This gives us a measure that quantifies the fraction of pixel pairs whose labels are consistent between S and G. And, as in the case of (2), its maximum value is 1 when the two segmentations are actually the same.

3.2.3. Variation of Information
The Variation of Information (VI) is a global measure of the distance between two clusters of data from a combination of entropy (H) and mutual information (I) indexes [
VI(S,G)= H(S) + H(G) - 2 I(G,S) (5)
Regarding this metric, unlike in (2) and (3), values close to zero indicate greater similarity since it is an error quantification.
3.3 Parameters Tuning
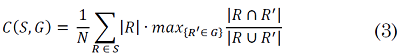
The experimental setup of this study required a final step: assessing the effect of the main parameters on the performance of our method. For this purpose, we performed a grid search over parameters K3D, λa, and SThr. From that analysis, it was possible to analyze the contribution of each perceptual cue to the segmentation process, namely, 3D-edges (K3D), appearance and CREA similarity (λa), and RGB-D segmentation tree granularity (SThr). The grid search was performed as a different tuning experiment for each of the parameters mentioned above.
Tuning experimentation was then carried out on a randomly selected image subset of 290 images (20 % of the total dataset). The results we obtained are detailed below.
3.3.1 3D-edge Segmentation Level
K3D is the tree level that yields the 3D-edge segmentation from 3D gradients (see section 2.2.1). This support layer represents the main cue from depth data to be fused with appearance information. As shown in Fig. 5 (a), the best covering score for the 3D-edge segmentation was achieved at K3D = 0.35, which corresponds to gradient maps with few object details and thus removing small noisy image artifacts.
3.3.2. Trade-off between Appearance and CREA Similarities
The λa parameter weights the importance of appearance and CREA similarity metrics from depth and color information (see section 2.3). Fig. 5 b) presents results for different values of this parameter. The best performance was observed at the peak of λa = 0.4 which highlights the importance of a balanced trade-off between appearance and depth fusion.
3.3.3 Stopping Criterion for the MM-tree
The parameter SThr controls the stopping criterion for the MM-tree computation to return a final segmentation (see section 2.3). Such parameter was fixed at SThr = 0.59 for the previously highlighted λa value, as it represents the best covering point and the merging of adjacent regions with a joint similarity greater than 0.59 (see Fig. 5 (b)).
4. EXPERIMENTS AND RESULTS
Four state-of-the-art approaches were considered for comparison. These strategies include widely recognized color-only frameworks such as Statistical Region Merging [
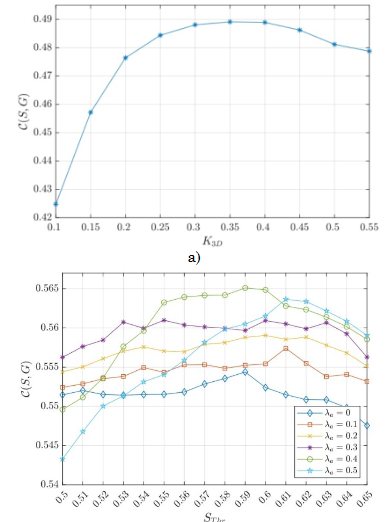
4.1 Qualitative Evaluation
A qualitative analysis of five sample scenes is presented in Fig. 6. The first column presents the original image input.
Ground truths are on the second column, and the next three columns report a baseline evaluation performed with MLSS [
The last column shows the final segmentation result achieved in this study.
In almost all the images, the proposed approach performs a robust scene segmentation by integrating depth and appearance information. Some local and specific drawbacks are reported because of the sensitivity of the computed features and the integration of initial region proposals, restricted to a color base layer.
Also, in some cases, strong light intensity can affect the results (fifth row).
Particularly, in the images in the first and fourth row, our strategy yields better results than other baseline techniques due to its capability to exploit and properly code depth information. In the third and fifth rows, as well as the first, a richness of small scene objects can be noticed, a particularly challenging problem for most non-supervised strategies.
4.2 Quantitative Evaluation
We carried out a quantitative evaluation of the proposed approach and the baseline strategies compared to human ground truth delineations in the testing set (1159 images) by implementing the benchmarks/metrics detailed in section 3.2.
Fig. 7 shows the performance obtained using the Segmentation Covering evaluation. We achieved the best results, in terms of overlapping, with an average accuracy of ∼0.56 (black asterisk in the box plot). This performance was mostly due to the proper integration of depth geometrical features that allowed a better identification of objects categorized on the same plane. Such extra depth cue was also exploited by the gPbD algorithm, but it needed many additional computational resources to segment the objects. Despite small numerical differences, compared to gPbD, our segmentation pipeline is simpler and more flexible in introducing new geometrical and appearance features without changing the general computational framework. In contrast, color-only strategies over-segment images and tend to split objects into small instances because of the high light variability and multiple color distribution in the captured scenes. In such cases, 2-dimensional edges are considerably noisy and cannot support object geometries.
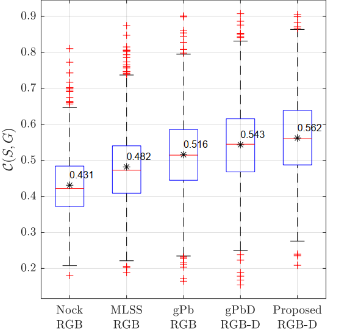
Fig. 7. Performance comparison between state-of-the-art and proposed segmentations in terms of Segmentation covering (C). Higher values indicate better segmentation. Note that the score obtained with the proposed strategy is competitive because it is higher than that of the other techniques. Source: Created by the authors.
Fig. 8 presents the general scores of the approaches evaluated here using the Rand Index. Our score can be summarized as a mean value of 0.907, being slightly lower than that of the gPbD method (0.914), without statistically significant differences.
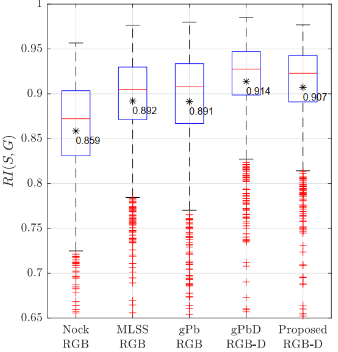
Fig.8. Performance comparison between state-of-the-art and proposed segmentations in terms of Rand Index (RI) Higher values indicate better segmentation. Here, the score of the proposed segmentation is slightly lower than that of the gPbD scheme, but the performance remains better w.r.t. RGB approaches. Source: Created by the authors.
The best performance was also achieved with both depth-aware strategies, with even more compact results regarding quartile score distribution. The proposed segmentation results are competitive thanks to the coding of plane and 3D-edge features, but numerous mistakes are produced by the incorrect labeling of tiny scene objects that share the same plane or have negligible edge discontinuities. In turn, the color-based strategies exhibited a lower performance, except for the gPb approach (∼ 0.89), but with a larger variance in the results. The MLSS approach, in contrast, achieves a more compact RI variance with an average accuracy of 0.892, exceeding the gPb average but with the drawback of requiring the number of desired segmented regions.
Finally, Fig. 9 reports the results of the metric Variation of Information. In it, the proposed approach achieves the lowest score, with an average of 2.13, while gPbD reached 2.36 with larger score variance (see Fig. 9). Regarding color-based strategies, MLSS achieved the best performance. In general, the proposed segmentations achieve competitive results with respect to the widely known gPbD scheme, which also involves depth information but with more complex joint definitions and relationships of data primitives. In contrast, this study is focused on the computation of simple yet robust primitives from image and depth channels, treated and coded independently.
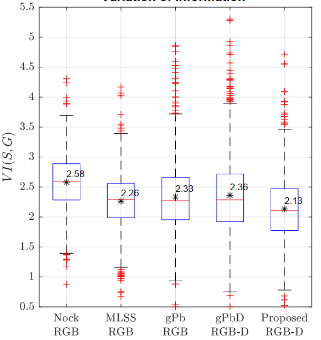
A hierarchical and iterative merging allow us to efficiently integrate such primitives and obtain a relatively coherent scene grouping. As shown in the previous results, the use of depth primitives is a clear advantage to face the challenging problem of image segmentation.
5. DISCUSSION AND CONCLUDING REMARKS
RGB-D image segmentation is a field in continuous development with powerful and interesting advantages that allow us to deal with several applications limited by the use of color relationships only.
For instance, the problem of object detection is very challenging when objects share a lot of key features in appearance space and also present a wide variability due to differences in perspective, capture, and illumination conditions. With the availability and leverage of depth information, such issues can be significantly reduced. In this study, we presented a novel RGB-D segmentation strategy based on the integration of color and depth information. A key difference of the proposed method with respect to state-of-the-art approaches is the analysis of color and depth data in an independent manner, before performing the fusion of both information sources. To this end, we incorporated consensus clustering algorithms [
Remarkably, the proposed approach only requires visual and depth information without any prior labelling in order to deal with regional segmentation. In that sense, this study can be used as a starting point for more sophisticated approaches, such as visual component regularization, in order to achieve more effective and faster segmentations.
The planar and 3D edge maps computed from depth information supported coherent object segmentation tasks, according to results reported on the public dataset evaluated here. In that sense, the proposed approach is robust compared to the baseline depth gPbD scheme [
The proposed approach, non-supervised in nature, can serve as input for supervised frameworks. Currently, most segmentation schemes take advantage of learning-based strategies that learn complex parametric models from hand-labeled images in massive datasets.
Training these approaches is computationally expensive and limited in terms of incorporating new perceptual cues for segmentation improvement, as required with emerging technologies in multi-modal sensors. Conversely, the proposed pipeline has potential for multi-modal cue integration and can contribute as a primary step to automatically segment coherent regions that can be evaluated by more sophisticated learning-based algorithms. Regarding computational cost, our method is efficient and can be parallelized since geometrical and depth features are processed independently.
Additionally, the hierarchical region merging process implemented here is based on an iterative process that can be treated in new computational configurations.
Despite current studies that report remarkable advances in segmentation tasks [
In that sense, those approaches achieve effectively hierarchical architectures, discovering kernels even to represent basic primitives. The proposed approach could be integrated into first- and mid-level layers of such hierarchical schemes, allowing a more effective and faster training. Finally, the use of these pre-computed regions from the proposed tree representation can reduce overfitting problems and address the segmentation challenges of reduced training datasets.
6. ACKNOWLEDGMENTS
We would like to thank Vicerrectoría de Investigación y Extensión at Universidad Industrial de Santander for funding this study as part of the project “Reconocimiento continuo de expresiones cortas del lenguaje de señas registrado en secuencias de video”, with SIVIE code 2430.
7. REFERENCES
- arrow_upward [1] P. Arbelaez, M. Maire, C. Fowlkes, and J. Malik, “Contour Detection and Hierarchical Image Segmentation,” IEEE Trans. Pattern Anal. Mach. Intell., vol. 33, no. 5, pp. 898–916, May. 2011. https://doi.org/10.1109/TPAMI.2010.161
- arrow_upward [2] X. Wang, Y. Tang, S. Masnou, and L. Chen, “A Global/Local Affinity Graph for Image Segmentation,” IEEE Trans. Image Process., vol. 24, no. 4, pp. 1399–1411, Apr. 2015. https://doi.org/10.1109/TIP.2015.2397313
- arrow_upward [3] J. Han, L. Shao, D. Xu, and J. Shotton, “Enhanced Computer Vision With Microsoft Kinect Sensor: A Review,” IEEE Trans. Cybern., vol. 43, no. 5, pp. 1318–1334, Oct. 2013. https://doi.org/10.1109/TCYB.2013.2265378
- arrow_upward [4] N. Silberman, D. Hoiem, P. Kohli, and R. Fergus, “Indoor segmentation and support inference from RGBD images,” Comput. Vis. -- ECCV 2012 12th Eur. Conf. Comput. Vis., pp. 746–760, Berlin, 2012. https://doi.org/10.1007/978-3-642-33715-4_54
- arrow_upward [5] X. Ren, L. Bo, and D. Fox, “RGB-(D) scene labeling: Features and algorithms,” in 2012 IEEE Conference on Computer Vision and Pattern Recognition, Providence, 2012, pp. 2759–2766. https://doi.org/10.1109/CVPR.2012.6247999
- arrow_upward [6] S. Gupta, P. Arbelaez, and J. Malik, “Perceptual organization and recognition of indoor scenes from RGB-D images,” in Proceedings of the IEEE Conference on Computer Vision and Pattern Recognition, Portland, 2013, pp. 564–571. https://doi.org/10.1109/CVPR.2013.79
- arrow_upward [7] Z. Li, X. M. Wu, and S. F. Chang, “Segmentation using superpixels: A bipartite graph partitioning approach,” in 2012 IEEE Conference on Computer Vision and Pattern Recognition, Providence, 2012, pp. 789–796. https://doi.org/10.1109/CVPR.2012.6247750
- arrow_upward [8] R. Nock and F. Nielsen, “Statistical region merging,” IEEE Trans. Pattern Anal. Mach. Intell., vol. 26, no. 11, pp. 1452–1458, Nov. 2004. https://doi.org/10.1109/TPAMI.2004.110
- arrow_upward [9] J. Yang, Z. Gan, K. Li, and C. Hou, “Graph-Based Segmentation for RGB-D Data Using 3-D Geometry Enhanced Superpixels,” IEEE Trans. Cybern., vol. 45, no. 5, pp. 927–940, May 2015. https://doi.org/10.1109/TCYB.2014.2340032
- arrow_upward [10] A. Richtsfeld, T. Mörwald, J. Prankl, M. Zillich, and M. Vincze, “Learning of perceptual grouping for object segmentation on RGB-D data,” J. Vis. Commun. Image Represent., vol. 25, no. 1, pp. 64–73, Jan. 2014. https://doi.org/10.1016/j.jvcir.2013.04.006
- arrow_upward [11] L. Cruz, D. Lucio, and L. Velho, “Kinect and rgbd images: Challenges and applications,” in Graphics, Patterns and Images Tutorials (SIBGRAPI-T), 2012 25th SIBGRAPI Conference on, Ouro Preto, 2012, pp. 36–49. https://doi.org/10.1109/SIBGRAPI-T.2012.13
- arrow_upward [12] K. Chen, Y.-K. Lai, and S.-M. Hu, “3D indoor scene modeling from RGB-D data: a survey,” Comput. Vis. Media, vol. 1, no. 4, pp. 267–278, Dec. 2015. https://doi.org/10.1007/s41095-015-0029-x
- arrow_upward [13] D. Lin, G. Chen, D. Cohen-Or, P. A. Heng, and H. Huang, “Cascaded Feature Network for Semantic Segmentation of RGB-D Images,” in 2017 IEEE International Conference on Computer Vision (ICCV), Venice, 2017, pp. 1320–1328. https://doi.org/10.1109/ICCV.2017.147
- arrow_upward [14] J. McCormac, A. Handa, S. Leutenegger, and A. J. Davison, “SceneNet RGB-D: Can 5M Synthetic Images Beat Generic ImageNet Pre-training on Indoor Segmentation?,” in 2017 IEEE International Conference on Computer Vision (ICCV), Venice, 2017, pp. 2697–2706. https://doi.org/10.1109/ICCV.2017.292
- arrow_upward [15] W. Wang and U. Neumann, “Depth-aware cnn for rgb-d segmentation,” in Proceedings of the European Conference on Computer Vision (ECCV), Switzerland, 2018, pp. 135–150. https://doi.org/10.1007/978-3-030-01252-6_9
- arrow_upward [16] Y. Guo, Y. Liu, T. Georgiou, and M. S. Lew, “A review of semantic segmentation using deep neural networks,” Int. J. Multimed. Inf. Retr., vol. 7, no. 2, pp. 87–93, Jun. 2018. https://doi.org/10.1007/s13735-017-0141-z
- arrow_upward [17] D. Huang, J.-H. Lai, C.-D. Wang, and P. C. Yuen, “Ensembling over-segmentations: From weak evidence to strong segmentation,” Neurocomputing, vol. 207, pp. 416–427, Sep. 2016. https://doi.org/10.1016/j.neucom.2016.05.028
- arrow_upward [18] J. Smisek, M. Jancosek, and T. Pajdla, “3D with Kinect,” in Consumer depth cameras for computer vision, London: Springer, 2013, pp. 3–25. https://doi.org/10.1007/978-1-4471-4640-7_1
- arrow_upward [19] M. Maire, P. Arbelaez, C. Fowlkes, and J. Malik, “Using contours to detect and localize junctions in natural images,” in 2008 IEEE Conference on Computer Vision and Pattern Recognition, Anchorage, Ak, 2008, pp. 1–8. https://doi.org/10.1109/CVPR.2008.4587420
- arrow_upward [20] P. Arbelaez, “Boundary extraction in natural images using ultrametric contour maps,” in Computer Vision and Pattern Recognition Workshop, 2006. CVPRW’06. Conference on, New York, 2006, pp. 182. https://doi.org/10.1109/CVPRW.2006.48
- arrow_upward [21] C. Feng, Y. Taguchi, and V. R. Kamat, “Fast plane extraction in organized point clouds using agglomerative hierarchical clustering,” in 2014 IEEE International Conference on Robotics and Automation (ICRA), Hong Kong, 2014, pp. 6218–6225. https://doi.org/10.1109/ICRA.2014.6907776
- arrow_upward [22] R. Hulik, M. Spanel, P. Smrz, and Z. Materna, “Continuous plane detection in point-cloud data based on 3D Hough Transform,” J. Vis. Commun. Image Represent., vol. 25, no. 1, pp. 86–97, Jan. 2014. https://doi.org/10.1016/j.jvcir.2013.04.001
- arrow_upward [23] T. H. Kim and K. M. Lee, S. U. Lee, “Learning full pairwise affinities for spectral segmentation,” in 2010 IEEE Computer Society Conference on Computer Vision and Pattern Recognition, Jul. 2013, pp. 1690-1703. https://doi.org/10.1109/TPAMI.2012.237
- arrow_upward [24] P. Arbelaez, M. Maire, C. Fowlkes, and J. Malik, “From contours to regions: An empirical evaluation,” in 2009 IEEE Conference on Computer Vision and Pattern Recognition, Miami, 2009, pp. 2294–2301. https://doi.org/10.1109/CVPR.2009.5206707
- arrow_upward [25] R. Unnikrishnan, C. Pantofaru, and M. Hebert, “Toward Objective Evaluation of Image Segmentation Algorithms,” >IEEE Trans. Pattern Anal. Mach. Intell., vol. 29, no. 6, pp. 929–944, Jun. 2007. https://doi.org/10.1109/TPAMI.2007.1046
- arrow_upward [26] M. Meilǎ, “Comparing clusterings: an axiomatic view,” in Proceedings of the 22nd international conference on Machine learning, Aug. 2005, pp. 577–584. https://doi.org/10.1145/1102351.1102424
- arrow_upward [27] A. Goder and V. Filkov, “Consensus clustering algorithms: Comparison and refinement,” in Proceedings of the Meeting on Algorithm Engineering & Expermiments, Jan. 2008, pp. 109–117. http://dl.acm.org/citation.cfm?id=2791204.2791215
AUTHOR CONTRIBUTIONS
1 Performed the computer simulations, data analysis, and validation of the obtained results. He also made the necessary adjustments of the proposed approach presentation
2 Conceived and designed the methodology. He also provided advising and revisions
3 Wrote most of the sections of the paper. He also improved the presentation of the obtained results.
All authors have contributed equally. All authors contributed to the design of the research, discussed the results and commented on the manuscript.