Estimating a Building’s Energy Performance using a Composite Indicator: A Case Study
Estimación del desempeño energético de una edificación utilizando un indicador compuesto: un caso de estudio
 PDF
PDF
Received: March 18, 2022
Accepted: June 06, 2022
Available: August 03, 2022
M. Millán-Martínez; G. Osma-Pinto; J. Jaramillo-Ibarra, “Estimating a Building’s Energy Performance using a Composite Indicator: A Case Study”, TecnoLógicas, vol. 25, nro.54, e2352, 2022. https://doi.org/10.22430/22565337.2352
Abstract
Several studies have analyzed the integration of energy-saving strategies in buildings to mitigate their environmental impact. These studies focused mainly on a disaggregated analysis of such strategies and their effects on the building's energy consumption and thermal behavior, using energy engine simulation software (EnergyPlus, TRNSYS, and DOE2) or graphical interface software (DesignBuilder, eQuest, and ESP-r). However, buildings are complex systems whose energy behavior depends on the interaction of passive (e.g., location and construction materials) and dynamic (e.g., occupation) components. Therefore, this study proposes a composite indicator Building’s Energy Performance (BEP) as an alternative to deal with this complex and multidimensional phenomenon in a simplified way. This indicator considers energy efficiency and thermal comfort. The Electrical Engineering Building (EEB) of the Universidad Industrial de Santander was selected to verify the performance of the BEP indicator. In addition, a sensitivity analysis was performed for different mathematical aggregation methods and weighting values to test their suitability to reproduce the building behavior. Different simulation scenarios modeled with DesignBuilder software were proposed, in which the energy-saving strategies integrated with the building was individually analyzed. The results confirmed that the integration of the building's energy-saving strategies improved the BEP indicator by approximately 16%. It has also been possible to verify that the BEP indicator adequately reproduces the building’s energy behavior while guaranteeing comfort conditions. Finally, the Building Energy Performance indicator is expected to contribute to the integration of sustainability criteria in the design and remodeling stages of buildings.
Keywords: Building’s energy performance indicator; green buildings; green design; energy simulation; energy efficiency; thermal comfort; DesignBuilder.
Resumen
Diversos estudios han analizado la integración de estrategias de ahorro energético en edificaciones para mitigar su impacto ambiental. Estos estudios se centraron en un análisis desagregado de estas estrategias y sus efectos sobre el consumo de energía y el comportamiento térmico del edificio utilizando motores de simulación energética (EnergyPlus, TRNSYS y DOE2) o software de interfaz gráfica (DesignBuilder, eQuest y ESP-r). Sin embargo, los edificios son sistemas complejos cuyo comportamiento energético depende de la interacción de componentes pasivos (p. ej., ubicación y materiales de construcción) y dinámicos (p. ej., ocupación). Por lo tanto, este artículo propone un indicador compuesto de desempeño energético de edificaciones (BEP) como una alternativa para enfrentar este fenómeno complejo y multidimensional de manera simplificada. Este indicador considera la eficiencia energética y el confort térmico. Para ello, se seleccionó un edificio real, el Edificio de Ingeniería Eléctrica (EEB) de la Universidad Industrial de Santander, con el fin de verificar el desempeño del indicador BEP. Además, se realizó un análisis de sensibilidad para diferentes métodos matemáticos de agregación y valores de ponderación para probar su idoneidad para reproducir el comportamiento del edificio. Se propusieron diferentes escenarios de simulación modelados mediante el software DesignBuilder, en los que se analizaron individualmente las estrategias de ahorro energético integradas con el edificio. Los resultados confirmaron que las estrategias de ahorro energético del edificio mejoraron el indicador en aproximadamente un 16 %. Asimismo, fue posible verificar que dicho indicador reproduce adecuadamente el comportamiento energético de la edificación mientras se garantiza condiciones de confort. Por último, se espera que el indicador contribuya en la integración de criterios de sostenibilidad en edificaciones durante las etapas de diseño y remodelación.
Palabras clave: Indicador desempeño energético de edificaciones; bioconstrucción; diseño verde; simulación energética; eficiencia energética; confort térmico; DesignBuilder.
1. INTRODUCTION
Cities account for between 60 % and 80 % of the energy consumption, thereby contributing significantly to global greenhouse gas emissions. Likewise, the growth of the population and the city's urbanization rate is expected increase world energy demand by approximately 30 % [
The energy demand of a building depends primarily on the architectural design (e.g., materials, geometry, and percentage of glazed facades), and it can vary owing to external conditions (e.g., weather and the occurrence of disruptive events) and usage (e.g., usage patterns and modification of the spaces). In some cases, this variation may mean a greater increase in demand than projected, which may result in an inability to satisfy the building’s energy requirements for occupant comfort [
In recent years, construction practices that favor the adoption of sustainability criteria in buildings and improve the well-being of their occupants throughout their life cycle have gain recognition [
Buildings are structures designed for long term use with the ability to adapt to changing scenarios and adjust their operation according to the evolving needs of their occupants [
Green buildings are designed to efficiently use resources (e.g., energy) and improve their environmental performance (e.g., greenhouse gas reduction) [
Passive energy-saving strategies focus on the building’s architectural design to take advantage of the environmental conditions and, in this way, reduce the use of energy for lighting and air conditioning [
Energy-saving strategies can be integrated into building design in several ways. These can be classified into (i) variation of parameters or parametric analysis and (ii) optimization approaches, often multi-objective [
EnergyPlus is an energy simulation tool widely used and validated by designers and researchers to analyze at building’s energy and thermal performance [
Different studies that address building energy analysis through energy simulation software focus on estimating operational energy, embedded energy, energy life cycle, energy-saving and thermal comfort indices [
Buildings can be considered complex systems whose operation (energy-related) depends on the interaction of different components, whether they are static (e.g., location and construction materials) or dynamic (e.g., occupation) [
Composite indicators (CIs) are valuable tool for describing multidimensional phenomena or concepts through the mathematical combination (aggregation) of a group of sub-indicators that evaluate their specific characteristics [
From an energy approach, the CIs most frequently mentioned in the literature are energy security (evaluated at a local or regional level) [
However, very few studies address BEP analysis from a multidimensional approach. Therefore, this study aims to construct a CI that facilitates the understanding of BEP while integrating some of the most relevant sub-indicators and metrics used in the literature to analyze the energy consumption and thermal behavior in buildings. This indicator represents a relatively easy-to-implement tool that allows stakeholders in the building sector to make appropriate decisions that contribute to the efficient integration of energy-saving strategies in buildings.
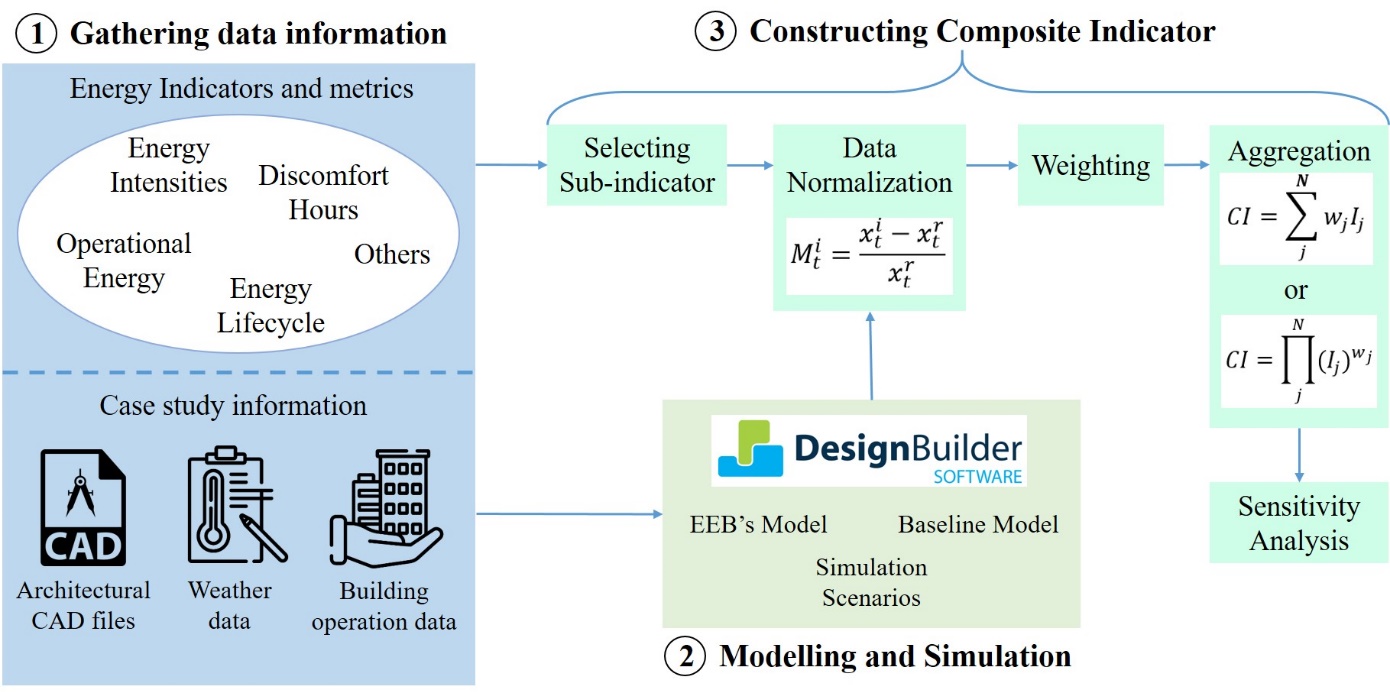
Therefore, this study proposes a CI that allows the estimation of a BEP while ensuring thermal comfort conditions. A working methodology of this study consisting of three stages is proposed as follows: (i) identification of possible sub-indicators and metrics and gathering information on the case study features, (ii) case study modeling and simulation, and (iii) construction of the composite indicator. This last stage consists of selecting sub-indicators and metrics, normalizing the data obtained from the simulations, weighting and aggregating the data, and validating the proposed indicator through a sensitivity analysis.
As a result, the resulting BEP indicator was obtained as a mathematical aggregation of the energy efficiency (EE) and thermal comfort (CO) sub-indicators. The Electrical Engineering building (EEB) of the Universidad Industrial de Santander (UIS) (Bucaramanga, Colombia) was selected as a case study. The energy models and case study simulations were developed using the DesignBuilder V6 software.
This paper outlines the general aspects of CIs construction, considerations of the proposed BEP indicator, case study description, and elaboration of its energy models (Section 2). The analysis of the simulations results of the energy models and the evaluation and validation of the proposed composite indicator are discussed (Section 3). Finally, the conclusions of this study are presented (Section 4).
2. MATERIALS AND METHODS
This section presents the general considerations for constructing a CI, the proposed CI for estimating the BEP, and some aspects of its application. Subsequently, the building selected as a case study is described in detail. Finally, the energy models and simulation scenarios considered in this study are presented. Figure 1 shows the general methodology used in this study.
2.1 Constructing CIs
CIs represent an alternative for analyzing complex phenomena because they integrate the measurement of metrics related to multidimensional concepts, simplify the evaluation procedure, and facilitate the dissemination [
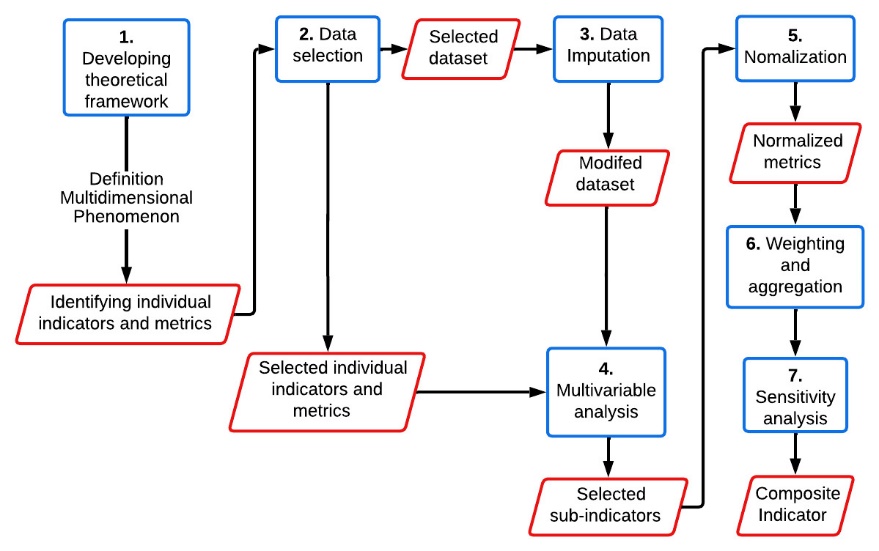
CIs are constructed in seven stages, as shown in Figure 2: (i) a theoretical framework is developed to understand and define the multidimensional concept to be measured, individual indicators and metrics are identified, and the selection criteria are stablished; (ii) the quality of available indicators and metrics are checked by data selection, and the dataset is selected; (iii) the sub-indicators (group of individual indicators) are established using multivariate analysis; (iv) data imputation is conducted, which allows the dataset to be adapted in case of missing information; (v) normalization is performed to transform the metrics and/or sub-indicators to a common scale; (vi) the weights of the sub-indicators and aggregation method are established to estimate the composite indicator; (vii) sensitivity analysis is conducted to evaluate the quality and robustness of the composite indicator [
The selection of normalization, weighting and aggregation methods depends on the sub-indicator characteristics and is subject to the consideration of the analyst who builds the CI [
2.1.1 Normalization methods
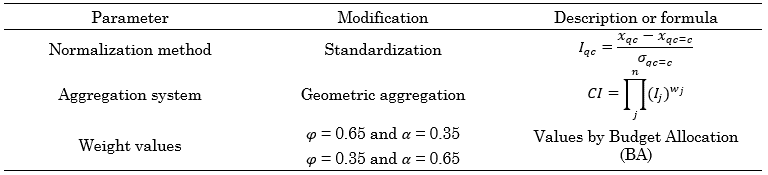
CI construction often involves handling data with different scales and dimensions; therefore, it is necessary to normalize the dataset to a common scale. There is evidence in the literature of several methods used for data normalization. Table 1 lists some of the most applied methods.
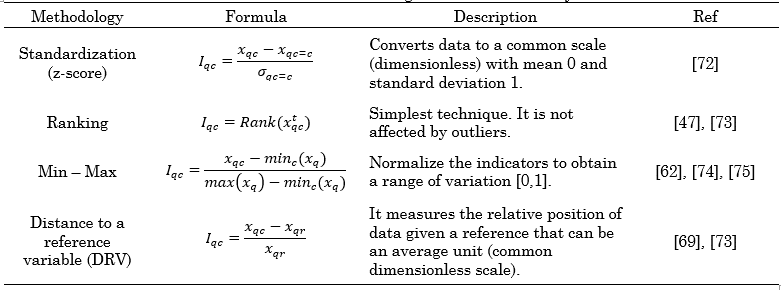
Iqc is the indicator or metric for normalization, xqc is the non-normalized variable, and qc is the standard deviation of the reference variable.
2.1.2 Weighting methods
Although there are many methods to weigh sub-indicators, their selection depends on the characteristics of the CI. The simplest weighting method assigns equal weights (EW) to each sub-indicator and is recommended for the initial phases of the CI construction [
2.1.3 Aggregation strategies
Aggregation strategies can be grouped into compensatory (geometric and linear weighted aggregation) and non-compensatory (multi-criteria analysis) procedures. The geometric weighted and weighted linear aggregation methods are the most used compensatory aggregation procedures; the mathematical formulation of these techniques is given in (1) and (2), respectively.
 (1)
(1)

Where, CI is a composite indicator, Ij is the normalized sub-indicator j, and wj is the weight assigned to sub-indicator j.
2.2 Building Energy Performance (BEP) indicator
A literature review identified recurring items related to the building performance, with a particular interest in green buildings. The most mentioned were energy efficiency, comfort, adaptability, reliability, and sustainability [
Although it is possible to assign sub-indicators and metrics to most of these concepts, only energy efficiency and comfort (from a thermal perspective) were considered as sub-indicators for CI construction in this study. Table 2 presents the selected metrics used to evaluate the sub-indicators.
| Sub-indicator | Definition | Metric | |
| EE | Reduction of energy consumption in buildings to maintain desired operating conditions [ |
Total annual energy consumption (MEE1) | |
| Lighting annual energy consumption (MEE2) | |||
| HVAC annual energy consumption (MEE3) | |||
| CO | Perceived satisfaction level regarding the thermal environment conditions in buildings [ |
Discomfort hours (MCO1) | |
| Predicted percentage of dissatisfied PPD (MCO2) | |||
In this study, DRV was selected to normalize the metrics. The mathematical formulation of this method is presented in (3).
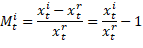
Where Mti is the normalized value of metric i for time t; xti and xtr are the non-normalized metric i and the reference value of the metric i (the result of the baseline model), respectively. A value of zero was assigned to the normalized metric when the non-normalized value was greater than or equal to the reference value.
The aggregation of sub-indicators was based on the weighted linear aggregation method, which was calculated by averaging the normalized values of the metrics assigned to them. In (4), (5), and (6) the formulation of the BEP composite is presented in detail.

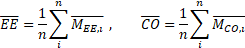
Where BEP is the composite energy performance indicator,  is the energy efficiency (normalized),
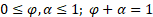
  is the thermal comfort (normalized), M ̅EE,i is the energy efficiency for metric i (normalized), and M ̅CO,I is the thermal comfort metric i (normalized). The EW method was chosen (φ = 0.50 and α = 0.50), and two other weight sets were proposed for analysis. Table 3 lists the parameters used in the sensitivity analysis.
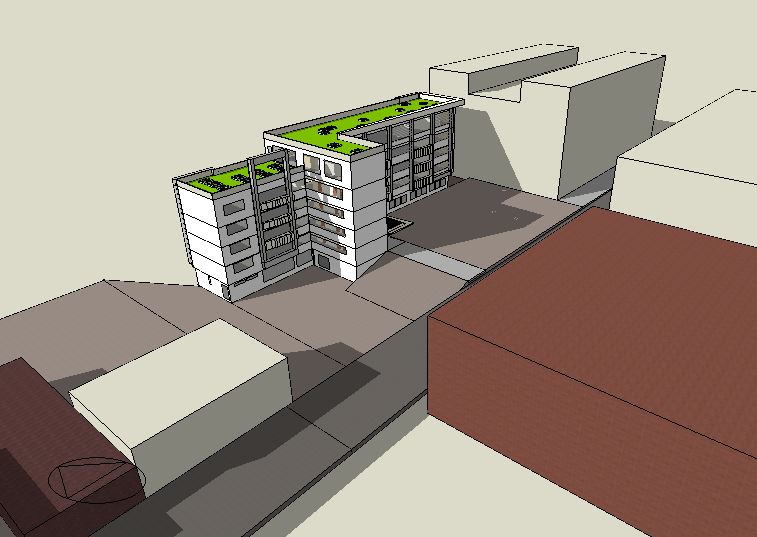
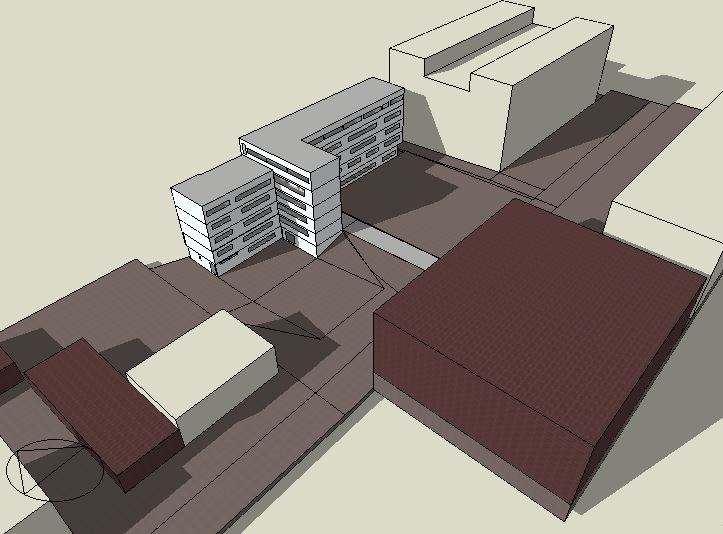
2.3 Case study features
The Electrical Engineering building of the Universidad Industrial de Santander (UIS), located in Bucaramanga, Colombia (7.13° North, 73.13° West, 960 masl) was taken as the case study. This city has warm weather conditions with average daily and maximum temperatures of 24 °C and 31 °C, respectively, and an average annual rainfall of 1279 mm. The solar irradiation ranges from 2.0 kWh/m2 to 7.6 kWh/m2, with an average of 4.8 kWh/m2 [
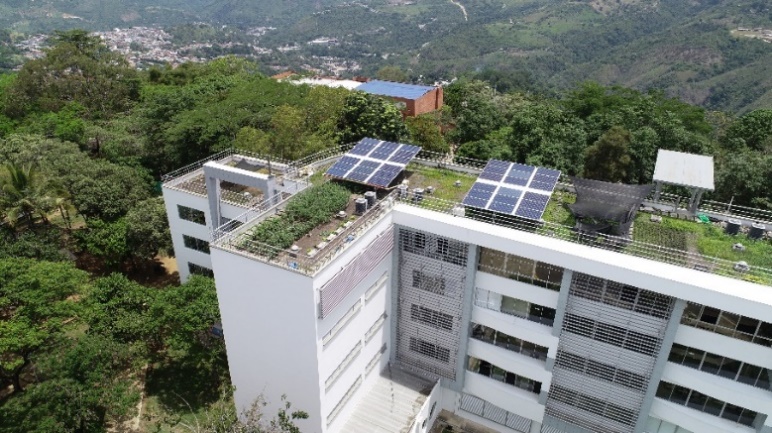
Green roofs and a solar tube system were installed on the roofs of fourth and fifth floors (140 and 440 m2, respectively). These systems reduce HVAC and lighting energy consumption in certain areas [
| Building features | Description |
| Location | 7.13° North, 73.13° West |
| Altitude | 960 masl |
| Area approx. | 2 700 m2 |
| Occupation approx. | 1 400 people |
| Building orientation (main façade) | South-North |
| Floors numbers | 5 floors and a basement |
| Building area use | Classroom, study room, administrative and teacher offices |
| Green roof area | 580 m2 |
| PV system | 36 PV panel (9.63 kW) and 6 PV panel (1.92 kW) |
| Solar tube system | 6 tube of 25 cm and 17 tube of 25 cm |
2.4 EEB energy modeling process
The EEB was modeled using the DesignBuilder V6 simulation tool because it allows the user to elaborate on relatively complex building geometries, configure the building’s components as construction materials (walls, windows, and doors), occupation, electrical loads, and HVAC systems, as well define climatic variables and building orientation [
DesignBuilder incorporates four general solution algorithms for thermal exchange in the building’s construction elements: Conduction Transfer Function (CTF), Finite difference, Heat and Humidity by Finite Elements (HAMT), and Moisture Penetrating Conduction Transfer Function (EMPD).
In this study, CTF was selected as the general solution algorithm because it allows the calculation of sensible heat without considering the storage or diffusion of humidity in the building elements; it is also the algorithm used by default in the EnergyPlus calculation engine and DesignBuilder. Although, most building models can be adequately simulated with only one or two time steps per hour, it is recommended to configure six-time steps per hour in the calculation options because the EEB has HVAC systems [
EEB modeling begins with the geometric definition (perimeter of the blocks of each building level). Then, the internal divisions, openings (doors, windows, and voids), and the architectural elements (e.g., stairs and shading elements) were included using DesignBuilder drawing tools.
Subsequently, the characteristics of the opaque elements (e.g., walls, doors, roofs, and floors) and glazing were configured. Likewise, the occupation parameters (hours and number of people) of each building area, air-conditioning equipment, lighting, and miscellaneous loads for the current-conditions model were defined. Table 5 presents the data assigned to the current-conditions model.
| Element | Material | Thickness (cm) | U-Values |
| Exterior and interior walls | Drywall | 0.150 | 2.061 |
| Mortar Coated Brick | 0.150 | 1.470 | |
| Floors | Lightened concrete | 0.400 | 1.603 |
| Roofs | Lightened concrete | 0.400 | 1.603 |
| Green roof | 0.710 | 0.358 | |
| Windows | Clear glass (SHGC = 0.85) | 0.040 | 5.871 |
| Doors | Oak | 0.010 | 2.823 |
| Metal lattice | 0.035 | 5.858 |
Studies indicate that the urban context of a building can negatively impact its performance, primarily by increasing HVAC energy consumption [
Moreover, it is necessary to establish a reference model (baseline model) without integrating the energy-saving strategies to evaluate the energy performance of the EEB.
However, no building construction parameters for educational purposes currently exist in Colombia that allow defining a baseline model necessary to evaluate BEP [
Therefore, the ASHRAE 90.1 Appendix G standard was adopted for the elemental characterization of the baseline model (HVAC systems, lighting, and equipment). This indicates that the baseline model can be elaborated from the proposed energy model considering the requirements specified in Sections 5 to 10 of the Appendix G [
In addition, to evaluate the incidence of each EEB energy-saving strategy independently, at parametric analysis of the baseline model was considered. Eight simulation scenarios were proposed, including the EEB energy model (current conditions) and baseline model. The simulations were developed for one year and the meteorological data for a typical year in the city of Bucaramanga, Colombia, were considered. Table 6 presents the selected scenarios in detail.
| Scenario | Description | Modified parameter | Parameter value |
| ES1 | Current-conditions model | NA | NA |
| ES2 | Baseline model (BLM) | NA | NA |
| ES3 | BLM modifying % Wall-Windows | % Wall-Windows | 40 % |
| ES4 | BLM modifying % Wall-Windows | % Wall-Windows | 50 % |
| ES5 | BLM + Solar tube | ES1 Solar tube | Solar tubes |
| ES6 | BLM + Green roof | ES1 Green roof | Roof |
| ES7 | BLM + Louvres | Blade depth | 0.5 m |
| ES8 | BLM + Louvres | Blade depth | 1.5 m |
3. RESULTS AND DISCUSSION
In this section the simulation results obtained in DesignBuilder V6, estimated values of the sub-indicators, and composite indicator of energy performance are analyzed.
3.1 Results of the energy models
Table 7 and Figure 6 present the results of EEB energy consumption. The total building energy consumption was measured as 160866.2 kWh/year. The greatest contributor was the lighting system with 106612.4 kWh/year (66.27 %), followed by plug-in loads with 33267.3 kWh/year (20.68 %) and HVAC with 20986.5 kWh/year (13.05%).
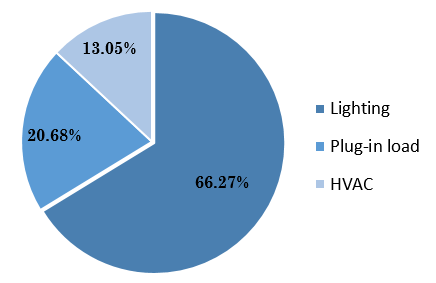
The HVAC system energy consumption in the EEB was relatively low because of the use of natural ventilation in most areas and the integration of the automation system with air conditioning units in other areas.
3.2 Analysis of incidence energy-saving strategies
Table 8 presents the metrics for the proposed scenarios. The green roof and solar tube strategies (scenarios ES5 and ES6) had low impact on the EEB’s energy consumption because these strategies only interact with specific areas of the building.
| Scenario | MEE1 (kWh) | MEE2 (kWh) | MEE3 (kWh) | MCO1 (hour) | MCO2 (%) | EE | CO |
| ES1 | 160 866.2 | 106 612.4 | 20 986.5 | 2 389.3 | 24.4 | 0.198 | 0.120 |
| ES2 | 232 004.5 | 114 896.4 | 83 795.3 | 2 373.4 | 29.7 | - | - |
| ES3 | 227 583.0 | 110 574.8 | 83 695.7 | 2 373.1 | 30.4 | 0.008 | 0.004 |
| ES4 | 227 086.2 | 109 565.6 | 84 208.0 | 2 372.8 | 30.8 | 0.010 | 0.005 |
| ES5 | 231 934.4 | 114 896.3 | 83 725.5 | 2 373.5 | 29.7 | 0.001 | 0.002 |
| ES6 | 232 271.5 | 114 816.9 | 84 142.0 | 2 373.0 | 30.4 | 0 | 0.002 |
| ES7 | 232 369.3 | 116 480.1 | 82 576.7 | 2 376.8 | 30.0 | 0.008 | 0.013 |
| ES8 | 235 849.5 | 120 460.5 | 82 076.4 | 2 380.1 | 28.7 | 0.010 | 0.049 |
In addition, modifying the wall-to-window ratio (scenarios ES3 and ES4) reduced energy consumption due to lighting (3.76 % and 4.64 %, respectively) because natural lighting was used in larger window areas. However, increasing the wall-to-window ratio increased the solar gains on exterior windows, thereby the energy consumption of HVAC systems. Despite this, thermal comfort conditions did not present significant variations in the baseline model.
Using louvers on the external windows (ES7 and ES8) reduced the thermal gains in these elements, thereby reducing the energy required for cooling the building (1.45 % and 2.05 %, respectively). However, this affected the contribution of natural lighting, increasing lighting consumption by 1.38 % and 4.84 % for each simulated scenario.
The current-conditions model (ES1) showed a more significant reduction in the energy consumption metrics of approximately 7.21 % and 74.96 % for lightning and cooling, respectively, which reduced the building's total energy consumption by 30.66 %. In terms of thermal comfort, the hours of discomfort did not vary significantly between the different models (approximately 0.67 %). Despite this, the integration of the EEB’s energy-saving strategies (ES1) decreased the PPD by approximately 5 % with the baseline model (ES2), which represents an improvement in comfort conditions in the edification.
Finally, the proposed simulation scenarios identified the incidence of different energy-saving strategies when analyzing at BEP. Thus, they contributed to the assignment of weights for constructing the BEP composite indicator.
3.3 BEP indicator estimation
Tables 9 and 10 present the results of the BEP indicator calculated using the weighted linear and geometric aggregation methods for the proposed set of weights. The metrics were normalized using the DRV normalization method.
weighted linear aggregation for a different set of weights
Source: created by the authors.
| Scenario | Sub-indicator | BEP | ||||
| EE | CO | φ = 0.50; α = 0.50 | φ = 0.65; α = 0.35 | φ = 0.35; α = 0.65 | ||
| ES1 | 0.198 | 0.120 | 0.159 | 0.171 | 0.147 | |
| ES3 | 0.008 | 0.004 | 0.006 | 0.007 | 0.005 | |
| ES4 | 0.010 | 0.005 | 0.008 | 0.008 | 0.007 | |
| ES5 | 0.001 | 0.002 | 0.002 | 0.001 | 0.002 | |
| ES6 | 0.000 | 0.002 | 0.001 | 0.001 | 0.001 | |
| ES7 | 0.008 | 0.013 | 0.011 | 0.010 | 0.011 | |
| ES8 | 0.010 | 0.049 | 0.030 | 0.024 | 0.035 | |
geometric aggregation for a different set of weights
Source: created by the authors.
| Scenario | Sub-indicator | BEP | |||
| EE | CO | φ = 0.50; α = 0.50 | φ = 0.65; α= 0.35 | φ = 0.35; α = 0.65 | |
| ES1 | 0.198 | 0.120 | 0.154 | 0.166 | 0.143 |
| ES3 | 0.008 | 0.004 | 0.006 | 0.006 | 0.005 |
| ES4 | 0.010 | 0.005 | 0.007 | 0.008 | 0.006 |
| ES5 | 0.001 | 0.002 | 0.001 | 0.001 | 0.002 |
| ES6 | 0 | 0.002 | 0 | 0 | 0 |
| ES7 | 0.008 | 0.013 | 0.010 | 0.009 | 0.011 |
| ES8 | 0.010 | 0.049 | 0.022 | 0.017 | 0.028 |
The assignment of weights consistently influenced the estimation of the BEP indicator, regardless of the selected aggregation method (weighted linear or geometric). The differences in the evaluated weights were relatively small and similar in both cases (between 0 and 0.012), with the ES1 scenario exhibiting the most significant variation (approximately 7.5 %).
Compared with BEP indicators using the geometric aggregation method which varied between 0 and 0.005, the weighted linear aggregation method yielded slightly higher values.
The EEB BEP (scenario ES1) was estimated to be 0.147 (min) and 0.171 (max) using the weighted linear aggregation method and 0.143 (min) and 0.166 (max) using geometric aggregation. Tables 11 and 12 present the normalized results of the BEP indicator calculated using the weighted linear and geometric aggregation methods for the proposed set of weights. The metrics were normalized using the z-score method.
and weighted linear aggregation for a different set of weights
Source: created by the authors.
| Scenario | Sub-indicator | BEP | ||||
| EE | CO | φ = 0.50; α = 0.50 | φ = 0.65; α = 0.35 | φ = 0.35; α = 0.65 | ||
| ES1 | 0.265 | 0.253 | 0.259 | 0.261 | 0.257 | |
| ES3 | 0.017 | 0.004 | 0.011 | 0.012 | 0.009 | |
| ES4 | 0.020 | 0.005 | 0.013 | 0.015 | 0.010 | |
| ES5 | 0.000 | 0.002 | 0.001 | 0.001 | 0.001 | |
| ES6 | 0.001 | 0.002 | 0.002 | 0.001 | 0.002 | |
| ES7 | 0.006 | 0.020 | 0.013 | 0.011 | 0.015 | |
| ES8 | 0.007 | 0.041 | 0.024 | 0.019 | 0.029 | |
and geometric aggregation for a different set of weights
Source: created by the authors.
| Scenario | Sub-indicator | BEP | |||
| EE | CO | φ = 0.50; α = 0.50 | φ = 0.65; α = 0.35 | φ = 0.35; α = 0.65 | |
| ES1 | 0.265 | 0.253 | 0.259 | 0.261 | 0.257 |
| ES3 | 0.017 | 0.004 | 0.008 | 0.010 | 0.007 |
| ES4 | 0.020 | 0.005 | 0.010 | 0.012 | 0.008 |
| ES5 | 0.000 | 0.002 | 0.000 | 0.000 | 0.000 |
| ES6 | 0.001 | 0.002 | 0.001 | 0.001 | 0.002 |
| ES7 | 0.006 | 0.020 | 0.011 | 0.009 | 0.013 |
| ES8 | 0.007 | 0.041 | 0.017 | 0.013 | 0.022 |
The estimated values of the BEP indicator show slight variations in the assigned weights (between 0 and 0.005) compared with those calculated using the DRV method. These differences were the same for both the aggregation methods (linear and geometric weighted).
Furthermore, the z-score normalized BEP indicator for EEB (scenario ES1) was equal for both aggregation methods (0.257 minimum, 0.259 average, and 0.261 maximum) with a percentage difference of 0.77 %.
Moreover, the geometric aggregation method tended to decrease the estimated value of the BEP indicator, especially for sub-indicators with values close to zero. Thus, it is not advisable to use this method because one sub-indicator can cancel out the impact of the others on the composite indicator.
The values estimated using the z-score method were approximately 66 % higher than those calculated using the DRV normalization method because the metrics present a dataset with high dispersion, which is consistent with the variables measured for the operation of the EEB. Therefore, the use of the DRV method for data normalization is recommended.
The BEP indicator values in each of the previous cases were consistent and did not present considerable percentage differences between the different sensitivity scenarios, thereby validating the suitability of the proposed composite indicator. In this sense, it can be stated that the integration of energy-saving strategies improves the BEP of the EEB by approximately 16 % (DRV method and weighted linear aggregation).
Although the integration of energy-saving strategies in the EEB represents an energy saving close to 30 %, it only estimates an individual indicator and does not consider the improvement in the thermal comfort of the building, as presented in previous sections.
Therefore, the BEP indicator is a suitable tool for analyzing the behavior of a building while ensuring comfortable conditions.
Finally, in general terms the BEP indicator makes it possible to estimate the impact of energy-saving strategies on building performance in a simplified manner. This indicator is expected to contribute to the construction industry stakeholders' better understanding of BEP, becoming a helpful tool for decision-making, and facilitating a greater integration of sustainability criteria in buildings.
It should be clarified that the sub-indicators proposed in the composite indicator are analyzed in stable operation; therefore, disruptive scenarios such as power outages or natural disasters cannot be evaluated using them.
4. CONCLUSIONS
This study proposes the construction of a composite indicator as a strategy to analyze the BEP using a simple approach that integrates multidimensional concepts related to its operation. The composite indicator is based on the mathematical aggregation (weighted linear) of two sub-indicators, energy efficiency and thermal comfort, which are estimated using metrics obtained from energy simulations in DesignBuilder V6.
The BEP indicator was evaluated for the proposed simulation scenarios and validated through a sensitivity analysis that considered different aggregation methods, data normalization, and weight values for the sub-indicators. As a result, it was concluded that the BEP indicator adequately reproduced the energy behavior of EEB. Likewise, it was possible to verify that the energy-saving strategies contributed to improving the BEP by approximately 16 %, taking as a reference the weighted linear aggregation method and assigning equal weights to the evaluated sub-indicators.
Although energy-saving strategies individually contribute to improving the BEP indicator, it is evident that the solar tubes and green roofs implemented in the EEB (scenarios ES5 and ES6) had a negligible impact on the composite indicator. Thus, it would be suitable to evaluate this indicator in areas where such strategies are implemented to evaluate their contribution to BEP.
Furthermore, the approach presented in this study allows for a global perspective of building operations under specific conditions. The relative simplicity to evaluating the BEP indicator enables its application to other building types (e.g., residential, commercial, or industrial), thereby contributing to the building’s energy characterization and energy-saving.
It is expected that the BEP indicator will become a helpful tool for decision-making in building design or refurbishing processes that favor the integration of sustainability criteria. However, one of the main disadvantages of the CI approach is the weighting of the sub-indicators, which depends on the consensus of the experts involved in the CI construction.
In the future, we plan to extend the composite indicator proposed in this study to include relevant BEP issues, such as adaptability, greenhouse gas (GHG) emissions, and economics. In addition, it would be beneficial to address the optimization approach for estimating the proposed sub-indicators; which would improve the quality of the composite indicator.
5. ACKNOWLEDGMENTS
The authors wish to thank the Ministry of Science, Technology, and Innovation (Ministerio de Ciencia, Tecnología e Innovación)—MINCIENCIAS (Project Contract No. 80740-798-2019), which funded the research and development of this article.
CONFLICTS OF INTEREST
The authors declare no conflict of interest.
AUTHOR CONTRIBUTIONS
Marlon Millan-Martinez: conceptualization, methodology, software, validation, formal analysis, research, resources, data curation, writing—original draft preparation, visualization.
German Osma-Pinto: conceptualization, methodology, validation, formal analysis, research, resources, writing—original draft preparation, writing—review and editing, visualization, supervision.
Julian Jaramillo-Ibarra: resources, writing—review and editing, supervision, project administration, funding acquisition.
All authors have read and agreed to the published version of the manuscript.
6. REFERENCES
- arrow_upward [1] UNEP, “Renewables in cities: 2019 global status report”, Paris, 2019.
- arrow_upward [2] UN DESAPD, “World population prospects 2019: Highlights”, 2019.
- arrow_upward [3] U.S. Energy Information Agency, “Annual Energy Outlook 2019 with projections to 2050”, EIA, 2019. https://www.idgenergyinv.com/Product_Photo/files/USA%20Annual%20Energy%20Outlook%202019%20(with%20projections%20to%202050)%20-%20EIA-%20January%202019.pdf
- arrow_upward [4] World Energy Council, “World Energy Scenarios: Composing energy futures to 2050”, Switzerland, 2013.
- arrow_upward [5] IEA; UNEP, “Global Status Report 2018: Towards a zero‐emission, efficient and resilient buildings and construction sector”, 2018. https://www.ren21.net/wp-content/uploads/2019/08/Full-Report-2018.pdf
- arrow_upward [6] S. Durdyev; E. K. Zavadskas; D. Thurnell; A. Banaitis; A. Ihtiyar, “Sustainable construction industry in Cambodia: Awareness, drivers and barriers”, Sustain., vol. 10, no. 2, pp. 1–19, 2018. https://doi.org/10.3390/su10020392
- arrow_upward [7] S. Dongmei, “Research and Application of Energy Consumption Benchmarking Method for Public Buildings Based on Actual Energy Consumption”, Energy Procedia, vol. 152, pp. 475–483, Oct. 2018. https://doi.org/10.1016/j.egypro.2018.09.256
- arrow_upward [8] M. A. J. Quirapas-Franco; P. Pawar; X. Wu, “Green building policies in cities: A comparative assessment and analysis”, Energy Build., vol. 231, p. 110561, Jan. 2021. https://doi.org/10.1016/j.enbuild.2020.110561
- arrow_upward [9] D. Zhang; Y. Tu, “Green building, pro-environmental behavior and well-being: Evidence from Singapore”, Cities, vol. 108, p. 102980, Jan. 2021. https://doi.org/10.1016/j.cities.2020.102980
- arrow_upward [10] L. He; L. Chen, “The incentive effects of different government subsidy policies on green buildings”, Renew. Sustain. Energy Rev., vol. 135, p. 110123, Jan. 2021. https://doi.org/10.1016/j.rser.2020.110123
- arrow_upward [11] R. Phillips; L. Troup; D. Fannon; M. J. Eckelman, “Do resilient and sustainable design strategies conflict in commercial buildings? A critical analysis of existing resilient building frameworks and their sustainability implications”, Energy Build., vol. 146, pp. 295–311, Jul. 2017. https://doi.org/10.1016/j.enbuild.2017.04.009
- arrow_upward [12] J. M. Diaz-Sarachaga; D. Jato-Espino, “Do sustainable community rating systems address resilience?”, Cities, vol. 93, pp. 62–71, Oct. 2019. https://doi.org/10.1016/j.cities.2019.04.018
- arrow_upward [13] W. Wang, “The concept of sustainable construction project management in international practice”, Environ. Dev. Sustain., vol. 23, pp. 16358–16380, Mar. 2021. https://doi.org/10.1007/s10668-021-01333-z
- arrow_upward [14] J. O. Atanda; O. A. P. Olukoya, “Green building standards: Opportunities for Nigeria”, J. Clean. Prod., vol. 227, pp. 366–377, Aug. 2019. https://doi.org/10.1016/j.jclepro.2019.04.189
- arrow_upward [15] Z. Ding et al., “Green building evaluation system implementation”, Build. Environ., vol. 133, pp. 32–40, Apr. 2018. https://doi.org/10.1016/j.buildenv.2018.02.012
- arrow_upward [16] J. B. Andrade; L. Bragança, “Assessing buildings’ adaptability at early design stages”, IOP Conf. Ser. Earth Environ. Sci. Conf. Ser. Earth Environ. Sci., vol. 225, p. 12012, Feb. 2019. https://doi.org/10.1088/1755-1315/225/1/012012
- arrow_upward [17] G. Ma; T. Liu; S. Shang, “Improving the climate adaptability of building green retrofitting in different regions: a weight correction system for Chinese national standard”, Sustain. Cities Soc., vol. 69, p. 102843, Jun. 2021. https://doi.org/10.1016/j.scs.2021.102843
- arrow_upward [18] M. M. Ouf; W. O’Brien; B. Gunay, “On quantifying building performance adaptability to variable occupancy”, Build. Environ., vol. 155, pp. 257–267, May. 2019. https://doi.org/10.1016/j.buildenv.2019.03.048
- arrow_upward [19] P. Herthogs; W. Debacker; B. Tunçer; Y. De Weerdt; N. De Temmerman, “Quantifying the Generality and Adaptability of Building Layouts Using Weighted Graphs: The SAGA Method”, Buildings, vol. 9, no. 4, Apr. 2019. https://doi.org/10.3390/buildings9040092
- arrow_upward [20] G. Capeluto, “Adaptability in envelope energy retrofits through addition of intelligence features”, Archit. Sci. Rev., vol. 62, no. 3, pp. 216–229, Feb. 2019. https://doi.org/10.1080/00038628.2019.1574707
- arrow_upward [21] M. Petrullo; S. A. Jones; B. Morton; A. Lorenz, “World Green Building Trends 2018 SmartMarket Report”, Dodge Data & Anal., 2018. https://www.worldgbc.org/sites/default/files/World%20Green%20Building%20Trends%202018%20SMR%20FINAL%2010-11.pdf
- arrow_upward [22] G. Osma; L. Amado; R. Villamizar; G. Ordoñez, “Building Automation Systems as Tool to Improve the Resilience from Energy Behavior Approach”, Procedia Eng., vol. 118, pp. 861–868, 2015. https://doi.org/10.1016/j.proeng.2015.08.524
- arrow_upward [23] S. Yeom; H. Kim; T. Hong; M. Lee, “Determining the optimal window size of office buildings considering the workers’ task performance and the building’s energy consumption”, Build. Environ., vol. 177, p. 106872, Jun. 2020. https://doi.org/10.1016/j.buildenv.2020.106872
- arrow_upward [24] F. Shadram; J. Mukkavaara, “Exploring the effects of several energy efficiency measures on the embodied/operational energy trade-off: A case study of swedish residential buildings”, Energy Build., vol. 183, pp. 283–296, Jan. 2019. https://doi.org/10.1016/j.enbuild.2018.11.026
- arrow_upward [25] K. D. Reyes-Barajas; R. A. Romero-Moreno; C. Sotelo-Salas; A. Luna-León; G. Bojórquez-Morales, “Passive strategies for energy-efficient building envelopes for housing developments in hot arid climates”, in WIT Transactions on Ecology and the Environment, vol. 249, pp. 115–125, 2020. https://doi.org/10.2495/SC200101
- arrow_upward [26] I. El-Darwish; M. Gomaa, “Retrofitting strategy for building envelopes to achieve energy efficiency”, Alexandria Eng. J., vol. 56, no. 4, pp. 579–589, Dec. 2017. https://doi.org/10.1016/j.aej.2017.05.011
- arrow_upward [27] N. Delgarm; B. Sajadi; F. Kowsary; S. Delgarm, “Multi-objective optimization of the building energy performance: A simulation-based approach by means of particle swarm optimization (PSO)”, Appl. Energy, vol. 170, pp. 293–303, May. 2016. https://doi.org/10.1016/j.apenergy.2016.02.141
- arrow_upward [28] P. Shiel; S. Tarantino; M. Fischer, “Parametric analysis of design stage building energy performance simulation models”, Energy Build., vol. 172, pp. 78–93, Aug. 2018. https://doi.org/10.1016/j.enbuild.2018.04.045
- arrow_upward [29] Y. Chen; X. Liang; T. Hong; X. Luo, “Simulation and visualization of energy-related occupant behavior in office buildings”, Build. Simul., vol. 10, no. 6, pp. 785–798, Mar. 2017. https://doi.org/10.1007/s12273-017-0355-2
- arrow_upward [30] E. Cuerda; O. Guerra-Santin; J. J. Sendra; F. J. Neila, “Understanding the performance gap in energy retrofitting: Measured input data for adjusting building simulation models”, Energy Build., vol. 209, p. 109688, Feb. 2020. https://doi.org/10.1016/j.enbuild.2019.109688
- arrow_upward [31] J. H. Choi, “Investigation of the correlation of building energy use intensity estimated by six building performance simulation tools”, Energy Build., vol. 147, pp. 14–26, Jul. 2017. https://doi.org/10.1016/j.enbuild.2017.04.078
- arrow_upward [32] C. F. Reinhart; C. Cerezo Davila, “Urban building energy modeling - A review of a nascent field”, Build. Environ., vol. 97, pp. 196–202, Feb. 2016. https://doi.org/10.1016/j.buildenv.2015.12.001
- arrow_upward [33] H. M. Cho; J. H. Park; S. Wi; S. J. Chang; G. Y. Yun; S. Kim, “Energy retrofit analysis of cross-laminated timber residential buildings in Seoul, Korea: Insights from a case study of packages”, Energy Build., vol. 202, p. 109329, Nov. 2019. https://doi.org/10.1016/j.enbuild.2019.07.046
- arrow_upward [34] C. Filippín; S. Flores Larsen; F. Ricard, “Improvement of energy performance metrics for the retrofit of the built environment. Adaptation to climate change and mitigation of energy poverty”, Energy Build., vol. 165, pp. 399–415, Apr. 2018. https://doi.org/10.1016/j.enbuild.2017.12.050
- arrow_upward [35] M. G. Gomes; A. M. Rodrigues; F. Natividade, “Thermal and energy performance of medical offices of a heritage hospital building”, J. Build. Eng., vol. 40, p. 102349, Aug. 2021. https://doi.org/10.1016/j.jobe.2021.102349
- arrow_upward [36] J. Teng; P. Wang; X. Mu; W. Wang, “Energy-saving performance analysis of green technology implications for decision-makers of multi-story buildings”, Environ. Dev. Sustain., vol. 23, pp. 15639–15665, Mar. 2021. https://doi.org/10.1007/s10668-021-01304-4
- arrow_upward [37] X. Yang; L. Zhao; M. Bruse; Q. Meng, “An integrated simulation method for building energy performance assessment in urban environments”, Energy Build., vol. 54, pp. 243–251, Nov. 2012. https://doi.org/10.1016/j.enbuild.2012.07.042
- arrow_upward [38] L. Zhu; B. Wang; Y. Sun, “Multi-objective optimization for energy consumption, daylighting and thermal comfort performance of rural tourism buildings in north China”, Build. Environ., vol. 176, p. 106841, Jun. 2020. https://doi.org/10.1016/j.buildenv.2020.106841
- arrow_upward [39] Y. Schwartz; R. Raslan, “Variations in results of building energy simulation tools, and their impact on BREEAM and LEED ratings: A case study”, Energy Build., vol. 62, pp. 350–359, Jul. 2013. https://doi.org/10.1016/j.enbuild.2013.03.022
- arrow_upward [40] A. Moazami; S. Carlucci; V. M. Nik; S. Geving, “Towards climate robust buildings: An innovative method for designing buildings with robust energy performance under climate change”, Energy Build., vol. 202, p. 109378, Nov. 2019. https://doi.org/10.1016/j.enbuild.2019.109378
- arrow_upward [41] S. G. Mahiwal; M. K. Bhoi; N. Bhatt, “Evaluation of energy use intensity (EUI) and energy cost of commercial building in India using BIM technology”, Asian J. Civ. Eng., vol. 22, pp. 877–894, Mar. 2021. https://doi.org/10.1007/s42107-021-00352-5
- arrow_upward [42] G. Akkose; C. Meral Akgul; I. G. Dino, “Educational building retrofit under climate change and urban heat island effect”, J. Build. Eng., vol. 40, p. 102294, Aug. 2021. https://doi.org/10.1016/j.jobe.2021.102294
- arrow_upward [43] E. Hewitt; A. Oberg; C. Coronado; C. Andrews, “Assessing ‘green’ and ‘resilient’ building features using a purposeful systems approach”, Sustain. Cities Soc., vol. 48, p. 101546, Jul. 2019. https://doi.org/10.1016/j.scs.2019.101546
- arrow_upward [44] A. Costa; M. M. Keane; J. I. Torrens; E. Corry, “Building operation and energy performance: Monitoring, analysis and optimisation toolkit”, Appl. Energy, vol. 101, pp. 310–316, Jan. 2013. https://doi.org/10.1016/j.apenergy.2011.10.037
- arrow_upward [45] C. Fan; F. Xiao; Z. Li; J. Wang, “Unsupervised data analytics in mining big building operational data for energy efficiency enhancement: A review”, Energy Build., vol. 159, pp. 296–308, Jan. 2018. https://doi.org/10.1016/j.enbuild.2017.11.008
- arrow_upward [46] M. Mazziotta; A. Pareto, “Synthesis of Indicators: The Composite Indicators Approach”, In Social Indicators Research Series, F. Maggino, Ed. Cham: Springer International Publishing, vol. 70, pp. 159–191, Jul. 2017. https://doi.org/10.1007/978-3-319-60595-1_7
- arrow_upward [47] OECD, Handbook on constructing composite indicators: methodology and user guide. OECD publishing, 2008.
- arrow_upward [48] F. Giambona; E. Vassallo, “Composite indicator of social inclusion for European countries”, Soc. Indic. Res., vol. 116, no. 1, pp. 269–293, Mar. 2014. https://doi.org/10.1007/s11205-013-0274-2
- arrow_upward [49] P. Hoffmann; M. Kremer; S. Zaharia, “Financial integration in Europe through the lens of composite indicators”, Econ. Lett., vol. 194, p. 109344, Sep. 2020. https://doi.org/10.1016/j.econlet.2020.109344
- arrow_upward [50] B. Talukder; K. W. Hipel; G. W. vanLoon, “Developing Composite Indicators for Agricultural Sustainability Assessment: Effect of Normalization and Aggregation Techniques”, Resources, vol. 6, no. 4, p. 66, Nov. 2017. https://doi.org/10.3390/resources6040066
- arrow_upward [51] C. Dominguez-Gil; M. M. Segovia-Gonzalez; I. Contreras, “A multiplicative composite indicator to evaluate educational systems in OECD countries”, Comp. A J. Comp. Int. Educ., pp. 1–18, 2021. https://doi.org/10.1080/03057925.2020.1865791
- arrow_upward [52] S. El Gibari; T. Gómez; F. Ruiz, “Evaluating university performance using reference point based composite indicators”, J. Informetr., vol. 12, no. 4, pp. 1235–1250, Nov. 2018. https://doi.org/10.1016/j.joi.2018.10.003
- arrow_upward [53] M. Feofilovs; F. Romagnoli, “Measuring Community Disaster Resilience in the Latvian Context: An Apply Case Using a Composite Indicator Approach”, Energy Procedia, vol. 113, pp. 43–50, May 2017. https://doi.org/10.1016/j.egypro.2017.04.012
- arrow_upward [54] M. P. Dočekalová; A. Kocmanová, “Composite indicator for measuring corporate sustainability”, Ecol. Indic., vol. 61, part. 2, pp. 612–623, Feb. 2016. https://doi.org/10.1016/j.ecolind.2015.10.012
- arrow_upward [55] M. J. Burgass; B. S. Halpern; E. Nicholson; E. J. Milner-Gulland, “Navigating uncertainty in environmental composite indicators”, Ecol. Indic., vol. 75, pp. 268–278, Apr. 2017. https://doi.org/10.1016/j.ecolind.2016.12.034
- arrow_upward [56] M. Reuter; M. K. Patel; W. Eichhammer; B. Lapillonne; K. Pollier, “A comprehensive indicator set for measuring multiple benefits of energy efficiency”, Energy Policy, vol. 139, p. 111284, Apr. 2020. https://doi.org/10.1016/j.enpol.2020.111284
- arrow_upward [57] J. Martchamadol; S. Kumar, “An aggregated energy security performance indicator”, Appl. Energy, vol. 103, pp. 653–670. Mar. 2013. https://doi.org/10.1016/j.apenergy.2012.10.027
- arrow_upward [58] M. Radovanović; S. Filipović; D. Pavlović, “Energy security measurement – A sustainable approach”, Renew. Sustain. Energy Rev., vol. 68, part. 2, pp. 1020–1032, Feb. 2017. https://doi.org/10.1016/j.rser.2016.02.010
- arrow_upward [59] J. A. Kelly; J. P. Clinch; L. Kelleher; S. Shahab, “Enabling a just transition: A composite indicator for assessing home-heating energy-poverty risk and the impact of environmental policy measures”, Energy Policy, vol. 146, p. 111791, Nov. 2020. https://doi.org/10.1016/j.enpol.2020.111791
- arrow_upward [60] J. Augutis; R. Krikštolaitis; L. Martišauskas; S. Urbonienė; R. Urbonas; A. B. Ušpurienė, “Analysis of energy security level in the Baltic States based on indicator approach”, Energy, vol. 199, p. 117427, May 2020. https://doi.org/10.1016/j.energy.2020.117427
- arrow_upward [61] M. M. Rahman; M. G. Rasul; M. M. K. Khan, “Energy conservation measures in an institutional building in sub-tropical climate in Australia”, Appl. Energy, vol. 87, no. 10, pp. 2994–3004, Oct. 2010. https://doi.org/10.1016/j.apenergy.2010.04.005
- arrow_upward [62] I. Iddrisu; S. C. Bhattacharyya, “Sustainable Energy Development Index: A multi-dimensional indicator for measuring sustainable energy development”, Renew. Sustain. Energy Rev., vol. 50, pp. 513–530, Oct. 2015. https://doi.org/10.1016/j.rser.2015.05.032
- arrow_upward [63] P. Mathew; L. Sanchez; S. H. Lee; T. Walter, “Assessing the Energy Resilience of Office Buildings: Development and Testing of a Simplified Metric for Real Estate Stakeholders”, Buildings, vol. 11, no. 3, Mar. 2021. https://doi.org/10.3390/buildings11030096
- arrow_upward [64] A. Gatto; C. Drago, “Measuring and modeling energy resilience”, Ecol. Econ., vol. 172, p. 106527, Jun. 2020. https://doi.org/10.1016/j.ecolecon.2019.106527
- arrow_upward [65] I. Siksnelyte-Butkiene; D. Streimikiene; V. Lekavicius; T. Balezentis, “Energy poverty indicators: A systematic literature review and comprehensive analysis of integrity”, Sustain. Cities Soc., vol. 67, p. 102756, Apr. 2021. https://doi.org/10.1016/j.scs.2021.102756
- arrow_upward [66] K. Dolge; A. Kubule; D. Blumberga, “Composite index for energy efficiency evaluation of industrial sector: sub-sectoral comparison”, Environ. Sustain. Indic., vol. 8, p. 100062, Dec. 2020. https://doi.org/10.1016/j.indic.2020.100062
- arrow_upward [67] Y. Li; J. O’Donnell; R. García-Castro; S. Vega-Sánchez, “Identifying stakeholders and key performance indicators for district and building energy performance analysis”, Energy Build., vol. 155, pp. 1–15, Nov. 2017. https://doi.org/10.1016/j.enbuild.2017.09.003
- arrow_upward [68] J. Al Dakheel; C. Del Pero; N. Aste; F. Leonforte, “Smart buildings features and key performance indicators: A review”, Sustain. Cities Soc., vol. 61, p. 102328, Oct. 2020. https://doi.org/10.1016/j.scs.2020.102328
- arrow_upward [69] R. Karagiannis; G. Karagiannis, “Constructing composite indicators with Shannon entropy: The case of Human Development Index”, Socioecon. Plann. Sci., vol. 70, p. 100701, Jun. 2020. https://doi.org/10.1016/j.seps.2019.03.007
- arrow_upward [70] P. W. M. Souza-Filho et al., “The sustainability index of the physical mining Environment in protected areas, Eastern Amazon”, Environ. Sustain. Indic., vol. 8, p. 100074, Dec. 2020. https://doi.org/10.1016/j.indic.2020.100074
- arrow_upward [71] O. Kaldas; L. A. Shihata; J. Kiefer, “An index-based sustainability assessment framework for manufacturing organizations”, Procedia CIRP, vol. 97, pp. 235–240, 2021. https://doi.org/10.1016/j.procir.2020.05.231
- arrow_upward [72] J. M. Cabello; F. Ruiz; B. Pérez-Gladish, “An Alternative Aggregation Process for Composite Indexes: An Application to the Heritage Foundation Economic Freedom Index”, Soc. Indic. Res., vol. 153, no. 2, pp. 443–467, Jan. 2021. https://doi.org/10.1007/s11205-020-02511-8
- arrow_upward [73] F. G. Santeramo, “On the Composite Indicators for Food Security: Decisions Matter!”, Food Rev. Int., vol. 31, no. 1, pp. 63–73, 2015. https://doi.org/10.1080/87559129.2014.961076
- arrow_upward [74] S. El Gibari; T. Gómez; F. Ruiz, “Building composite indicators using multicriteria methods: a review”, J. Bus. Econ., vol. 89, no. 1, pp. 1–24, Feb. 2019. https://doi.org/10.1007/s11573-018-0902-z
- arrow_upward [75] S. G. Medlol; A. A. A. Alwash, “Economic, Social, and Environmental Sustainable Operation of Roadways within the Central Business District (CBD) sector at Hilla City Incorporated with Public Transport”, IOP Conf. Ser. Mater. Sci. Eng., vol. 928, p. 22100, Nov. 2020. https://doi.org/10.1088/1757-899x/928/2/022100
- arrow_upward [76] M. Floridi; S. Pagni; S. Falorni; T. Luzzati, “An exercise in composite indicators construction: Assessing the sustainability of Italian regions”, Ecol. Econ., vol. 70, no. 8, pp. 1440–1447, Jun. 2011. https://doi.org/10.1016/j.ecolecon.2011.03.003
- arrow_upward [77] L. Molyneaux; C. Brown; L. Wagner; J. Foster, “Measuring resilience in energy systems: Insights from a range of disciplines”, Renew. Sustain. Energy Rev., vol. 59, pp. 1068–1079, Jun. 2016. https://doi.org/10.1016/j.rser.2016.01.063
- arrow_upward [78] D. Gatt; C. Yousif; M. Cellura; L. Camilleri; F. Guarino, “Assessment of building energy modelling studies to meet the requirements of the new Energy Performance of Buildings Directive”, Renew. Sustain. Energy Rev., vol. 127, p. 109886. Jul. 2020. https://doi.org/10.1016/j.rser.2020.109886
- arrow_upward [79] A. Hamburg; K. Kuusk; A. Mikola; T. Kalamees, “Realisation of energy performance targets of an old apartment building renovated to nZEB”, Energy, vol. 194, p. 116874, Mar. 2020. https://doi.org/10.1016/j.energy.2019.116874
- arrow_upward [80] M. M. Islam; M. Hasanuzzaman, “Chapter 1 - Introduction to energy and sustainable development”,in Energy for Sustainable Development, M. D. Hasanuzzaman and N. A. Rahim, Eds. Academic Press, 2020, pp. 1–18. https://doi.org/10.1016/B978-0-12-814645-3.00001-8
- arrow_upward [81] J. F. Nicol; S. Roaf, “Rethinking thermal comfort”, Build. Res. & Inf., vol. 45, no. 7, pp. 711–716, Mar. 2017. https://doi.org/10.1080/09613218.2017.1301698
- arrow_upward [82] G. Osma-Pinto; G. Ordóñez-Plata, “Measuring the effect of forced irrigation on the front surface of PV panels for warm tropical conditions”, Energy Reports, vol. 5, pp. 501–514, Nov. 2019. https://doi.org/10.1016/j.egyr.2019.04.010
- arrow_upward [83] G. Osma-Pinto; G. Ordóñez-Plata, “Measuring factors influencing performance of rooftop PV panels in warm tropical climates”, Sol. Energy, vol. 185, pp. 112–123, Jun. 2019. https://doi.org/10.1016/j.solener.2019.04.053
- arrow_upward [84] G. Roshan; M. Arab; V. Klimenko, “Modeling the impact of climate change on energy consumption and carbon dioxide emissions of buildings in Iran”, J. Environ. Heal. Sci. Eng., vol. 17, no. 2, pp. 889–906, Dec. 2019. https://doi.org/10.1007/s40201-019-00406-6
- arrow_upward [85] DesignBuilder, “Welcome to DesignBuilder V6.”, https://designbuilder.co.uk/helpv6.0/#Advanced_Calculation_Options.htm
- arrow_upward [86] J. Bouyer; C. Inard; M. Musy, “Microclimatic coupling as a solution to improve building energy simulation in an urban context”, Energy Build., vol. 43, no. 7, pp. 1549–1559, Jul. 2011. https://doi.org/10.1016/j.enbuild.2011.02.010
- arrow_upward [87] J. Cárdenas-Rangel; G. Osman-Pinto; G. Ordoñez-Plata, “Herramienta metodológica para la evaluación energética mediante simulación de edificaciones en el trópico”, Rev. UIS Ing., vol. 18, no. 2, pp. 259–268, Mar. 2019. https://doi.org/10.18273/revuin.v18n2-2019024
- arrow_upward [88] L. Diao; Y. Sun; Z. Chen; J. Chen, “Modeling energy consumption in residential buildings: A bottom-up analysis based on occupant behavior pattern clustering and stochastic simulation”, Energy Build., vol. 147, pp. 47–66, Jul. 2017. https://doi.org/10.1016/j.enbuild.2017.04.072