A Model for Quantifying Expected Effects of Demand-Side Management Strategies
Modelo para cuantificar los efectos esperados de estrategias de gestión de la demanda de energía eléctrica
 PDF
PDF
Received: March 21, 2022
Accepted: June 06, 2022
Available: June 22, 2022
S. Téllez-Gutiérrez; O. Duarte-Velasco, “A Model for Quantifying Expected Effects of Demand-Side Management Strategies,” TecnoLógicas, vol. 25, nro. 54, e2357, 2022. https://doi.org/10.22430/22565337.2357
Highlights
Abstract
This paper presents a quantitative dynamic model that can assess the response of a set of users to different Demand-Side Management strategies that are available. The main objective is to conceptualize, implement, and validate said model. As a result of a literature review, the model includes classical demand response techniques and proposes new customer actions and other novel aspects, such as energy culture and energy education. Based on the conceptualization of the model, this paper presents the structure that interrelates customer actions, demand proposals, cost-benefit analysis, and customer response. It also details the main aspects of the mathematical model, which was implemented in the Modelica modeling language. This paper includes simulations of intra-day and inter-day load shifting strategies using real data from the electricity sector in Colombia and different tariff factors. Finally, the results obtained show changes in daily consumption profiles, energy cost, system power peak, and load duration curve. Three conclusions are drawn: (i) Energy culture and pedagogy are essential to accelerate customer response time. (ii) The amount of the bill paid by customers decreases more quickly in the intra-day strategy than in its inter-day counterpart; in both cases, the cost reduction percentage is similar. (iii) Tariff increases accelerate customer response, and this relationship varies according to the Demand-Side Management strategies that are available.
Keywords: Demand-side management, Demand response program, Mathematical models, Consumer behavior, Energy management.
Resumen
El objetivo principal de este artículo fue conceptualizar, implementar y validar un modelo cuantitativo dinámico que permitiera encontrar la respuesta de un grupo de usuarios ante diferentes estrategias de gestión de la demanda de energía que les son ofertadas. Como resultado de una revisión bibliográfica, se conceptualizó un modelo que incluye técnicas clásicas de respuesta de la demanda, propone nuevas acciones del cliente y otros aspectos novedosos como la cultura y la pedagogía energética. Se determinó la estructura general que interrelaciona las acciones del cliente, las propuestas a la demanda, el análisis beneficio-costo y la respuesta del cliente. Se establecieron modelos matemáticos y se implementaron en lenguaje Modelica. Se realizaron simulaciones para las estrategias de desplazamiento intra-diario e inter-diario, utilizando valores reales del sector eléctrico colombiano y diferentes factores de tarifas. Finalmente, se presentan las gráficas obtenidas para cambios en los perfiles diarios de consumo, costo de la energía, variación del pico de potencia del sistema, cambios en la curva de duración de carga. Las principales conclusiones obtenidas son: (i) La cultura y la pedagogía energética son elementos esenciales para acelerar el tiempo de respuesta del cliente, (ii) El valor de la factura pagada por el cliente se reduce más rápidamente en la estrategia intra-diaria que en la inter-diaria; en ambos casos las reducciones porcentuales en el costo son similares. (iii) El aumento del factor tarifa acelera la respuesta del cliente, esta relación varía según el programa ofrecido.
Palabras clave: Gestión de la demanda, programa de respuesta a la demanda, modelos matemáticos, comportamiento del consumidor, gestión de la energía.
1. INTRODUCTION
The main target of the electricity supply chain and all its associated systems is to attend, promptly and efficiently, user demand in compliance with quality and reliability requirements. The electricity demand of a system is defined as the rate at which electricity is consumed. Electricity demand is influenced by economic, social and weather factors [
Final energy consumers themselves determine the quantity of energy that will be consumed in each period of time, according to their electricity consumption patterns and the particularities of their local context. This implies that large power generators in the system are not able to directly control the demand; therefore, it is necessary to understand its behavior and to evaluate strategies to indirectly control it. Electricity consumption patterns are highly diverse. Some patterns tend to be more stable than others depending on the user behavior, that is, there are users that have a regular behavior in terms of the quantity of consumed electricity and the time intervals during the day when the consumption occurs.
Also, there are groups of users that have similar consumption patterns due to the given end use of the electricity consumed, this fact gives rise to a variety of studies dealing with the characterization and forecasting of demand [
Worldwide, DSM has been studied from different perspectives [
The diversity of criteria, requirements, and information needed to implement a DSM strategy is wide and depends on the local context. It is necessary to consider all aspects related to loading profile variations for each end-user. Given the limited experience in Colombia in the design and implementation of DSM strategies, it is necessary to create a model to conceptualize, implement and validate a model to determine load profile variations and other variables associated.
This paper presents a model of expected effects from Demand-Side Management (DSM).
A previous article entitled Demand-Side Management Strategies; a Model of Expected Effects was presented at the X SICEL-2021 congress. It is a quantitative model to estimate shifts in consumption patterns from demand response classical techniques, such as different prices over intervals of time programs, also, it considers new factors like energy culture.
2. FROM DEMAND RESPONSE TO DEMAND-SIDE MANAGEMENT
Electrical systems are incorporating new technologies, like SG that include functional improvements and involve issues related to environmental impact, development of energy markets, cost reduction and reliability and efficiency increases. For example, a key element is a smart meter, that allows active participation of the end consumer of electricity. New technologies, approaches and tools give rise to the notion of DSM. Previously published reviews [
This paper defines DSM as the set of strategies aiming to modify electricity consumption patterns of end users connected to a smart grid, both in the time of use and in the quantity demanded of load, to optimize several aspects of the system. Strategies include, but are not limited to, electric system planning, control and operation, tariff and incentive scheme for energy consumption, regulation and normativity for local use. From this standpoint, DSM represents Demand Response evolution over time. has come about due to SG technologies bonding inside the traditional electric grid [
Modification of the daily demand curve is generally classified as one of the traditional techniques: Peak shaving, load shifting, strategic load growth, valley filling, conservation strategies and flexible load shape [
In the literature, there are three types of actions of the end-user of energy through which he achieves the response:
- Foregoing: a customer decides to reduce electricity consumption at peak hours or usage at times of high prices without making it up later; this implies a deprivation of load and a loss of comfort. For example, a residential customer might turn down the thermostat on a home heating during a winter night.
- Shifting: involves rescheduling usage away from times of high prices to non-peak hours; For example, a residential customer might put off ironing the clothes or running a dishwasher until a lower price per hour in the day.
- Onsite generation: in these sorts of cases, a residential customer has their domestic generation of renewable energy sources to supply their electricity needs; their load and requirements on the power system is reduced. Additionally, in this paper other actions are proposed for the client.
- Growth: Customer increase their consumption at any hour of the day due to the use of new household appliances and equipment and to customer criteria changes that increase consumption, such as family size or business growth.
- Replacement of equipment: it requires replacing elements and equipment with newest and more efficient tech equipment, such as refrigerators, lighting, engines.
- Aggregation: Customers can decide to gather in an alliance as a single entity with an aggregator that assumes to be in charge to negotiate the rate for generation service from an electric supplier. That is how services appear to exercise control over the electricity demand.
- Prepaid: Customers may pay to electricity traders for electricity before they use it.
To allow implementing the actions, in this work energy culture and education are raised as essential elements to encourage and accelerate customer response: i) End users have cultural and environmental knowledge and customs that depend on their context and that influence their consumption pattern, this set of aspects define as energy culture. ii) Energy education concept gathers strategies, incentives and experiential practices aimed at empowering customers, so they become aware of their own consumption and therefore be encouraged to adopt good energy use practices; information about consumption is the cornerstone of energy education.
3. MODEL CONCEPTUALIZATION AND STRUCTURE
Once the new DSM theoretical framework is in place, the interrelationships of different agents involved were set up, as well as the variables relating to it. Influence diagrams were developed inspired by system dynamics. These had been validated by a panel of experts.
Subsequently, the model was conceptualized, its mathematical model and structure were defined to be implemented in Modelica modeling language. Simulations were carried out over several strategies and conditions. Through interviews with experts, the plausibility of these results was analyzed and validated.
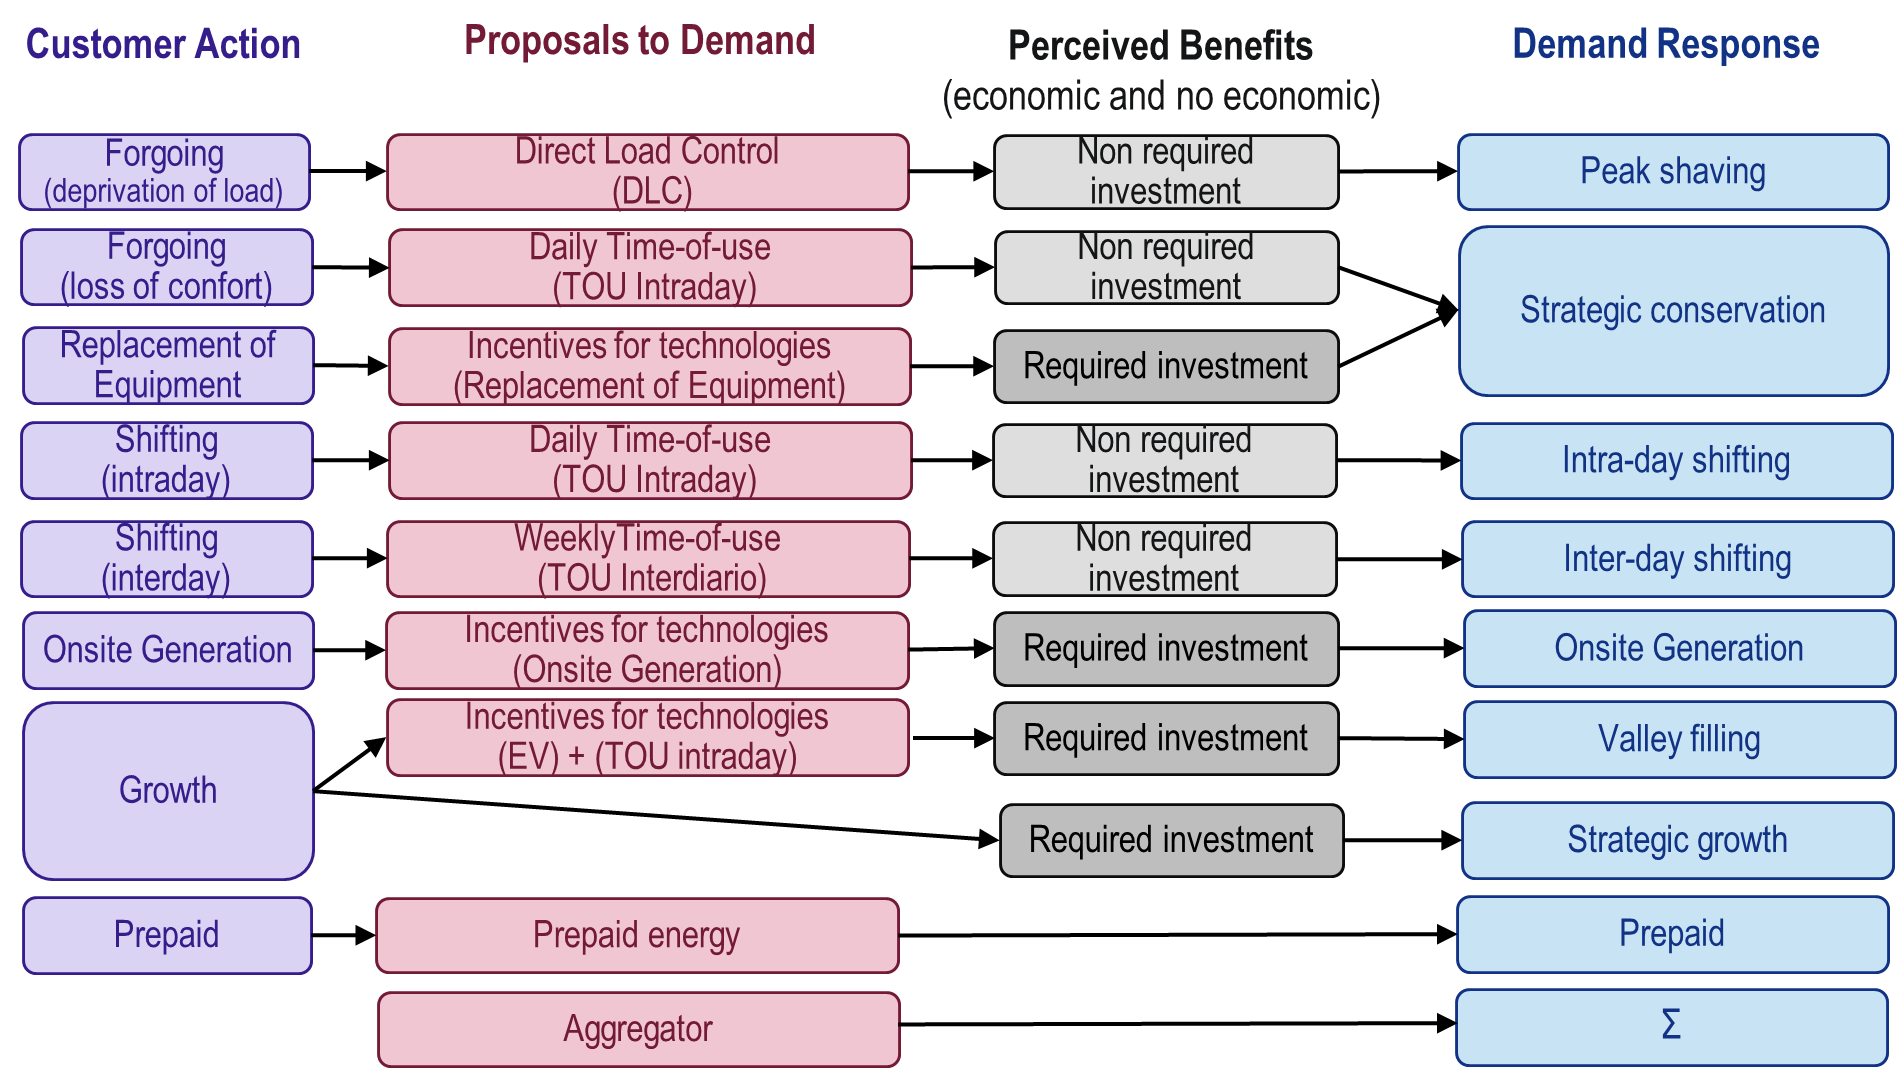
The following provides the model conceptualization of DSM strategies to be implemented, the model seeks to globally quantify each response which could be given by the demand. For this purpose, intrinsic parameters of each customer are considered. This would allow customer characterizing within their context and then it would establish the benefits which would be provided to them in case they embrace utility proposals. This is shown in Figure 1: for each possible customer action, proposals received by customers are considered, then perceived benefit is measured in order to assess demand response.
A utility composed by different kinds of users is referred to as the base case of the model; on each kind of them, DSM strategies are meant to apply. Each kind of customer was selected as a typical case due to their distinctive features that would respond to the strategy adopted. Each group of users’ percentage rates of the total utility users had been allotted taking real data from XM [
A fuzzy logic concept-based network was designed to resolve the benefit-cost analysis. The overall aim of the network is to support customer decision-making process for implementing actions that modify his/her consumption habits and that involve an investment. The network includes quantifications related to cost-benefit viability, non-economic and economic benefits, global benefits, incentives and customer economic capacity.
4. MATHEMATICAL MODELING WITH MODELICA
A mathematical model, that interrelates variables, parameters and actions mentioned earlier, has been set up, with the purpose of quantifying different relations inside the qualitative model. The model makes it possible to assess classic Response Demand techniques. Implementation on Modelica language includes:
1) Daily consumption: Consumption has been modelled on the different hourly segments of one day; consumption inside each segment is kept constant. consumption of each segment varies over time t, measured in months. Daily energy e(t) is defined in (1).
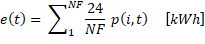
Where NF is the number of hour bracket, p(i,t) is the power consumption in hour bracket i, at time t.
Typical load curve could be subject to seasonal changes, that is, changes which occur once a year, may affect the shape and amplitude of the load curve.
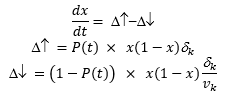
2) Actions: these are modelled as first-rate dynamic systems, with a growth rate of δ, measured in 1/months. All actions shown in Figure 1 are included. For example, in (2) exponential growth is modeled at a growth rate δc. If δc is negative, it is a contraction of consumption.
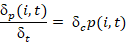
3) Action adoption rate: Dynamic action models have an action adoption rate by parameter δ. Each action has its own parameter that depends on energy culture, in order to represents the fact that a lack of energy culture would slow down the adoption of each action. Action adoption rate δc p (i, t) is defined in (2)
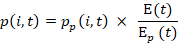
4) Scaled-up load curve: A prototype of the load curve defined by pp(i, t) is up-scaled using (3), where Ep(t) is the energy calculated from the prototype curve (area under a curve). E(t) is the energy consumed by the customer.
5) Scaled-up tariff schemes: A prototype of tariff scheme defined by fp(i, t), in (4), is upscaled using a scheme where, fmin(t) is the maximum value and fmax(t) is the minimum value:

6) Culture and energy education: This model is built on strong assumptions: (a) Culture refers to the knowledge an individual has on a topic, for example the knowledge an individual has on energy. (b) Knowledge can be quantified by a numerical variable CE(t)  [0, 1]. (c) It is possible to increase knowledge through educational activities. (d) Knowledge growth due to educational activities shows a behavior connoted by logistic function. (e) The lack of educational activities leads to a decreased level of knowledge. (f) The diminishment of knowledge occurs at a lower rate than its growth. In this way, culture is defined by CE(t) using (5).

Where x(t) is an auxiliary variable that keeps a logistic behavior, (6):
In (6)  represents the growth of knowledge,
  represents
  the decrease in knowledge, P(t) is a variable in [0, 1] that represents the presence of an educational action and vk>1 is a factor that slows down the diminishment of knowledge, compared to its growth.
7) Action feasibility: Each user must assess whether to adopt particular action. This is a true or false decision. To get in a point where the customer decides to adopt an action, it is needed that: (a) Utility as part of its portfolio offers to the customers the facilities to implement an action, (b) customer do not have intrinsic barriers to implement it, (c) customer understand how to adopt that action and (d) a positive cost/benefit ratio. The proposed model to assess the feasibility to adopt an action j through boolean variable vj (t) goes as follows in (7):
The previously explained mathematical models were implemented in software using the Object-Oriented Modeling paradigm [
5. MODEL CONSIDERATIONS
In order to illustrate the adaptability of the model in implementation, a base-case analysis was established then some simulations had been designed to focus on the development of future DSM implementation strategies. The considerations involved in the comprehension of the simulations are set out below.
1) Consumption pattern: Historical demand data for Colombia was considered to establish real consumption patterns, this data is available on XM smart data web page. Consumption data from 2013-2016 is considered to perform a characterization of energy demand per hour and then consumption patterns were found for different regions of the country, also, a differentiation between regulated and unregulated users were made. Due to some of them have similarities, a gathering of the most representative patterns was established. In addition, the characterization of load curve from smart metering data from 40.000 customers in Bogota that were classified and aggregated in clusters had been considered [
2) Tariff design: Tariff unit costs [kWh] based on Colombian values were considered. To define the number of pricing periods, the price ratio, price Differential in Two-Period Rates [$] and peak period duration (total hours per day) offered to each type of customer, recommendations from international success stories were taken into account [
3) Base-case: a mockup utility with eight types of customers is simulated to evaluate all demand response strategies. Each type of customer is parameterized to respond only to a DSM strategy, although the model can evaluate several responses from one customer and to combine the evaluation results for that customer.
4) Considered customers: All the simulations shown in this paper have considered residential customers who are capable of intra-day shifting of loads, and residential customers who are capable of inter-day shifting of loads, that is, shifting loads from weekdays to weekends. Intrinsic parameters have been considered for each customer, to enable demand response strategy characterization.
5) Adopted actions: it is considered that each type of customer can adopt different actions aimed to modify his/her consumption. Feasibility to adopt actions related to intra-day shifting of loads and to inter-day shifting of loads from weekdays to weekends according to time-of-use tariffs, are included for this study.
6. MODEL SIMULATIONS
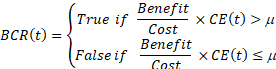
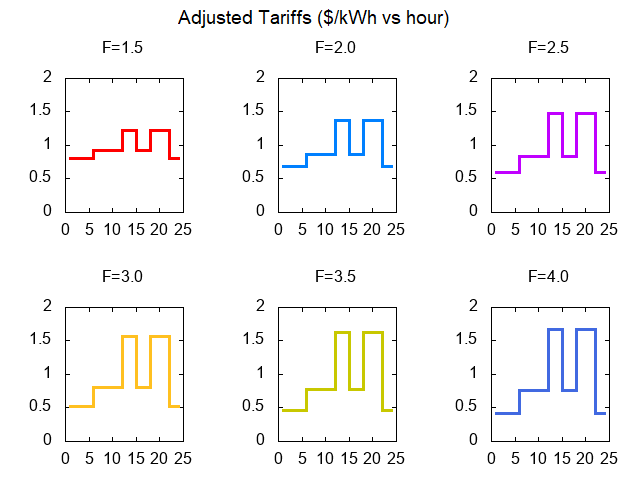
Model simulations show customer response to different strategies as well as the transition that follows to reach that response. The following considerations were considered: Consumption patterns are associated with socio-cultural and characteristics of a particular context, residential option was chosen. Both, consumption shifting and non-reduction can be considered simultaneously. On peak hours, time of use tariff are offered to customers. To assess the impact of each strategy, hour tariffs are changed except those hours where discounted electricity rates occur. So, there is a factor (F) that relates the maximum and minimum tariff values, as shown in Figure 2.
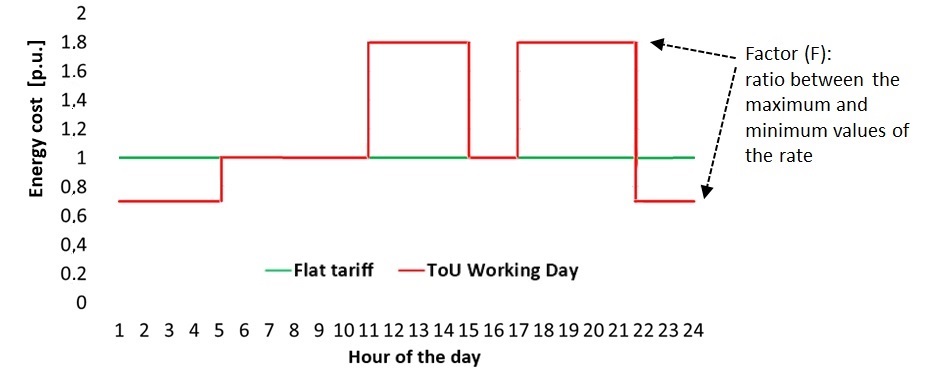
The tariff value must be set at the correct point so on day 1, the customer is charged with the same fee that he/she will be charged with according to the flat tariff rate. Figure 3 shows different tariff factors.
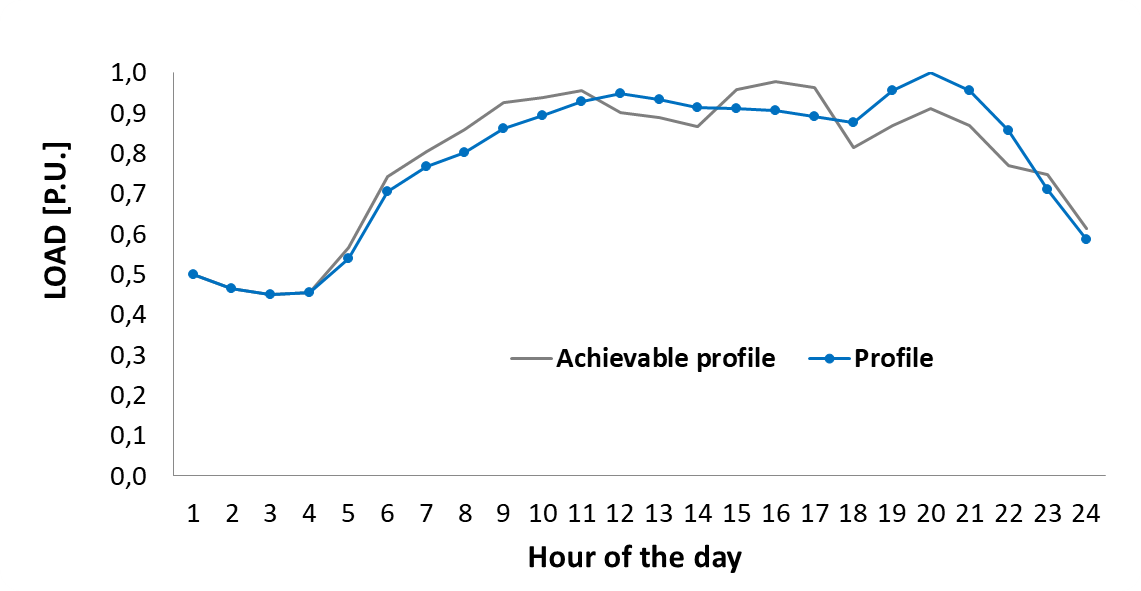
From the consumption profile at the beginning of the simulation, an achievable profile is established which can be reached in response to the strategy, an example of this is shown in Figure 4
.
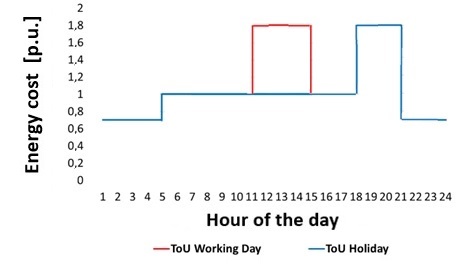
In the case of inter-day shifting strategy, a weekday tariff is set (Monday to Friday) and other tariff is set for weekends and holidays in order to promote customer’s load shifting, as shown in Figure 5:
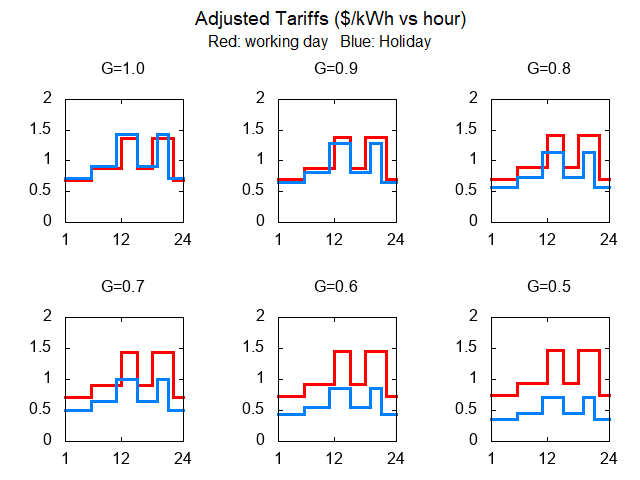
In this case, tariff also must be set at the correct point so on day 1, the customer is charged with the same fee that he/she will be charged with according to the flat tariff rate. Figure 6 shows different tariff factors.
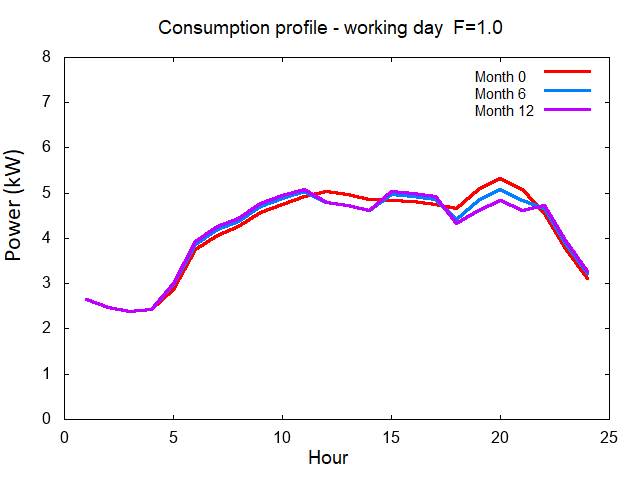
In the inter-day case, from the consumption profile at the beginning of the simulation, an achievable profile is also established which can be reached in response to the strategy, an example of this is shown in Figure 7.
7. RESULTS
For selected DSM strategies, the model developed achieved the following results:
7.1 Intra-day shifting
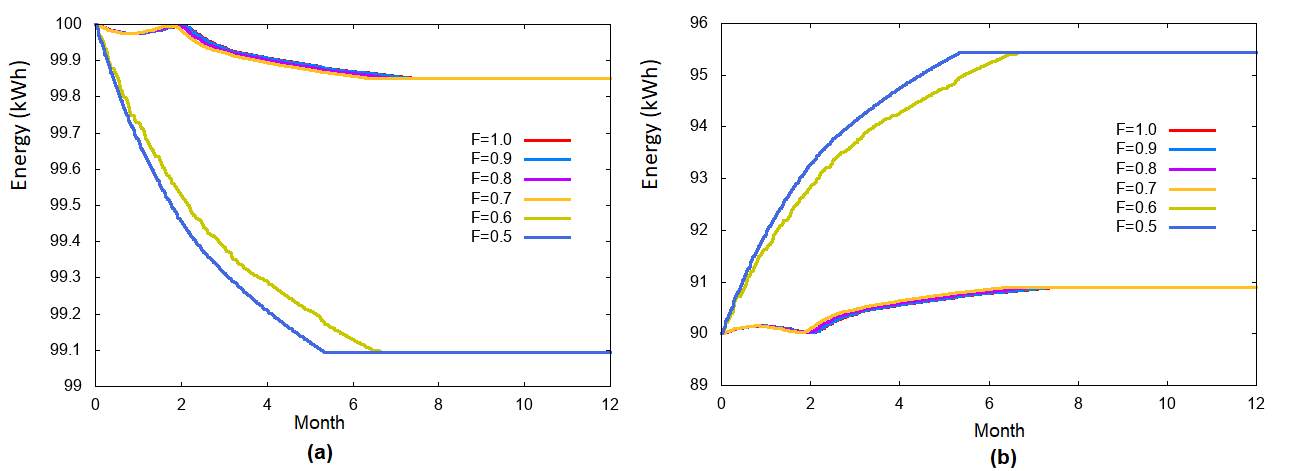
For the customer there is an energy cost reduction over time, in Figure 8 is shown that aggressive regulations (higher factor F on tariff) a saturation effect on price is achieved.
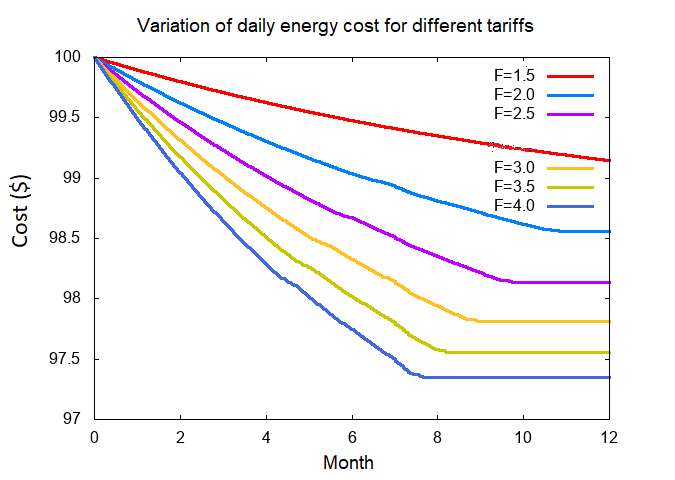
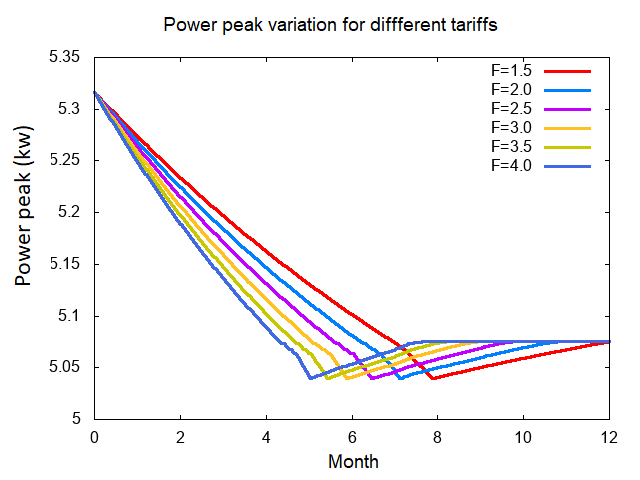
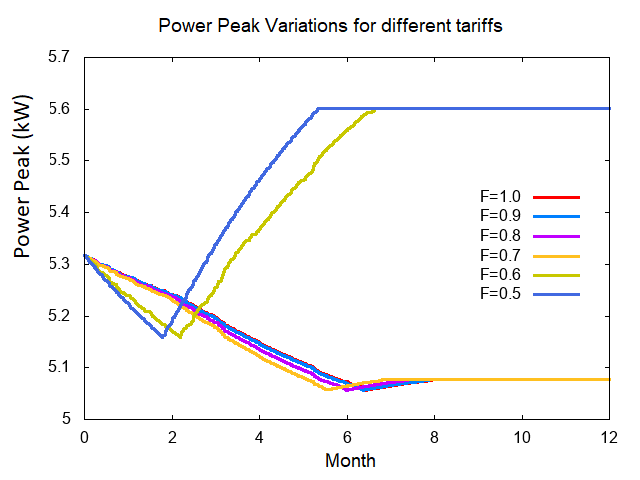
Figure 9 shows that the power system peak gets lower at the beginning but after in a period of between five and eight months, according to tariff factor, the peak rise up again (this occur during other hour of the day).
Load duration curve of the systems is modified due to the implementation of the strategy. Figure 10 shows the results obtained with a mid-term factor F, 2.5.
7.2 Inter-day shifting
Energy cost reduction over time, as shown in Figure 11.
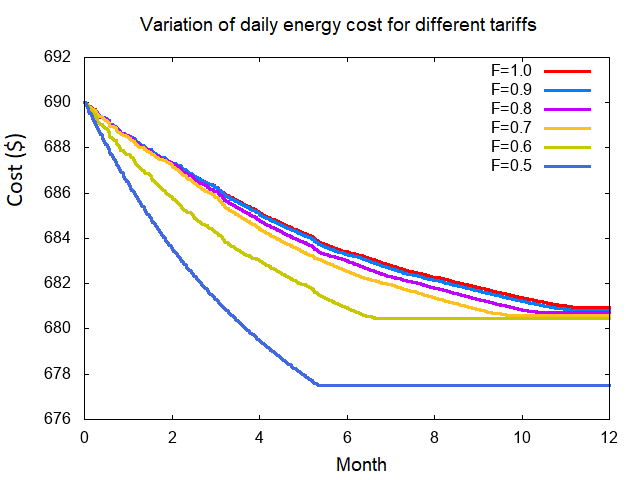
Figure 12 shows that the power system peak gets lower at the beginning and the subsequent behavior depends on tariff factor; on high factor settings, the peak rises up at a different hour of the day. but on low factor settings, the peak slightly rises up after a longer period of time.
Load duration curves of the systems change, both on weekdays and weekends. Figure 13 shows the results obtained with a factor F, 0.5
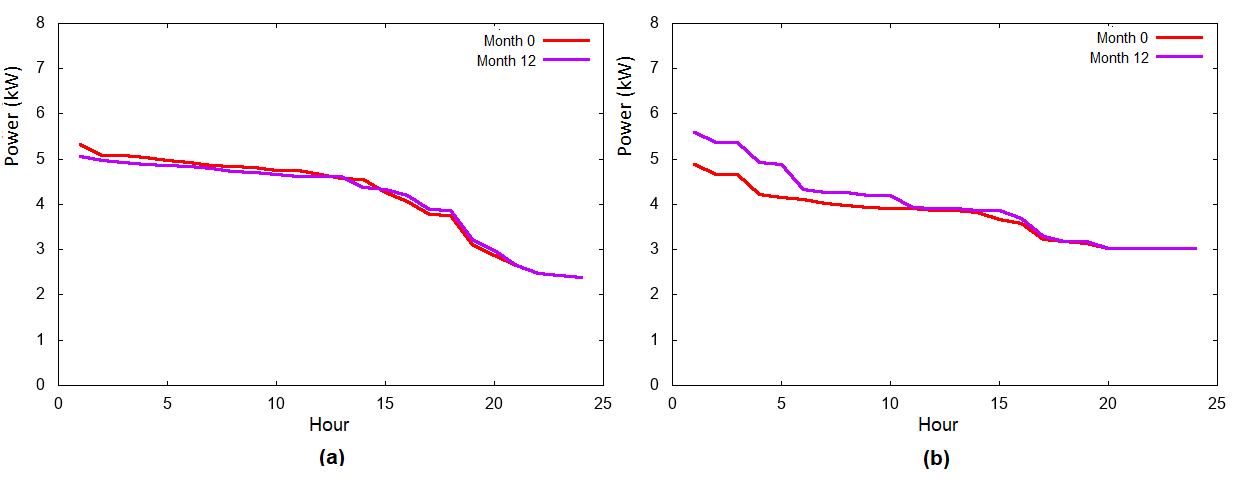
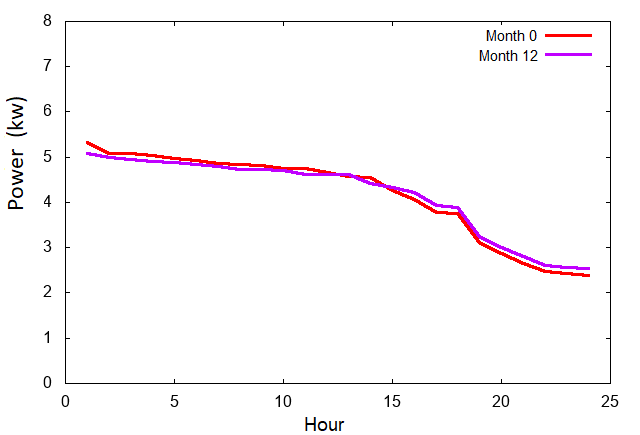
In this case, it is also interesting to analyze consumption shifting between weekdays and weekends, these results are shown in Figure 14. There is a reduction in energy consumption on weekdays and an increase in it on weekends.
8. CONCLUSIONS
A quantitative model to estimate effects of the response Demand-Side Management strategies from a set of users that have been characterized within their context. Se presentó un modelo cuantitativo que permite estimar los efectos de estrategias de Gestión de la Demanda en un conjunto de usuarios que puede caracterizarse de acuerdo a su contexto. The results given by the model includes technical and economic aspects, for example modifications on daily consumption profile, load duration curve, energy consumption and cost. In addition, the model enables us to know the transition that the customer and the system follow to reach the strategy´s response.
Inside the conceptualization of the model, classic Demand Response techniques and proposed new customer actions were included. Energy culture and energy education were considered as essential elements to encourage and accelerate customer response time. A mathematical model was developed to interrelate actors, actions and factors of DSM. The model was implemented in Modelica modeling language. Results were validated.
For intra-day and inter-day shifting strategies, the model enables one to observe the tariff variation effects over customer daily consumption profile and its changes over time. The analysis made on model simulation results allows one to watch the strategy responses from customers in order to improve settings and to optimize them.
For the strategies studied, the main conclusions obtained are: (i) The value of the invoice paid by the client is reduced more quickly in the intra-day case than in the intra-day strategy; in both cases the percentage reductions in cost are similar. (ii) The increase in the rate factor accelerates the customer's response, this relationship varies according to the program offered.
9. ACKNOWLEDGMENTS AND FUNDING
This work was written as part of the doctoral thesis of Sandra Téllez, with the support of grant number 617 from Minciencias in 2014.
CONFLICTS OF INTEREST
None Declared
AUTHOR CONTRIBUTIONS
Sandra Téllez-Gutiérrez contributed to the writing, conceptualization, methodology, to establish model consideration and simulation.
Oscar Duarte-Velasco contributed to the algorithm development and implementation, validation, revision and supervision.
10. REFERENCES
- arrow_upward [1] S. Al-Alawi; S. Islam, “Principles of electricity demand forecasting. I. Methodologies”, Power Eng. J., vol. 10, no. 3, pp. 139–143, Jun. 1996. https://ieeexplore.ieee.org/document/503164
- arrow_upward [2] P. Šparl; D. Kofjač; A. Brezavšček, “The use of quantitative methods for electricity demand forecasting”, in 32nd International Conference on Organizational Science Development. Portorož, Slovenia, 2013. https://www.researchgate.net/publication/260633824_The_use_of_quantitative_methods_for_electricity_demand_forecasting
- arrow_upward [3] C. A. Garcia Botero; W. A. Martínez Botero, “Modelo para la proyección de demanda de energía eléctrica en Colombia”, Unidad de Planeación Minero-Energética (UPME), 2014, p. 18. https://www.asocodis.org.co/docs/xi-jornada/sesion1/1.%20ModeloparalaProyecciondeDemandadeEnergiaElecricaenColombia.pdf
- arrow_upward [4] D. López-García; A. Arango-Manrique; S. X. Carvajal-Quintero, “Integration of distributed energy resources in isolated microgrids: the Colombian paradigm,” Tecnológicas, vol. 21, no. 42, pp. 13–30, May. 2018. https://doi.org/10.22430/22565337.774
- arrow_upward [5] S. Aman; M. Frincu; C. Chelmis; M. Noor; Y. Simmhan; V. K. Prasanna, “Prediction models for dynamic demand response: Requirements, challenges, and insights”, in 2015 IEEE International Conference on Smart Grid Communications (SmartGridComm), 2015, pp. 338–343. https://doi.org/10.1109/SmartGridComm.2015.7436323
- arrow_upward [6] W.-C. Hong, Intelligent Energy Demand Forecasting, Springer London. 2013. https://doi.org/10.1007/978-1-4471-4968-2
- arrow_upward [7] S. Iqbal et al., “A comprehensive review on residential demand side management strategies in smart grid environment”, Sustainability, vol. 13, no. 13, Jul. 2021 https://doi.org/10.3390/su13137170
- arrow_upward [8] D. Valencia-Lopez; S. X. Carvajal-Quintero; J. Pineda-Agudelo, “Design of demand management programs for the efficient use of electricity by industrial users”, Ingeniería y competitivdad. vol. 19, no. 1, pp. 207–218, Jun. 2017. http://www.scielo.org.co/pdf/inco/v19n1/0123-3033-inco-19-01-00207.pdf
- arrow_upward [9] J. D. Molina; L. F. Buitrago; J. A. Zapata, “Design of Demand Response Programs: Customer Preferences Experiences in Colombia”, in 2020 IEEE PES Transmission & Distribution Conference and Exhibition - Latin America (T&D LA), Montevideo, 2020, pp. 1–6. https://doi.org/10.1109/TDLA47668.2020.9326246
- arrow_upward [10] J. Molina; L. Buitrago; S. Téllez; S. Giraldo; J. Uribe, “Demand Response Program Implementation Methodology: A Colombian Study Case”, Trans. Energy Syst. Eng. Appl., vol. 3, no. 1, pp. 13–19, Mar. 2022. https://doi.org/10.32397/tesea.vol3.n1.3
- arrow_upward [11] I. Lampropoulos; W. L. Kling; P. F. Ribeiro; J. van den Berg, “History of demand side management and classification of demand response control schemes”, in 2013 IEEE Power & Energy Society General Meeting, Vancouver, 2013, pp. 1–5. https://doi.org/10.1109/PESMG.2013.6672715
- arrow_upward [12] J. S. Vardakas; N. Zorba; C. V Verikoukis, “A Survey on Demand Response Programs in Smart Grids: Pricing Methods and Optimization Algorithms”, IEEE Commun. Surv. Tutorials, vol. 17, no. 1, pp. 152–178, 2015. https://doi.org/10.1109/COMST.2014.2341586
- arrow_upward [13] M. Hussain; Y. Gao, “A review of demand response in an efficient smart grid environment”, Electr. J., vol. 31, no. 5, pp. 55–63, Jun. 2018. https://doi.org/10.1016/j.tej.2018.06.003
- arrow_upward [14] L. Tronchin; M. Manfren; B. Nastasi, “Energy efficiency, demand-side management and energy storage technologies – A critical analysis of possible paths of integration in the built environment”, Renew. Sustain. Energy Rev., vol. 95, pp. 341–353, Nov. 2018. https://doi.org/10.1016/j.rser.2018.06.060
- arrow_upward [15] United States Department of Energy and United States Department of Energy - DOE, “Benefits of Demand Response in Electricity Markets and Recommendations for achieving them. A report to the United States Congress pursuant to section 1252 of the energy policy act of 2005”, Washington, 2006. https://www.energy.gov/oe/downloads/benefits-demand-response-electricity-markets-and-recommendations-achieving-them-report
- arrow_upward [16] S. Téllez; O. Duarte, “Gestión de la Demanda en redes eléctricas inteligentes: Revisión y futuras estrategias”, En V CIUREE: Congreso Internacional de Eficiencia y Gestión Energética. 2016. https://doi.org/10.13140/RG.2.2.22085.24805
- arrow_upward [17] C. W. Gellings, “The concept of demand-side management for electric utilities”, Proc. IEEE, vol. 73, no. 10, pp. 1468–1470, 1985. https://doi.org/10.1109/PROC.1985.13318
- arrow_upward [18] XM, “Históricos de demanda”. https://www.xm.com.co/consumo/historicos-de-demanda
- arrow_upward [19] UPME-SIMEC, “Sistema de Información Eléctrico Colombiano SIEL. Demanda de energía”, 2021. http://www.siel.gov.co/Inicio/Demanda/tabid/60/Default.aspx
- arrow_upward [20] H. Elmqvist, “A Structured Model Language for Large Continuous Systems”, (Tesis Doctoral), Department of Automatic Control, Lund Institute of Technology, Lund, 1978. https://lup.lub.lu.se/search/ws/files/4602422/8570492.pdf
- arrow_upward [21] P. Fritzson, Principles of Object-Oriented Modeling and Simulation with Modelica 3.3: A Cyber-Physical Approach. Wiley-IEEE Press, 2015.
- arrow_upward [22] M. Association, Modelica Association. https://modelica.org/association
- arrow_upward [23] Modelica, Modelica - A Unified Object-Oriented Language for Systems Modeling Language Specification. Version 3.3. Modelica Association, 2012. https://modelica.org/documents/ModelicaSpec33Revision1.pdf
- arrow_upward [24] P. Fritzson et al., “The OpenModelica Integrated Environment for Modeling, Simulation, and Model-Based Development,” Modeling, Identification and Control., vol. 41, no. 4, pp. 241–295, 2020. https://doi.org/10.4173/mic.2020.4.1
- arrow_upward [25] J. A. Restrepo; S. E. Sierra; J. A. Rosero, “Load curve characterization based on real time measurements: Case of study in Colombia”, in 2018 IEEE PES Transmission & Distribution Conference and Exhibition - Latin America (T&D-LA), 2018, pp. 1–5. https://doi.org/10.1109/TDC-LA.2018.8511768
- arrow_upward [26] MinMinas; Colombia Inteligente; CIAT, “Proyecto Demanda Activa GEI”, 2018. URLhttps://acmineria.com.co/acm/wp-content/uploads/2019/12/Mesa-3-Viernes-13-de-noviembre-2019-191108_GestionActivaDemanda_ColombiaInteligente-3.pdf
- arrow_upward [27] A. Faruqui; R. Hledik; S. Sergici, “A Survey of Residential Time- Of-Use (TOU) Rates”, The brattle group, Nov. 2019. https://www.brattle.com/wp-content/uploads/2021/05/17904_a_survey_of_residential_time-of-use_tou_rates.pdf