Determination of Zones and Tall Structures with the Greatest Number of Lightning Strikes
Determinación de zonas y estructuras elevadas con la mayor cantidad de impactos de rayos
 PDF
PDF
Received: March 18, 2022
Accepted: June 06, 2022
Available: August 04, 2022
J. Mora; J. Rojas-Avellaneda; B. S. Ardila-Murillo; E. Soto-Ríos, “Determination of Zones and Tall Structures with the Greatest Number of Lightning Strikes”, TecnoLógicas, vol. 25, nro. 54, e2376, 2022. https://doi.org/10.22430/22565337.2376
Abstract
High lightning activity sites have been characterized using methodologies based on the spatial occurrence of lightning through parameters such as Ground Flash Density, GFD. This work found the areas with the highest number of lightning strikes (hotspots) in some Colombian cities through a methodology based on the temporal occurrence of lightning. Likewise, the influence of elevated structures on lightning activity in these regions is determined. Polygons of 600 meters on each side were located on the surface of the study cities. Based on lightning information (strokes) provided by the Colombian Network of Total Lightning Detection with LINET technology between 2016 and 2018, the number of impacts per polygon was determined, making it possible to identify the areas in which the incidence of lightning is recurrent. Elevated structures were located in each of the study cities to determine which of them corresponded to hotspots. The results showed that the main hotspots are far from urban areas and that most of these sites coincide with elevated structures. Possible causes of these lightning strikes are also explained, such as meteorological variables, relief, precipitation, and charge distributions in storm clouds. Urbanism is found to have a marked influence on the determination of hotspots and that urbanism and elevated structures increase lightning activity in the study areas.
Keywords: Cloud-to-Ground Lightning strokes, Ground Flash Density (GFD), elevated structures, hotspots, LINET network
Resumen
Los sitios de alta actividad de rayos se han caracterizado utilizando metodologías basadas en la ocurrencia espacial de rayos a través de parámetros como la densidad de descargas a tierra (DDT). A través de una metodología basada en la ocurrencia temporal de rayos, en este trabajo se encontraron los sitios con mayor número de impactos (hotspots) en algunas ciudades colombianas y se determinó la influencia de las estructuras elevadas sobre la actividad de descargas en estas regiones. En la superficie de las ciudades de estudio se ubicaron polígonos de 600 metros de lado y, con base en la información de rayos (strokes) proporcionada por la Red Colombiana de Detección Total de Rayos con tecnología LINET entre 2016 y 2018, se precisó el número de impactos por polígono, lo que permitió identificar las zonas en las que la incidencia de rayos es recurrente. Asimismo, se ubicaron estructuras elevadas en cada una de las ciudades de estudio, estableciéndose cuáles de ellas correspondían a hotspots. Los resultados mostraron que los principales hotspots se ubican alejados de las áreas urbanas y que la mayoría de estos sitios coinciden con estructuras elevadas. También se explican las posibles causas de impactos de rayos, tales como variables meteorológicas, relieve, precipitaciones y distribuciones de carga en nubes de tormenta. Se concluye que el urbanismo tiene una marcada influencia en la determinación de los hotspots, y que el urbanismo y las estructuras elevadas aumentan la actividad de los rayos en las áreas de estudio.
Palabras clave: Relámpagos de nube-a-tierra, densidad de descargas a tierra (DDT), estructuras elevadas, impactos de rayo, red LINET.
1. INTRODUCTION
Global lightning activity is variable due to changes in the flash rate per thunderstorm, the number of thunderstorms, or both [
Research has found that of the 500 lightning hotspots on earth, 283 are located in Africa, 87 in Asia, 67 in South America, 53 in North America, and 10 in Oceania.
However, the site with the highest number of flashes per square kilometer per year is located on Lake Maracaibo to the north of Venezuela, which are recorded in total 233 flashes/km2/year [
In Africa, most high-frequency lightning sites were located in a central region of the continent in the Mitumba mountains in the Congo, and in Guinea [
Coldspots were also found on this continent, which implies a minimum vulnerability to human impacts and some industries; they were located on the Caribbean Sea side of Central America [
In South America, the main hotspots were located near or in the valleys or foothills of the northern Andes Mountains in Colombia, and Venezuela [
Seven of the ten places with the highest lightning flash rate density in this continent are in Colombia since its territory is located in the intertropical convergence zone where the southeast and northeast trade winds converge. The three mountain ranges that cross the country's surface serve as a natural barrier [
Forming points of high lightning activity in specific sites such as Cáceres, El Tarra, Norcasia, Majagual, and Santa Rosa [
Other studies in Colombia have related the sites of high lightning activity with the variation of the peak lightning current, finding an inverse relationship between the Cloud-to-Ground Lightning Flash Density (CGLFD) and Peak Current [
While in winter storms in mid-latitudes, it is observed how elevated structures correspond to very high lightning activity points, tropical regions such as Colombia present very high Ground Flash Density (DDT) values. So, using this parameter, it is difficult for activity at a specific point or on any structure to exceed the average for the region. Therefore, the identification of Hotspots is not evident, nor is the influence of elevated structures located there. So far, the sites of high lightning activity in Colombia have been determined based on the spatial occurrence of CG flashes through the DDT parameter, and the temporal occurrence has not been taken into account as proposed in this work. Nor have been found or characterized these specific sites in the analysis cities with the proposed resolution. Since the places of high lightning activity have been found using squares of 3 and 1 km on each side.
Knowledge of this natural phenomenon and its characterization is of the utmost importance since it allows the design of more robust protection systems and the elaboration of plans to protect human lives and mitigate material damage and economic losses. The above, since lightning strikes make vulnerable protection devices on tall structures and life support and assistance systems, cause outages in transmission and distribution lines, compatibility problems in communications networks, and directly affect different aviation systems, sports spaces, or scenarios with a high concentration of people [
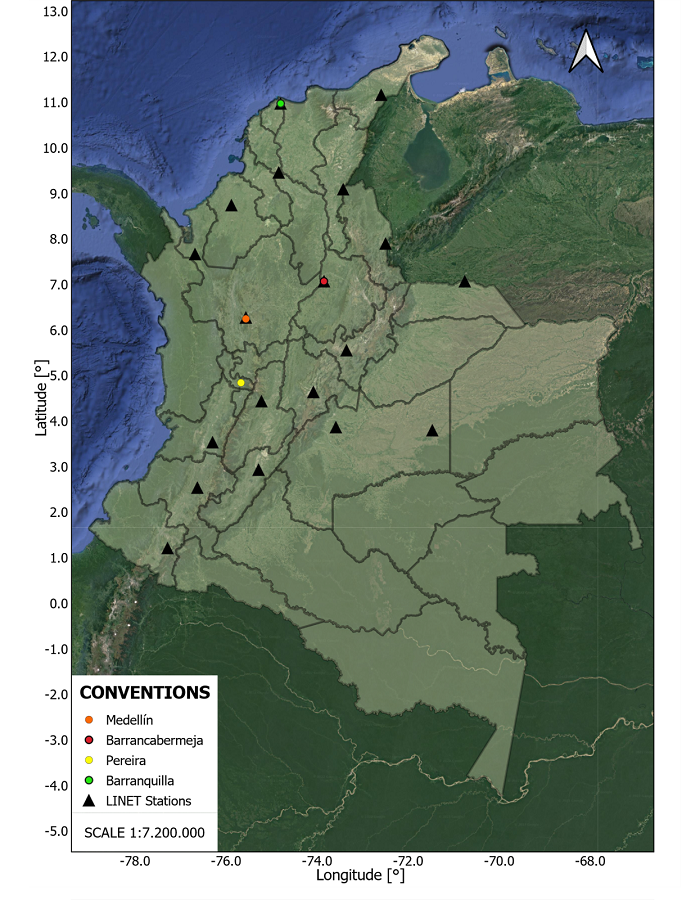
This paper determines the places with the greatest amount of lightning strokes in specific country cities, like Medellin, Barranquilla, Barrancabermeja, and Pereira. The above is based on information provided by the Colombian Total Lightning Detection Network with LINET technology. It starts from the location of possible lightning event places such as elevated structures, public places, and open spaces. We propose that the areas with the tallest structures in each study city correspond to the sites with the highest incidence of lightning [
1.1 Lightning flashes in Colombia
1.1.1 Keraunic Level (KN) and Ground Flash Density (GFD)
The first characterization of lightning parameters was made between 1974 and 1988 with the implementation of the first map that indicates the keraunic level (KN) [
 (1)
(1)Where k and a are constants valid only for where the expression was raised. This parameter has been determined through direct measurements with lightning counting equipment or locators and empirical equations that relate the Ground Flash Density with the keraunic level [
1.2. Colombian Total Lightning Detection Network with LINET technology
In September 2011, the Colombian Total Lightning Detection Network with LINET technology came into operation. LINET is a system made up of magnetic field antennas that operate in the low frequency (LF) and very low frequency (VLF) and provides for each stroke parameters such as the time of occurrence, latitude, longitude, the amplitude of the return current, polarity, and type (cloud to ground or intracloud) using arrival time techniques [
With this distribution, the detection efficiency of CG strokes is 99 % in the central areas of the country, 95 % for more remote regions such as the Pacific, the Caribbean region, the western Orinoquía, and Bajo Cauca, 90- 80 % for the eastern Orinoquía and the southwest of the country, and 60 % for the Amazon. These efficiency values decrease considerably for IC strokes and vary between 80 and 20 %. The LINET network average location error is close to 300 meters [
Each station records the magnetic field waveform and its timestamp when a lightning flash occurs. The detection data is sent in real-time by each station to a Central Processing Unit. The lightning detection algorithm that identifies and determines the discharge parameters is executed. Each measurement station comprises a magnetic field antenna that operates in the VLF/LF frequencies, a GPS antenna, and a signal processing unit. With this network, it has been possible to build updated maps of the GFD in Colombia, and important studies have been made in which the variation of GFD is related to the topography, showing that the sites with the highest lightning activity coincide with the foot of mountains and valleys [
2. METHODOLOGY
2.1 Selection of the departments and their respective cities of analysis
In Colombia, the narrow mountain ranges, mainly the Oriental (Northwest of Cundinamarca and Southwest of Boyacá) and Central (Northeast of Caldas, Southeast of Antioquia), and winds that approach them, mark the primary influence on the Ground Flash Density. Therefore, the study cities' first criterion was their geographical location, evaluating height above sea level, proximity to mountain ranges, and terrain topography. According to the methodology proposed by NTC 4552-2 [
2018 coordinates geographic meters above sea level Ground Flash Density
GFD built area in km2 and nearby airport. Source: created by the authors.
| City | Barranquilla | Medellín | Pereira | Barrancabermeja |
| Latitude | 10.990 | 6.250 | 4.810 | 7.300 |
| Longitude | -74.800 | -75.600 | -75.700 | -73.500 |
| Population | 1 232 766 | 2 508 452 | 476 660 | 201 616 |
| Altitude | 18 | 1495 | 1411 | 75 |
| GFD | 2.8 | 11.3 | 4 | 2.50 |
| Area [km2] | 35 | 86 | 16 | 15 |
| Airport | 1 | 1 | 1 | 1 |
2.2 Selection of elevated structures and event locations, classification, and geographic location
The occurrence is considered three large groups of lightning events, impacts on elevated structures, public and open spaces. The events that affected tall structures occurred in houses and buildings, airports, and others. Public places correspond to the public highway, stadiums, beaches, parks, and cemeteries. Finally, the events in open spaces like farms, rivers, seas, and lagoons are based on the classification in [
2.3 List of impact data from the LINET network and geographic location using the QGIS software
The LINET network has records of cloud-to-ground lightning strokes in the national territory from 2011 to 2019. For this work were considered the years 2016, 2017, and 2018.
Since the information provided covered a larger perimeter than the area of the studied cities, were discarded those impacts that did not affect the analysis area using the (clip) tool of the QGIS program, which allows an overlay between the city map layer and the lightning strokes layer. In this way, the program enables spatially locating each lightning stroke on the study surface.
2.4 Location of 600-meter polygons in the municipalities to be analyzed
Using the point analysis tool of the QGIS program, which allows each rectangular polygon to be enumerated and the number of impacts to be individualized, it was possible to locate the Hotspot areas and identify the number of lightning strikes at these sites.
A grid of 600 meters on each side was created on the surface of the municipalities of interest. Each box approximates circumferences with a radius of 300 meters that corresponds to the average accuracy of the LINET network in the study area. It is avoided using circumferences since when locating circles tangent to each other, there would be areas outside of them that would not be analyzed. Therefore, we use a grid where each circle is circumscribed. In this way, areas that remain outside of circles are also analyzed.
Thus, the grid gives more accurate results since the box area is smaller than the one used in the determination of the Density of Discharges to Earth, which shows with less uncertainty the influence of the topography of the land and the presence of structures high in lightning activity.
Likewise, the number of strokes located within the 600-meter coverage of the rectangular polygon, where elevated structures located received impacts considered direct due to the network location error, was determined.
3. RESULTS
3.1 Barranquilla
Barranquilla is a coastal city located in the north of the country. It has a keraunic level of 84.5 thunderdays per year and a Ground Flash Density of 2.77 flashes per square kilometer per year [
latitude, longitude, meters above sea level (MASL), and height in meters
Source: created by the authors.
| Structure | Latitude | Longitude | MASL [m] | Height [m] |
| Luxe Tower | 11°0'26.76" N | 74°48'39.95" O | 80 | 175 |
| Mirage 57 | 11°0'29.21" N | 74°48'33.18" O | 78 | 163 |
| Grattacielo | 11°0'30.76" N | 74°48'34.06" O | 71 | 154 |
| The Icon | 11°0'25.09" N | 74°48'20.31" O | 55 | 148 |
| Illuminatta | 11°0'29.65" N | 74°48'35.14" O | 71 | 145 |
| Solara Tower | 11°0'28.50" N | 74°48'34.14" O | 73 | 142 |
| Green Tower | 11°0'21.98" N | 74°48'11.13" O | 50 | 101 |
| Hotel B / keel | 11°0'13.10" N | 74°48'40.39" O | 80 | 92 |
| Malibu | 11°0'12.14" N | 74°48'44.80" O | 90 | 80 |
| Metrop. Stadium | 10°55'36.93" N | 74°48'2.37" O | 51 | 43 |
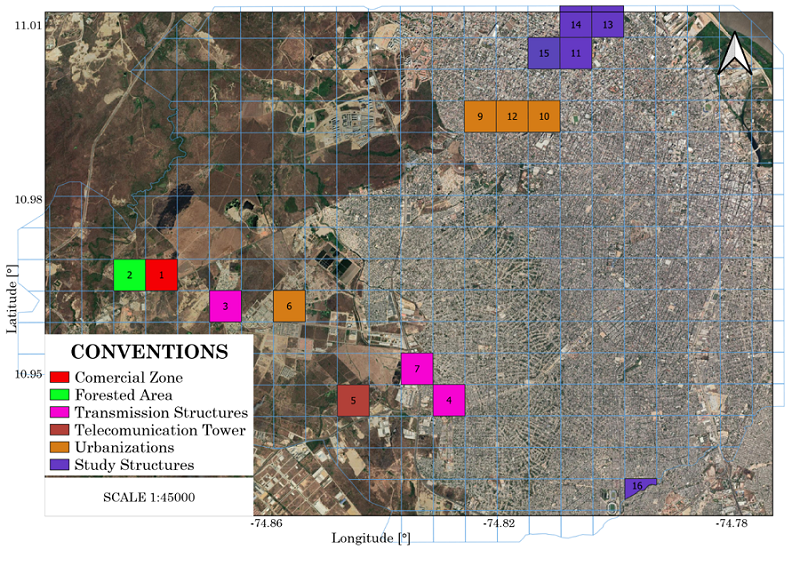
Indeed, Barranquilla registered the highest incidence of lightning in the studied structures since it has high periods of rain due to movements in the different layers of the atmosphere. Additionally, this city is conditioned by its location, in an intermediate zone between two climatic extremes: the arid north (La Guajira desert) and the humid region to the south that begins in the middle of Magdalena valley and is influenced by the Caribbean Sea, which favors a cyclonic movement and temperature [
in Barranquilla city. The bold sites correspond to tall structures. The amounts in
parentheses correspond to the number of floors. Source: created by the authors.
| Pos. | Type of area | Strokes | Coordinate | Height [m] |
| 1 | Commercial zone | 384 | 10.96°, -74.87° | 5 |
| 2 | Wooded zone | 352 | 10.96°, -74.87° | - |
| 3 | Transmission struct. | 291 | 10.96°, -74.86° | 45 |
| 4 | Transmission struct. | 264 | 10.94°, -74.83° | 45 |
| 5 | Telecom. tower | 213 | 10.94°, -74.84° | 35 |
| 6 | Urbanization (6) | 207 | 10.95°, -74.85° | 18 |
| 7 | Commercial zone | 188 | 10.94°, -74.83° | 10 |
| 8 | Transmission struct. | 188 | 10.94°, -74.83° | 45 |
| 9 | Urbanization (10) | 176 | 10.99°, -74.81° | 30 |
| 10 | Pumarejo Bridge | 176 | 10.95°, -74.75° | 16 |
| 11 | Urbanization (14) | 167 | 10.99°, -74.82° | 42 |
| 12 | Urbanization (16) | 136 | 10.99°, -74.81° | 48 |
| 13 | B / keel Hotel (30) | 107 | 11.00°, -74.81° | 92 |
| 14 | Urbanization (13) | 103 | 10.99°, -74 .81° | 39 |
| 15 | Green Towers (34)The Icon (50) | 76 | 11.00°, -74.80° 11.00°, -74.80° | 101 148 |
| 16 | Grattacielo (52)Mirage 57IluminattaSolara TowerLuxe TowerMalibu Building | 71 | 11.00°, -74.80° 11.00°, -74.80° 11.00°, -74.80° 11.00°, -74.80° 11.00°, -74.81° 11.00°, -74.81° | 154 163 145 142 175 80 |
With geographical coordinates of 10.96° -74.87°, Villa Celia has the highest incidence of lightning strokes, with 384 impacts. Likewise, transmission structures and communication towers are structures with an increased incidence of lightning. In Barranquilla, two urban structures are highlighted: the Pumarejo Bridge and the Barranquilla Plaza Hotel, since they presented a high number of impacts of 176 and 107, respectively. The area known as Platanal El Peludo is a place with many buildings, such as Transmission Structures (items 3 and 4) and Telecommunication Tower (item 5), registering that they receive many impacts of 291, 264, and 213, respectively.
Compared with the structures under study (see the ones in bold) that have a higher height, it is evident that in this case, the amount of lightning strokes does not increase with the height of the structures.
Figure 2 shows the geographical location of the elevated structures and hotspots of the city of Barranquilla. The number in the box means the position in the elevated structure table. The elevated structures and specific sites found are located by colors, study structures (purple color), forested areas (green color), buildings (blue color), urbanizations (orange color), transmission structures (red color), refineries (color coffee), and telecommunication towers (pink), respectively. Of the 16 hotspots in Barranquilla, ten correspond to elevated structures (either an elevated study structure, a transmission tower, or a telecommunications antenna), 3 to urbanizations, 2 to commercial areas, and one to wooded areas.
Source: created by the authors.
3.2 Medellín
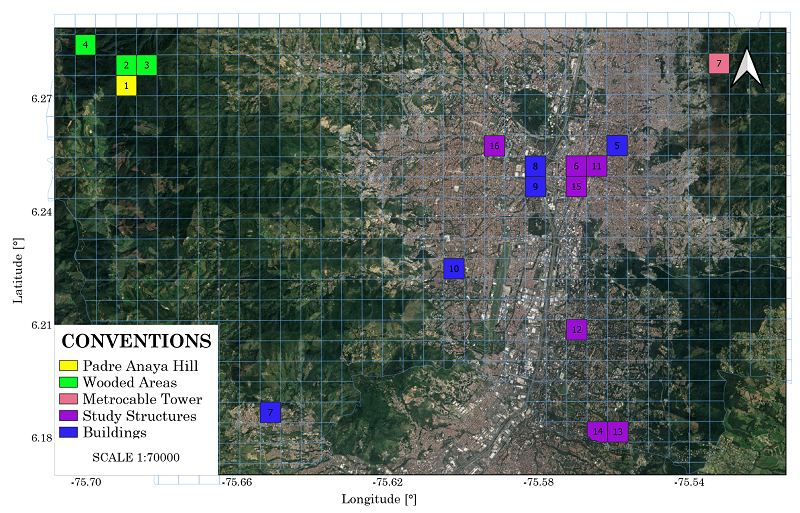
Medellín is a city located in the northeast of the country. It has 158 thunderdays per year and a Ground Flash Density of 11.3 flashes per square kilometer per year [
Medellín is the city with the highest incidence of lightning strokes in Colombia, considering its geography facilitates this type of phenomenon. It is located in the geographical center of the Aburrá Valley. Additionally, the mountain ranges that enclose the city give rise to the formation of various microclimates. Indeed, being in the middle of mountains cause daytime warming that favors the development of large cumulus vertical clouds [
above sea level (MASL), and height in meters. Source: created by the authors.
| Structure | Latitude | Longitude | MASL [m] | Height [m] |
| Coltejer Building | 6°14'59.76" N | 75°33'58.44" O | 1492 | 175 |
| Torre del Café | 6°14'55.60" N | 75°34'7.52" O | 1495 | 160 |
| Cámara de comercio | 6°14'59.11" N | 75°33'49.76" O | 1505 | 139 |
| Veracruz Tower | 6°11'2.13" N | 75°33'40.80" O | 1742 | 121 |
| Q Concept Tower | 6°10'57" N | 75°33'55.19" O | 1721 | 111 |
| La Libertad Tower | 6°14'3.25" N | 75°34'29.03" O | 1470 | 105 |
| Popular Bank | 6°14'58.09" N | 75°34'3.19" O | 1494 | 102 |
| Business Center Square | 6°12'26.03" N | 75°34'19.28" O | 1527 | 100 |
| Colseguros Building | 6°15'2.20" N | 75°33'48.60" O | 1498 | 97 |
| Atanasio Girardot Stadium | 6°15'24.31" N | 75°35'25.56" O | 1488 | 42 |
Medellín city. The bold sites correspond to tall structures. The amounts in parentheses
correspond to the number of floors. Source: created by the authors.
| Pos. | Type of area | Strokes | Coordinate | Height [m] |
| 1 | Padre Amaya hill | 417 | 6.27°, -75.68° | 30-45 |
| 2 | Mountainous zone | 365 | 6.27°, -75.68° | - |
| 3 | Wooded area | 260 | 6.28°, -75.68° | - |
| 4 | Wooded area | 100 | 6.28°, -75.69° | - |
| 5 | Santa Helena Tower (21) San Miguel Tower (15) Prado Tower (21) | 95 | 6.25°, -75.55° 6.25°, -75.56° 6.25°, -75.55° | 60-65 45-50 62-65 |
| 6 | Popular bank | 72 | 6.24°, -75.56° | 102 |
| 7 | Building under construction (18) Metrocable tower | 65 | 6.18°, -75.65° 6.27°, -75.53° | 50-55 - |
| 8 | Nuevo Naranjal Tower (22) | 54 | 6.25°, -75.58° | 50-55 |
| 9 | El conquistador (11) | 53 | 6.24°, -75.58° | 27-33 |
| 10 | Torres de Compostela (12) | 50 | 6.22°, -75.60° | 33-36 |
| 11 | Coltejer BuildingCámara de comercioColseguros Building | 49 | 6.24°, -75.56° 6.24°, -75.56° 6.25°, -75.56° | 175 139 97 |
| 12 | Business center square | 33 | 6.20°, -75.57° | 100 |
| 13 | Veracruz Tower | 31 | 6.18°, -75.56° | 121 |
| 14 | Q concept Building | 30 | 6.18°, -75.56° | 111 |
| 15 | Torre del café Building | 26 | 6.24°, -75.56° | 160 |
| 16 | Atanasio Girardot Stadium | 24 | 6.25°, -75.59° | 42 |
The areas with the greatest number of strokes are not located in the city’s urban area. The mountainous areas have the most significant affectation because the city is the center of the Aburrá Valley, surrounded by mountainous areas where these phenomena occur [
Source: created by the authors.
Additionally, other structures found during the investigation, such as Towers Santa Helena and San Miguel, and Prado, have lower heights than the structure’s study (see the ones in bold), but they registered many strokes: 95. In contrast, the Popular bank, with a height of 102 m, was struck by 72 impacts. A tower of the Metro Cable system with coordinates 6.277289 °, -75.531284 ° was found within the structures.
Due to its geographical location, the mountainous area presented 65 lightning strokes, being the seventh zone with the highest lightning activity.
Of the 16 hotspots in Medellín, twelve correspond to elevated structures (either an elevated study structure, a transmission tower, or a telecommunications antenna) and four to wooded areas.
3.3. Pereira
Pereira is a city in Colombia’s coffee mountainous region of western Colombia with a keraunic level of 84.5 thunderdays per year and a Ground Flash Density of 4 flashes/km2/year [
sea level (MASL), and height in meters. Source: created by the authors.
| Structure | Latitude | Longitude | MASL [m] | Height [m] |
| El Otún Newspaper | 4°48'44.53" N | 75°41'41.01" O | 1415 | 95 |
| Pinares de Alameda Build. | 4°48'3.83" N | 75°41'8.86" O | 1428 | 90 |
| Pinamar E / C Building | 4°48'9.63" N | 75°41'5.33" O | 1423 | 80 |
| Comercio Bank | 4°48'48.66" N | 75°41'38.68" O | 1413 | 75 |
| E / C Trilogy | 4°48'0.98" N | 75°41'33.96" O | 1424 | 65 |
| Perla del Otún Building | 4°48'44.94" N | 75°41'41.12" O | 1418 | 63 |
| Pinares Campestre Build. | 4°48'2.45" N | 75°41'5.73" O | 1438 | 63 |
| Parque Bolívar Building | 4°48'55.15" N | 75°41'40.09" O | 1425 | 60 |
| Villegas Stadium | 4°48'16.82" N | 75°45'8.77" O | 1269 | 26 |
| Matecaña Int Airport. | 4°48'54.40" N | 75°44'10.90" O | 1343 | 28 |
Table 7 presents the study of the zones with the greatest amount of lightning impacts, like urbanizations, banks, telecommunication towers, transmission structures, the Hernán Ramírez Villegas Stadium, the Matecaña International Airport, and forested areas. As we can see, the area with the highest amount of lightning strokes is a wooded area called Pueblo Nuevo, with 100 impacts. This is far from the city with geographic coordinates of 4.84°, - 75.72°. The same behavior is seen for the first three positions of Table 7, which allows us to conclude that in this city, the sites with the greatest amount of lightning impacts do not correspond to the one’s where elevated structures are located. Additionally, it was possible to identify a transmission tower with 43 impacts.
in Pereira city. The bold sites correspond to tall structures. The amounts in parentheses
correspond to the number of floors. Source: created by the authors.
| Pos. | Type of zone | Strokes | Coordinate | Height [m] |
| 1 | Wooded area | 100 | 4.84°, -75.72° | - |
| 2 | Wooded area | 66 | 4.73°, -75.60° | - |
| 3 | Wooded area | 60 | 4.78°, -75.70° | - |
| 4 | Building (11) | 60 | 4.80°, -75.68° | 33 |
| 5 | Núcleo Tower (8) | 60 | 4.80°, -75.68° | 24 |
| 6 | Pinares de alameda | 51 | 4.80°, -75.684° | 90 |
| 7 | Building (8) | 50 | 4.80°, -75.680° | 24 |
| 8 | Telecom. tower | 48 | 4.81°, -75.76° | 40 |
| 9 | Building (7) | 46 | 4.80°, -75.72° | 21 |
| 10 | Building (9) | 44 | 4.80°, -75.69° | 27 |
| 11 | Transmission Tower | 43 | 4.79°, -75.67° | 40-45 |
| 12 | Building (21) | 43 | 4.82°, -75.69° | 63 |
| 13 | Pinares campestre | 43 | 4.80°, -75.68° | 63 |
| 14 | -Perla del Otún-Triología-Comercio Bank-Parque Bolívar | 41 | 4.81°, -75.69° 4.80°, -75.69° 4.81°, -75.69° 4.81°, -75.69° | 63 65 75 60 |
| 15 | Pinamar Building | 27 | 4.80°, -75.68° | 80 |
| 16 | -El Otún newspaper-Villegas Stadium-Matecaña Airport | 25 | 4.81°, -75.693° 4.81°, -75.69° 4.81°, 4.81° | 60 95 60 |
Figure 4 shows the geographical location of the elevated structures and hotspots in the city of Pereira.
Source: created by the authors.
Of the 16 hotspots in Pereira, thirteen correspond to elevated structures (either an elevated study structure, a transmission tower, or a telecommunications antenna) and three to wooded areas.
3.4. Barrancabermeja
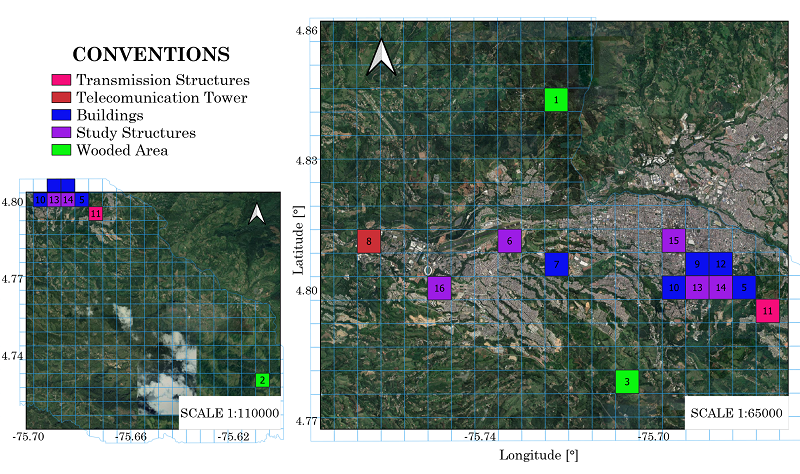
Barrancabermeja is a city located on the shore of the Magdalena River in the west of the department of Santander. It has a keraunic level of 84.4 thunderdays per year and a Ground Flash Density of 10 flashes/km2/year Barrancabermeja [
longitude, meters above sea level (MASL), and height in meters
Source: created by the authors.
| Structure | Latitude | Longitude | MASL [m] | Height [m] |
| Super Star Hotel | 7°3'37.62" N | 73°52'9.40" W | 88 | 48 |
| Terzetto Living | 7°3'37.59" N | 73°52'9.40" W | 84 | 43 |
| Portobello Cond | 7°3'51.33" N | 73°51'16.83" W | 85 | 43 |
| Plaza San Pedro | 7°4'17.51" N | 73°51'26.26" O | 81 | 43 |
| Barvento | 7°3'39.24" N | 73°51'36.93" O | 85 | 41 |
| Park 48 | 7°3'31.63" N | 73°51'18.62" O | 84 | 40 |
| Palmetto Cond. | 7°4'32.33" N | 73°51'3.27" O | 86 | 37 |
| San Francisco Towers | 7°3'38.29" N | 73°50'54.16" O | 80 | 33 |
| Vivero Club | 7°2'26.71" N | 73°50'6.48" W | 96 | 33 |
| San Silvestre Shopping Mall | 7°4'1.65" N | 73°51'28.27" W | 83 | 27 |
The data analysis of elevated structures determined that the place with the greatest amount of lightning impacts is a wooded area with 99 strokes. This area is called Chinchorrera, located in the limits of Yondó and on the banks of the Magdalena River. In this area, a high density of the forested regions is concentrated. It was called this way since it is impossible to determine the existence of structures on this site. The abundance of vegetation is visible since the exploration through Google Street View does not allow us to see the terrain in more detail.
Table 9 shows the areas with the highest lightning activity in the municipality organized from highest to lowest, highlighting the areas with the elevated structures again in bold. From the obtained results, the San Francisco Tower was the structure with the highest amount of lightning impacts of the structures under analysis, with 62 strokes. However, it does not correspond to the tallest structure of those analyzed, such as the 48-meter-high SuperStar Hotel, which presents 46 impacts.
Barrancabermeja city. The bold sites correspond to tall structures. The amounts in
parentheses correspond to the number of floors. Source: created by the authors.
| Pos. | Type of zone | Strokes | Coordinate | Height [m] |
| 1 | Wooded area | 99 | 6.87°, -74.06° | - |
| 2 | Wooded area | 90 | 6.91°, -74.02° | - |
| 3 | Wooded area | 85 | 6.91°, -74.01° | - |
| 4 | Wooded area | 80 | 6.90°, -74.00° | - |
| 5 | Transmission Tower | 76 | 7.08°, -73.89° | 40-45 |
| 6 | Urbanization | 76 | 7.05°, -73.81° | 10 |
| 7 | Wooded area | 65 | 7.07°, -73.83° | 20 |
| 8 | Wooded area | 63 | 7.10°, -73.84° | - |
| 9 | Transmission Tower San Francisco Tower Telecom. Tower Building (8) Refinery | 62 | 7.07°, -73.89° 7.06°, -73.84° 7.06°, -73.84° 7.06°, -73.84° 7.07°, -73.88° | 40-45 33 40 24 - |
| 10 | Urbanization | 58 | 7.07°, -73.85° | - |
| 11 | Building (5) Plaza San Pedro | 55 | 7.07°, -73.85° 7.06°, -73.84° | 15 43 |
| 12 | Barvento BuildingPalmetto CondSan Silvestre SM | 52 | 7.06°, -73.86° 7.07°, -73.85° 7.06°, -73.85° | 41 37 27 |
| 13 | Urbanization (5) | 50 | 7.06°, -73.86° | 15 |
| 14 | Super Star Hotel | 46 | 7.06°, -73.86° | 48 |
| 15 | Terzetto Living | 44 | 7.06, -73.86° | 43 |
| 16 | Transmission Tower | 43 | 7.08°, -73.90° | 40-45 |
Figure 5 shows the geographical location of the elevated structures and hotspots of Barrancabermeja.
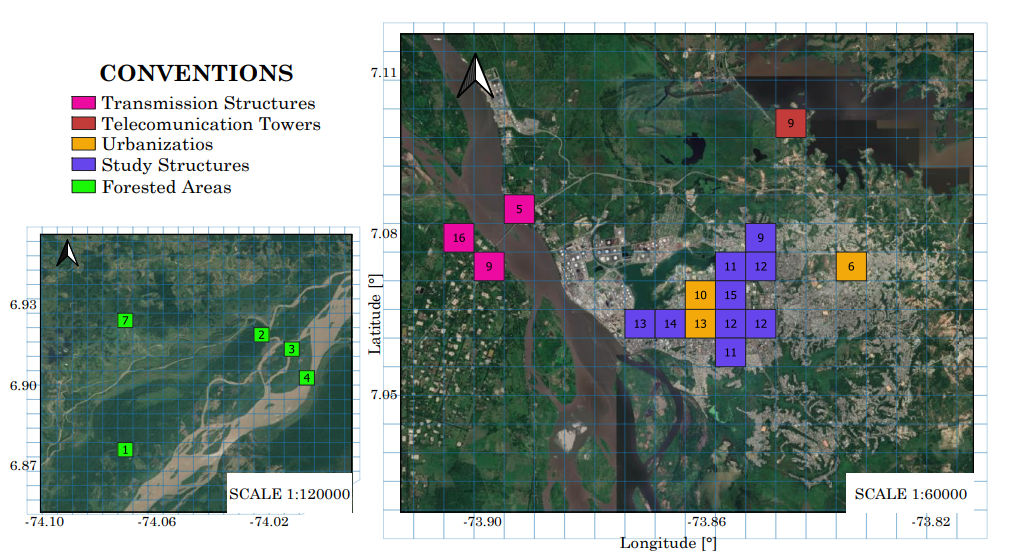
Source: created by the authors.
Of the 16 hotspots in Barrancabermeja, eight correspond to elevated structures (either an elevated study structure, a transmission tower, or a telecommunications antenna), 2 to urbanizations, and six to wooded areas.
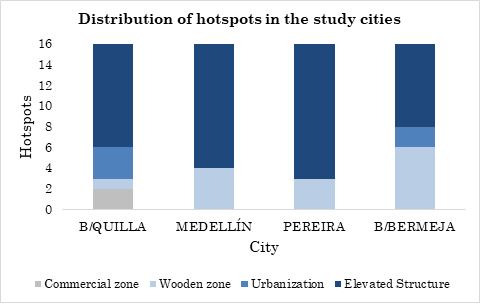
Figure 6 shows the classification of the 16 hotspots found in the four study cities. Most of hotspots in these places are located in high structures such as buildings, transmission lines, and telecommunications antennas.
4. DISCUSSION
The Intertropical Confluence Zone mainly influences lightning activity in Colombia since the trade winds from the southeast and northeast converge in the country [
By analyzing the precipitation levels in [
Regarding meteorological variables and their relationship with lightning activity, in cities such as Medellin, when the atmospheric pressure decreases between 2:00 pm and 6:00 p.m., there is a considerable increase in CG lightning flashes. The same happens in Barranquilla, where in March, April, May, and September, October, November, there are peaks of maximum lightning activity around 3:00 p.m. where there is a noticeable decrease in atmospheric pressure [
Regarding humidity, it was found that the days of high lightning activity in Medellín and Barranquilla present greater amounts of water vapor in the atmosphere, which favors the formation of storm clouds [
The above may explain the high number of lightning strikes in Barranquilla compared to Medellín, Pereira, and Barrancabermeja. Lightning activity in cities of the Andean region such as Barrancabermeja, Medellín, and Pereira is also affected by southern winds, the Intertropical Confluence Zone, and local winds of the valley-mountain-valley type [
Particularly in Medellín, the influence of the Chorro del Chocó is seen (a surface air current coming from the Pacific Ocean), which interacts with the East Trade winds and can also favor the formation of thunderstorms [
Topography is another factor that affects lightning activity. Cities such as Barrancabermeja preserved the bimodal behavior stated at the beginning [
It has also been shown that thunderstorms' topology and the heights of the electrical charge regions are highly related to the CG lightning flash rates. The three-pole structure in which a lower positive region, a negative central region, and an upper positive region show the highest CG flash rate. Likewise, the upper positive charge region's presence and height increase this flash rate. At the same time, the presence of the lower positive region favors high lightning currents [
Finally, the urban effect is another variable that influences the number of lightning strokes in a region since it includes the modification of climate and weather due to human actions. This effect is influenced by the Urban Heat Islands (UHI), which correspond to an increase in temperature in urban environments concerning their surroundings [37]. It is also affected by atmospheric aerosols or pollution, which affect the climate in terms of surface temperature, solar radiation, and precipitation [
5. CONCLUSIONS
Of the areas studied, Medellín has the place with the highest activity of cloud to ground lightning flashes in the periods 2016, 2017, 2018, with 417 impacts. This site is called Cerro Padre Amaya, with geographic coordinates of 6.27°, -75.68°. Considering that it is a city with geography that facilitates this type of phenomenon, it is located in the geographical center of the Aburrá Valley and is surrounded by high mountains. This city presents a particular behavior since its first four hotspots are located in the same area.
The elevated structures with the highest amount of lightning impacts belong to Barranquilla, specifically the Barranquilla Plaza Hotel with 107 strokes. In this city, the transmission and telecom structures have the highest impacts compared to the other cities’ understudy. They are attributing this result to the fact that the city is a semi-arid area where the northeast trade winds blow parallel to the coast, absorbing moisture, pushing it towards the interior of the Caribbean Region to the foothills of the Andes Mountain range, where they produce abundant rainfall.
With the lightning information sources provided by the LINET network, it was possible to verify that although the first hotspots in the study cities are far from the urban area, as observed in Medellín, Pereira, and Barrancabermeja, there is a marked influence of urban planning in determining the sites of high lightning activity, which allows us to infer that urban planning and the presence of elevated structures increase lightning activity. Likewise, it was verified that most hotspots correspond to elevated structures.
A possible relationship between some meteorological variables and lightning activity in the analyzed cities was determined. In this way, the time slots where CG lightning flashes increases correspond to the periods in which there were drops in atmospheric pressure. Likewise, lightning activity increases hours after the highest temperatures are recorded and at times when higher percentages of humidity are recorded in the atmosphere. Since Colombia is located in the Intertropical Confluence Zone, the hot and humid winds that upwards are driven by the mountain ranges also affect the formation of thunderstorms and, therefore, the lightning flash rates of the study cities.
Lightning activity in the four cities presented in this work can also be influenced by the relief since the mountains serve as a natural barrier to the winds forcing them to rise. The above increases the interaction between hydrometeors suspended in the atmosphere. It also favors the charge transfer by collisional and, therefore, the initiation of lightning leaders. Likewise, a possible relationship between the level of precipitation and the amount of lightning is established since the annual peaks of these two variables coincide. It is proposed that charge distributions in thunderclouds and the heights of their charge centers are also determinants of CG lightning flash rates.
Future work proposes investigating the repercussions of the urban effect on CG lightning flash rates in various Colombian cities over a considerable period. It means the influence of heat islands formed in urban environments and atmospheric aerosols.
Likewise, find the affectation that land use has on lightning activity. The characterization of the hotspots found in this work is also proposed through lightning parameters such as multiplicity, polarity, and return discharge current, making monthly and hourly distributions, probability distributions, and other statistical analyzes applicable to the protection of elevated structures against CG lightning flashes.
6. ACKNOWLEDGMENTS AND FUNDING
The authors would like to thank to the Keraunos Company, with its Colombian Total Lightning Detection Network with LINET technology, for providing us with the required data on lightning activity in the regions under study in this paper. This work is part of project 2526, entitled ‘‘Study of lightning interaction with elevated structures in Colombia based on information from the DABEIBA – LMA Network’’ financed by the Universidad Industrial de Santander.
CONFLICTS OF INTEREST
The authors declare that there is no conflict of interest.
AUTHOR CONTRIBUTIONS
The authors, Javier Mora and Julián Rojas, contributed to the processing of the data and the adequacy of the lightning information with which this work was carried out. Steven Ardila contributed to the execution of the methodology, data analysis, and document writing. Edison Soto contributed to the data analysis and corrections of form and substance in the presented document.
7. REFERENCES
- arrow_upward [1] E. Williams; K. Rothkin; D. Stevenson; D. Boccippio, “Global lightning variations caused by changes in thunderstorm flash rate and by changes in the number of thunderstorms”, J. Appl. Meteorol., vol. 39, no. 12, pp. 2223–2230, Dec. 2000. https://doi.org/10.1175/1520-0450(2001)040<2223:GLVCBC>2.0.CO;2
- arrow_upward [2] D. Mackerras; M. Darveniza; R. E. Orville; E. R. Williams; S. J. Goodman, “Global lightning: Total, cloud and ground flash estimates”, J. Geophys. Res. Atmos., vol. 103, no. D16, pp. 19791-19809, Aug. 1998. https://doi.org/10.1029/98JD01461
- arrow_upward [3] H. J. Christian et al., “Global frequency and distribution of lightning as observed from space by the Optical Transient Detector”, J. Geophys. Res. D Atmos., Vol. 108, no. D1, pp. ACL 4-1-ACL 4-15, Jan. 2003. https://doi.org/10.1029/2002jd002347
- arrow_upward [4] R. I. Albrecht; S. J. Goodman; D. E. Buechler; R. J. Blakeslee; H. J. Christian, “Where are the lightning hotspots on earth?”, Bull. Am. Meteorol. Soc., vol. 97. no. 11,pp. 2051–2068,Nov. 2016. https://doi.org/10.1175/BAMS-D-14-00193.1
- arrow_upward [5] J. Obbard, “Our Changing Planet: The View from Space”, J. Environ. Qual., vol. 38, no. 1, pp. 377-377, Jan. 2009. https://doi.org/10.2134/jeq2008.0020br
- arrow_upward [6] D. J. Cecil; D. E. Buechler; R. J. Blakeslee, “Gridded lightning climatology from TRMM-LIS and OTD: Dataset description”, Atmos. Res., vol. 135–136, pp. 404-414, Jan. 2014. https://doi.org/10.1016/j.atmosres.2012.06.028
- arrow_upward [7] M. Peterson; D. Mach; D. Buechler, “A Global LIS/OTD Climatology of Lightning Flash Extent Density”, J. Geophys. Res. Atmos., vol. 126, no. 8, pp. 1-23, Apr. 2021. https://doi.org/10.1029/2020JD033885
- arrow_upward [8] M. L. Bah; M. Tounkara; C. Gomes; A. Davidov; J. Anderson, “Lightning occurrence density in Guinea”, in 2014 International Conference on Lightning Protection (ICLP), Shanghai, 2014, pp. 1902-1908. https://doi.org/10.1109/ICLP.2014.6973440
- arrow_upward [9] C. K. Unnikrishnan; S. Pawar; V. Gopalakrishnan, “Satellite-observed lightning hotspots in India and lightning variability over tropical South India”, Adv. Sp. Res., vol. 68, no. 4, pp. 1690-1705, Aug. 2021. https://doi.org/10.1016/j.asr.2021.04.009
- arrow_upward [10] A. Dewan; E. T. Ongee; M. M. Rahman; R. Mahmood; Y. Yamane, “Spatial and temporal analysis of a 17-year lightning climatology over Bangladesh with LIS data”, Theor. Appl. Climatol., vol. 134, pp. 347–362, Oct. 2017. https://doi.org/10.1007/s00704-017-2278-3
- arrow_upward [11] B. Kucienska; G. B. Raga; R. Romero-Centeno, “High lightning activity in maritime clouds near Mexico”, Atmos. Chem. Phys., vol. 12, no. 17, pp. 8055–8072, Sep. 2012. https://doi.org/10.5194/acp-12-8055-2012
- arrow_upward [12] J. A. Amador; D. Arce-Fernández, “WWLLN Hot and Cold-Spots of Lightning Activity and Their Relation to Climate in an Extended Central America Region 2012–2020”, Atmosphere, vol. 13, no. 1, Jan. 2022 https://doi.org/10.3390/atmos13010076
- arrow_upward [13] Y. Kuleshov; D. Mackerras; M. Darveniza, “Spatial distribution and frequency of lightning activity and lightning flash density maps for Australia”, J. Geophys. Res. Atmos., vol. 111, no. D19, pp. 1-14, Oct. 2006. https://doi.org/10.1029/2005JD006982
- arrow_upward [14] S. E. Enno; J. Sugier; R. Alber; M. Seltzer, “Lightning flash density in Europe based on 10 years of ATDnet data”, Atmos. Res., vol. 235, p. 104769, May. 2020. https://doi.org/10.1016/j.atmosres.2019.104769
- arrow_upward [15] J. Inampués; D. Aranguren; A. Cruz; J. Gonzalez; H. Torres; H. D. Betz, “Severe thunderstorms in the Colombia and Venezuela high lightning active areas”, in 2017 International Symposium on Lightning Protection (XIV SIPDA), Natal, 2017, pp. 359-364. https://doi.org/10.1109/SIPDA.2017.8116952
- arrow_upward [16] J. Herrera; C. Younes; L. Porras, “Cloud-to-ground lightning activity in Colombia: A 14-year study using lightning location system data”, Atmos. Res., vol. 203, pp. 164-174, May. 2018. https://doi.org/10.1016/j.atmosres.2017.12.009
- arrow_upward [17] H. Torres Sánchez, El Rayo: mitos, leyendas, ciencia y tecnología. Universidad Nacional de Colombia - Sede Bogotá, Facultad de Ingeniería. UNIBIBLOS. 2002.
- arrow_upward [18] J. Herrera-Murcia; C. Younes-Velosa; L. Porras, “Variation of lightning peak current parameter as a function of cloud-to-ground lightning flash density in Colombia”, in 2017 International Symposium on Lightning Protection (XIV SIPDA), Natal, 2017, pp. 336-340. https://doi.org/10.1109/SIPDA.2017.8116948
- arrow_upward [19] D. Aranguren et al., “Colombian Total Lightning Detection Network and early detection of failure risks for power systems”, in Simp. Int. sobre Calid. la Energía Eléctrica (VII SICEL), pp. 1–6, 2013.
- arrow_upward [20] D. F. del Río Trujillo, “Evaluación del efecto urbano sobre los parámetros del rayo. Caso Colombiano”. (Tesis de Doctorado), Facultad de Ingeniería y Arquitectura. Departamento de Ingeniería Eléctrica, Electrónica y Computación, Universidad Nacional de Colombia, Manizales, 2018. https://repositorio.unal.edu.co/handle/unal/63293
- arrow_upward [21] J. Mora et al., “Identification of areas and elevated structures with the greatest amount of lightning impacts (Hotspots)”, Simp. Int. sobre Calid. la Energía Eléctrica (X SICEL), 2021.
- arrow_upward [22] H. Ḧoller et al., “Lightning characteristics observed by a VLF/LF lightning detection network (LINET) in Brazil, Australia, Africa and Germany”, Atmos. Chem. Phys., vol. 9, no, 20, pp. 7795–7824, Oct. 2009. https://doi.org/10.5194/acp-9-7795-2009
- arrow_upward [23] J. A. López et al., “Charge Structure of Two Tropical Thunderstorms in Colombia”, J. Geophys. Res. Atmos., vol. 124, no. 10, pp. 5503-5515, Apr. 2019. https://doi.org/10.1029/2018JD029188
- arrow_upward [24] Keraunos S.A.S, “Red Colombiana de detección total de rayos - LINET”, 2015.
- arrow_upward [25] D. Aranguren; J. López; J. Inampués; H. Torres; H. D. Betz, “Cloud-to-ground ligthning activity in Colombia and the influence of topography”, in 2014 International Conference on Lightning Protection (ICLP), Shanghai, 2014, pp. 1850-1855. https://doi.org/10.1109/ICLP.2014.6973430
- arrow_upward [26] ICONTEC, “NTC 4552 Protección contra Rayos”, Ntc 4552, 2004. https://www.academia.edu
- arrow_upward [27] C. A. Cruz Mosquera, “Evaluación del Riesgo por Rayos Incluyendo un Sistema de Alarma de Tormentas (SAT) en Colombia”,(Tesis de Maestría), Facultad de Ingeniería, Departamento de Ingeniería Eléctrica y Electrónica, Universidad Nacional de Colombia, Bogotá, 2015.https://repositorio.unal.edu.co/handle/unal/56731
- arrow_upward [28] H. O. Benavides; G. E. León Aristizabal, “Información técnica sobre Gases de Efecto Invernadero y el cambio climático.”, Instituto de Hidrología, Meteorología y Estudios Ambientales - Ideam, pp. 1–102, 2007. https://doi.org/IDEAM–METEO/008-2007
- arrow_upward [29] B. S. Ardila Murillo; E. A. Soto Ríos; K. A. Velandia López, “Actividad de rayos en el departamento de Santander entre 2014 y 2016”, Ingeniería, vol. 26, no. 3, pp. 419–435, Jan. 2022. https://doi.org/10.14483/23448393.17585
- arrow_upward [30] IDEAM, “Atlas-IDEAM”, Tiempo y clima / Atlas, 2021.
- arrow_upward [31] M. A. Uman, The art and science of lightning protection. Cambridge: Cambridge University Press, 2008.
- arrow_upward [32] E. R. Williams, “Lightning and climate: A review”, Atmos. Res., vol. 76, no. 1-4, pp. 272-287, Jul. 2005. https://doi.org/10.1016/j.atmosres.2004.11.014
- arrow_upward [33] C. Price, “Thunderstorms, lightning and climate change”, in Lightning: Principles, Instruments and Applications: Review of Modern Lightning Research, pp 521–535, Springer, 2009. https://doi.org/10.1007/978-1-4020-9079-0_24
- arrow_upward [34] G. Poveda Jaramillo, “El Clima de Antioquia”, Geogr. Antioquia, Fondo Editorial Universidad Eafit, M. Hermelin, pp. 117- 128, Jan. 2006. https://www.researchgate.net/publication/233967250_El_Clima_de_Antioquia
- arrow_upward [35] N. Pineda; J. Montanyà; A. Salvador; O. A. van der Velde; J. A. López, “Thunderstorm characteristics favouring downward and upward lightning to wind turbines”, Atmos. Res., vol. 214, pp. 46-63, Dec. 2018. https://doi.org/10.1016/j.atmosres.2018.07.012
- arrow_upward [36] B. Ardila Murillo; E. A. Soto Ríos; D. Argüello Barbosa; H. Tello Rodríguez; J. López Trujillo; J. Montanyá, “Análisis de estructuras de carga de dos tormentas eléctricas registradas por la red Lightning Mapping Array en el Magdalena Medio colombiano”, Ingeniería, vol. 7, no. 2, p.p. e17925, Abr. 2022. https://revistas.udistrital.edu.co/index.php/reving/article/view/17925
- arrow_upward [37] L. Gartland, Heat Islands: Understanding and mitigating heat in urban areas, Routledge, 2010.