Finite Element Modeling of Direct Transition from Concrete Pavement to Asphalt Pavement
Modelación de elementos finitos de transición directa de pavimento asfáltico a pavimento de concreto
 PDF
PDF
Received: April 16, 2022
Accepted: October 3, 2022
Available: November 18, 2022
S. A. Vargas-Diaz, “Finite Element Modeling of Direct Transition from Concrete Pavement to Asphalt Pavement,” TecnoLógicas, vol. 25, nro. 55, e2389. https://doi.org/10.22430/22565337.2389
Highlights
Abstract
The origin of premature distress in direct transitions from Portland cement concrete pavement (PCCP) to asphalt concrete pavement (ACP) constructed as part of TransMilenio pavement repairs has not been investigated and the related literature is limited, therefore, a three-dimensional finite element (FE) model was used to determine the mechanical responses of a direct ACP-PCCP transition under moving vehicular loading in order to identify failure mechanisms. In this sense, a PCCP model was validated with a falling-weight deflectometer (FWD) test, field measurements, and analytical solutions, then a concrete slab (CS) was replaced with flowable fill and asphalt concrete (AC) to create the direct ACP-PCCP transition. The direct transition model considered: 1) the viscoelastic nature of the AC; 2) non-uniform tire-pavement contact pressure; and 3) the bonding variation of the AC-concrete interface of the transition joint using different coefficients of friction (COF) and the Coulomb-type friction model. The results showed 1) relatively high near-surface shear strain of the AC, primarily at the joint and extending 122 mm from the joint; 2) relatively high compressive vertical strain on the subgrade top; and 3) high vertical differential displacement of the joint surface. It is concluded that the AC may prematurely experience near-surface cracking at the vicinity of the joint and rutting from the subgrade, however, increasing the AC-concrete interface bonding may be conservative for fatigue cracking and vertical differential displacement.
Keywords: Falling-weight deflectometer, pavement performance, failure mechanisms, finite element modelling, non-uniform pressure.
Resumen
El origen de daños prematuros en transiciones directas de pavimento de concreto asfáltico (PCA) a pavimento de concreto de cemento de Pórtland (PCCP) construidas como parte de las reparaciones del pavimento de TransMilenio no ha sido investigado y la literatura relacionada es limitada, por lo tanto, un modelo tridimensional de elementos finitos (EF) fue utilizado para determinar las respuestas mecánicas de una transición directa de pavimento de PCA-PCCP sometida a carga vehicular en movimiento con el fin de identificar mecanismos de falla. En este sentido, un modelo de PCCP fue validado con un ensayo de deflectómetro de impacto (FWD), mediciones de campo y soluciones analíticas, luego fue remplazada una losa de concreto (LC) por relleno fluido y concreto asfáltico (CA) para crear la transición directa de PCA-PCCP. El modelo de la transición directa consideró: 1) la naturaleza viscoelástica del CA; 2) presiones no uniformes de contacto llanta-pavimento; y 3) la variación de unión de la interfaz CA-concreto de la junta de transición mediante diferentes coeficientes de ficción (CF) y el modelo de fricción de tipo Coulomb. Los resultados mostraron 1) deformación cortante relativamente alta cerca de la superficie del CA, principalmente en la junta y extendida 122 mm desde la junta; 2) deformación vertical de compresión relativamente alta en la parte superior de la subrasante; y 3) alto desplazamiento diferencial vertical de la superficie de la junta. Se concluye que el CA podría experimentar prematuramente agrietamiento cerca de la superficie en inmediación de la junta y ahuellamiento desde la subrasante, no obstante, aumentar la unión de la interfaz CA-concreto puede ser conservativo para el agrietamiento por fatiga y desplazamiento diferencial vertical.
Palabras clave: Deflectómetro de impacto, desempeño de pavimentos, mecanismos de falla, modelación de elementos finitos, presiones no-uniformes.
1. INTRODUCTION
A pavement transition is used to connect two pavement types and/or sections in order to provide a smooth and gradual change in the structural capacity of the pavement [
On the other hand, the literature states that distresses in ACP-PCCP transitions are mainly experienced near the joint. The distresses reported consist of the opening of the joint that may cause water to enter the pavement; settlement of the CS; distortion, material heaving, and bumps in the AC [
1.1 Background
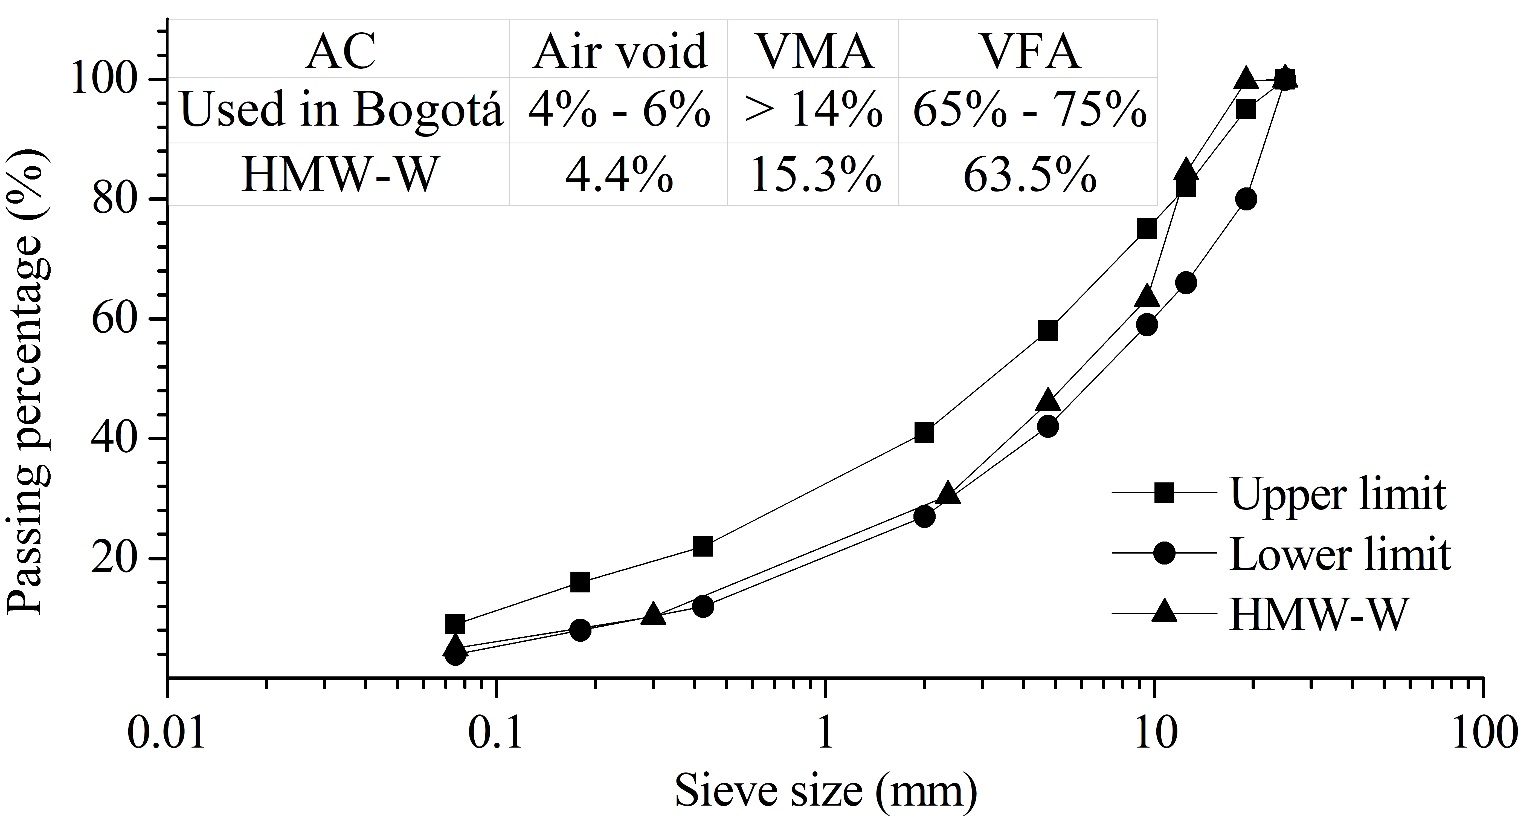
In Bogotá, Colombia, extensive stretches of PCCP were built exclusively for bus rapid transit (BRT) that integrates the TransMilenio transportation system. Due to various factors, some CSs have experienced distresses and the repair of the PCCP consisted of replacing the CSs with continuous dense gradation AC with 19 mm nominal maximum aggregate size (NMAS). Therefore, during the repairs, sections of the PCCP were converted to ACP, i.e., ACP-PCCP transitions were constructed.
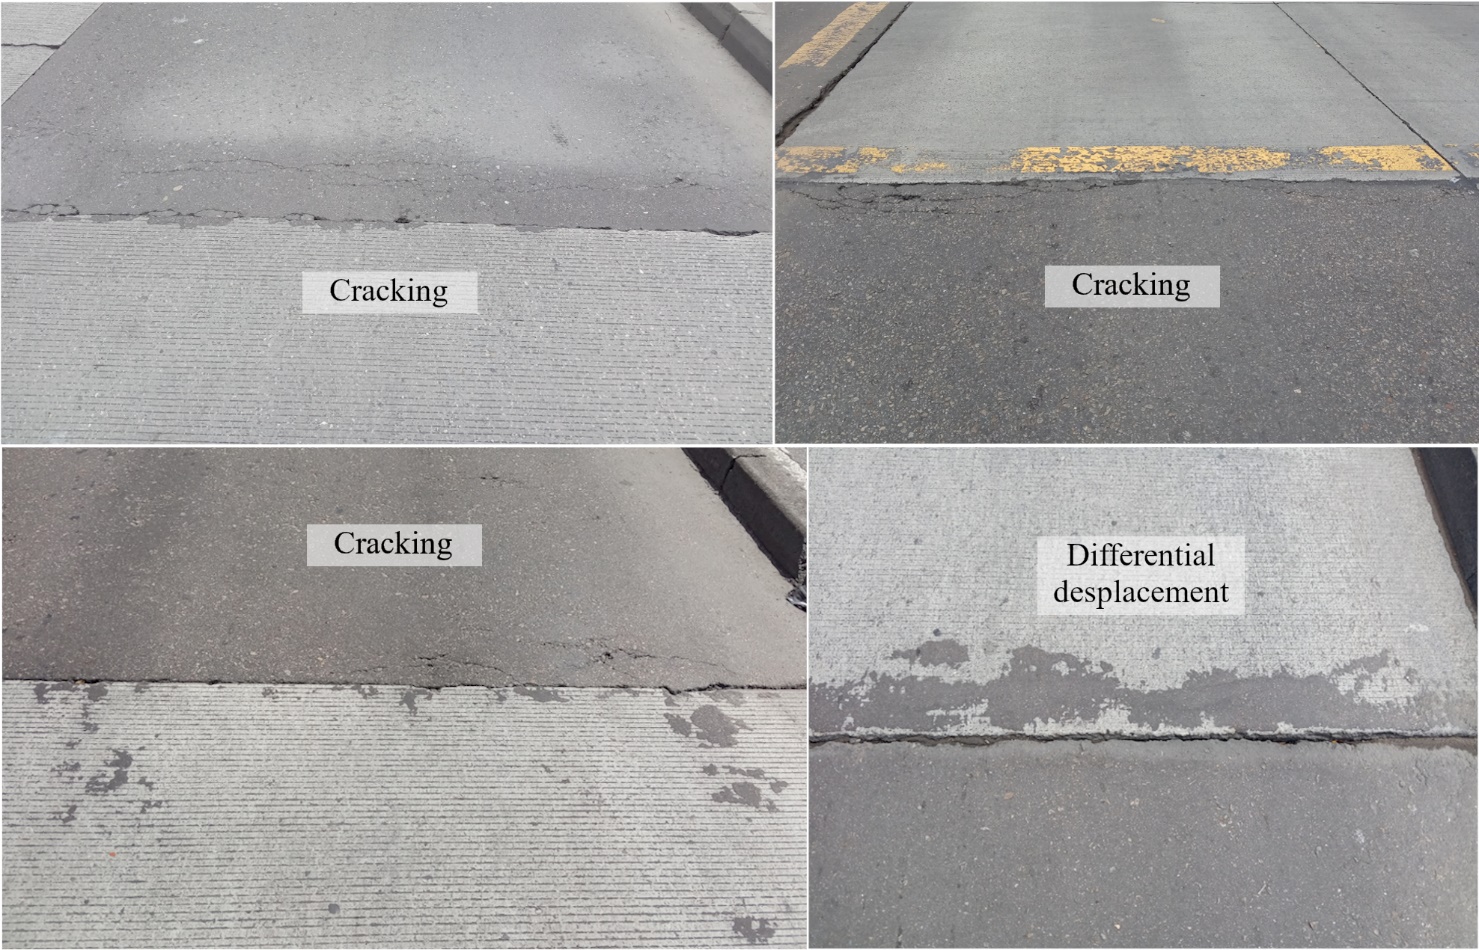
It is worth mentioning that the ACP-PCCP transitions were not constructed with methods such as transition slab, elastomeric concrete joint, or patching mix, instead, the pavement transitions consisted solely of the sudden change from AC to CS (direct ACP-PCCP transitions). Nevertheless, prematurely in some direct ACP-PCCP transitions, the AC began to experience cracking and material heaving, mainly under the tire path and near the joint, as well as differential displacement of the joints (Figure 1). Currently, the origin of the distresses has not been investigated and remains uncertain. Although the literature reports possible causes of distresses for ACP-PCCP transitions, these do not allow an understanding of the failure mechanisms of a direct ACP-PCCP transition. Therefore, this study aims to determine the mechanical responses of a direct ACP-PCCP transition under moving vehicular loading by dynamic FE analysis in order to identify failure mechanisms.
1.2 Review of FE modeling literature
Problems related to the prediction of mechanical responses and failure mechanisms of pavements have been addressed by applying the FE method [
The recommended and commonly used approach for modeling PCCP has been the three-dimensional since it allows a realistic representation of the geometry, discontinuities and embedded elements of the pavement, for instances, transverse joints, longitudinal joints, dowel slots and dowels [
On the other hand, based on FE simulations and instrumented pavement measurements, the following recommendations for FE modeling of ACP can be made: the AC should incorporate viscoelastic properties since using elastic tends to underestimate the material responses [
2. METHODOLOGY
Simulations were performed with the general-purpose FE software Abaqus. To achieve the objectives of this study, a PCCP model was validated and then modified to create the direct ACP-PCCP transition.
2.1. PCCP FE modeling
The model used was taken from the literature since it had the necessary details for its reproduction and had been previously validated. Originally the model was used to examine the mechanical responses of precast panel pavement repair joints under static aircraft loads [
- Geometry: Figure 2 presents the dimensions of the model including the thicknesses of each layer. The model also included 10 dowels of 558.8 mm in length and 25.4 mm in diameter and the dowel grout.
- Material properties: the materials were characterized as linear elastic by the modulus of elasticity and Poisson's ratio (Table 1); however, future studies could consider the nonlinearity and anisotropy of the granular layers and subgrade to improve the accuracy of the FE model.
- Interaction: the interfaces between the materials were characterized with the following COFs: 1 for the CS-flowable fill and dowel-concrete in the loaded CS interfaces; 0.35 for the flowable fill-base and base-subgrade interfaces; and 0.076 for the dowel-concrete in the unloaded CS interface. In order to reduce the computational time and improve the convergence of the results, the friction between the dowel slot grout and the CS was omitted; therefore, these parts were considered fully bonded.
- Meshing: In the CSs a fine meshing near the transverse joint was performed to capture the mechanical responses more accurately, thus, elements of 25.4 mm in size were used from the joint to an extension of 304.8 mm from the joint. Beyond 304.8 mm, elements of 101.6 mm in size were used. For the other components of the model such as dowels, flowable fill, base, and subgrade, elements of 5.1 mm, 152.4 mm, 304.8 mm, and 457.8 mm in size were used, respectively. All elements were of type C3D8R. However, as the validation of this model for this study was performed by dynamic/implicit analysis it was convenient to modify the model by including infinite elements (CIN3D8) at the edges and bottom of the model with an extension of 500 mm (except in the CSs), thus, the model was composed of 77 793 elements and 99 322 nodes.
- Boundary conditions: all degrees of freedom on the granular layers and subgrade outer faces were constrained, and the horizontal displacement of the CSs outer faces was constrained.
| Materials | Modulus of elasticity (MPa) | Poisson's ratio | Density (kg/m3) |
| Unloaded CS (D1) | 33 440 | 0.2 | 2 320 |
| Loaded CS (D0) | 33 440 | 0.2 | 2 320 |
| Dowels | 199 948 | 0.3 | 7 800 |
| Dowel grout | 22 063 | 0.2 | 1 840 |
| Base | 379 | 0.4 | 2 000 |
| Flowable fill | 276 | 0.2 | 1 910 |
| Subgrade | 145 | 0.4 | 1 840 |
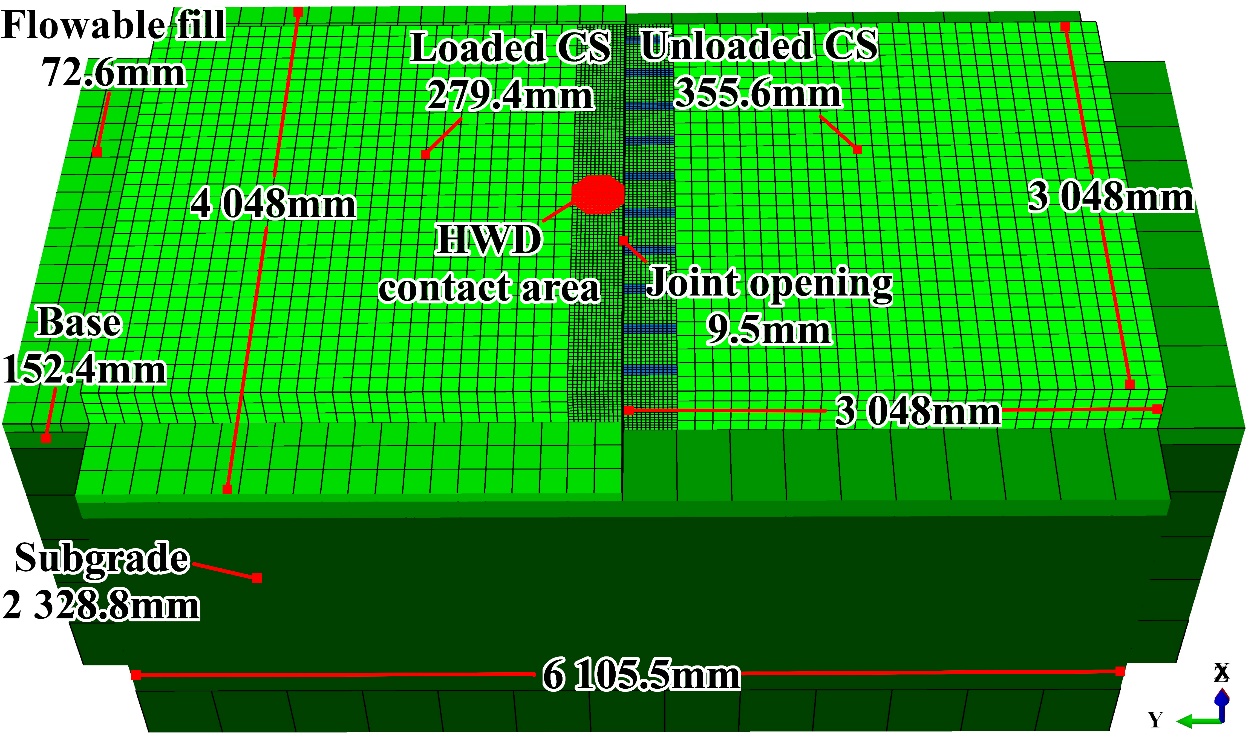
In order to validate the model and modeling techniques a heavy impact deflectometer (FWD) test was simulated, therefore, a uniform pressure of 3.2 MPa was applied for 20 ms over a 300 mm diameter contact area near the transverse joint (Figure 2). Model validation was performed by comparing the deflections and load transfer efficiency (LTE) of the FE model against the results from Westergaard's analytical edge deflection equations and FWD field measurements. It is worth mentioning that the simulation was performed with a 2-core Intel Celeron with 3.5 GHz and 6 Gb of RAM and the calculation time was approximately 4 hours. The validation is presented in Table 2, as well as the difference between the calculated deflection and the field measurement (error column). In this table, it is observed that the FE model deflections were close to the field measurements at both D0 and D1, moreover, the FE model deflections were more accurate than those calculated using the Westergaard equations. The LTE of the FE model was similar to that measured in the field (3.4 % higher) and to that calculated with the Westergaard equations (2.1 % lower).
| D0 (mm) | Error (%) | D1 (mm) | Error (%) | LTE (%) | |
| Field measurements a | 781.000 | - | 514.000 | - | 65.8 |
| Westergaard's equations a | 606.264 | 22.4 | 432.524 | 15.9 | 71.3 |
| PCCP FE Model | 651.449 | 16.6 | 450.748 | 12.3 | 69.2 |
Note: LTE = D1 / D0 *100
a Based on [
Even though the FE model deflections were not accurate to the field measurements, the differences exhibited (16.6 % and 12.3 %) were acceptable considering the high variability of the field measurements, even in the literature, maximum differences of 15 % and 20 % have been accepted in pavement validations [
2.2. Direct ACP-PCCP transition FE modeling
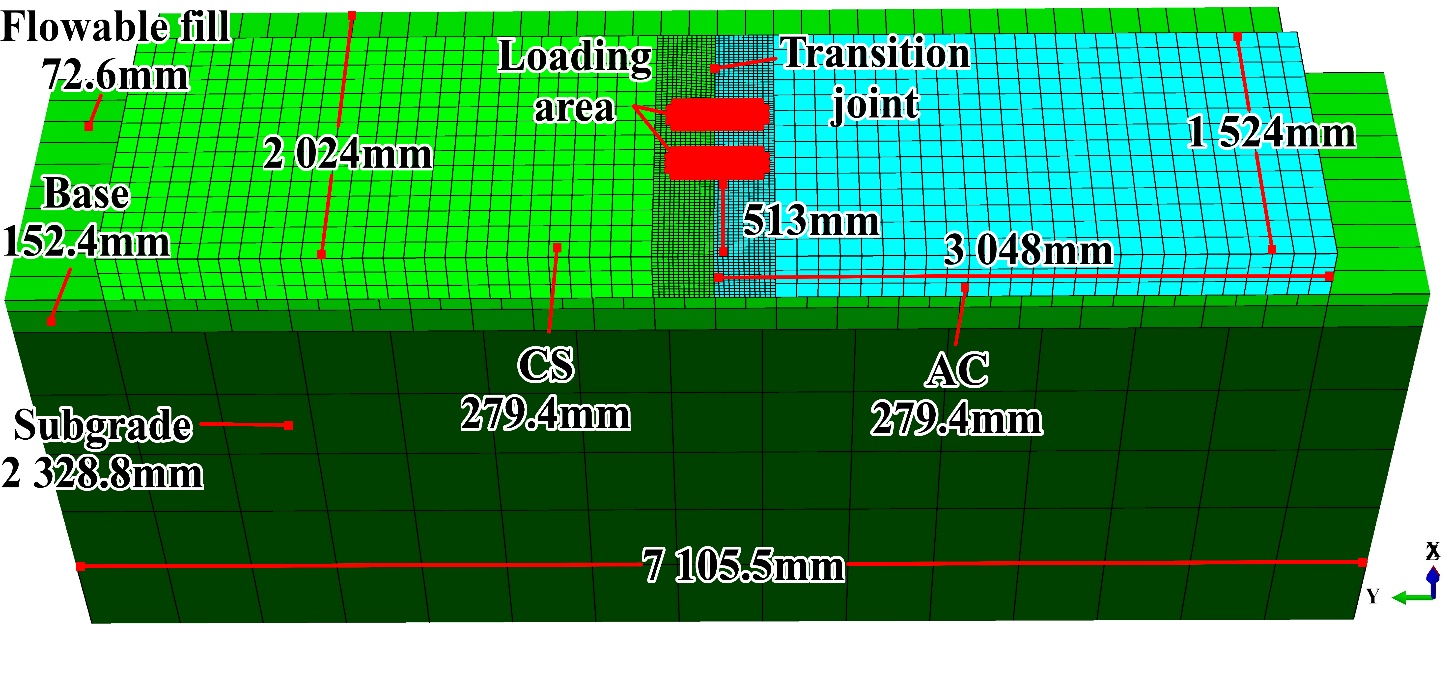
The following modifications were made to the PCCP model to create the direct ACP-PCCP transition: D1 and the dowels were removed; the flowable fill was extended along the model above the base layer; an AC layer was added, being assumed as linear viscoelastic; and due to the model and load symmetry, the symmetry boundary condition in the YZ plane was added to decrease the model size by half and reduce the computational demand, in this sense, the model consisted of 31 487 elements and 38 682 nodes and the computational time was approximately 3 hours. The properties of the other materials and characteristics of the model such as mesh size, layer thicknesses, friction between layers, and boundary conditions were retained (Figure 3). It is worth mentioning that some of the changes introduced were made to meet the thickness limits for CS or AC (200 mm to 280 mm) and flowable fill (30 mm to 500 mm) of the TransMilenio pavement [
2.2.1. Linear viscoelastic (VEL) properties
Linear viscoelasticity allows describing the AC responses under different temperature and loading frequency conditions, in addition, it allows obtaining greater accuracy in the results of FE simulations [
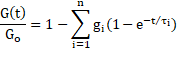
Where G(t) is the relaxation shear modulus; Go is the instantaneous shear modulus; gi are the dimensionless coefficients of the Prony series of the shear modulus, τi is the relaxation time and, t is the loading time.
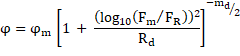
The dynamic modulus and phase angle master curves were constructed using the sigmoidal function (2) and phase angle (3), respectively, these functions allow prediction of the dynamic modulus and phase angle at experimentally unavailable frequencies. In addition, the time-temperature superposition principle was applied, which allows shifting the experimental data at different temperatures to a reference temperature as a function of the reduced frequency [
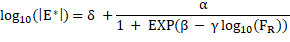
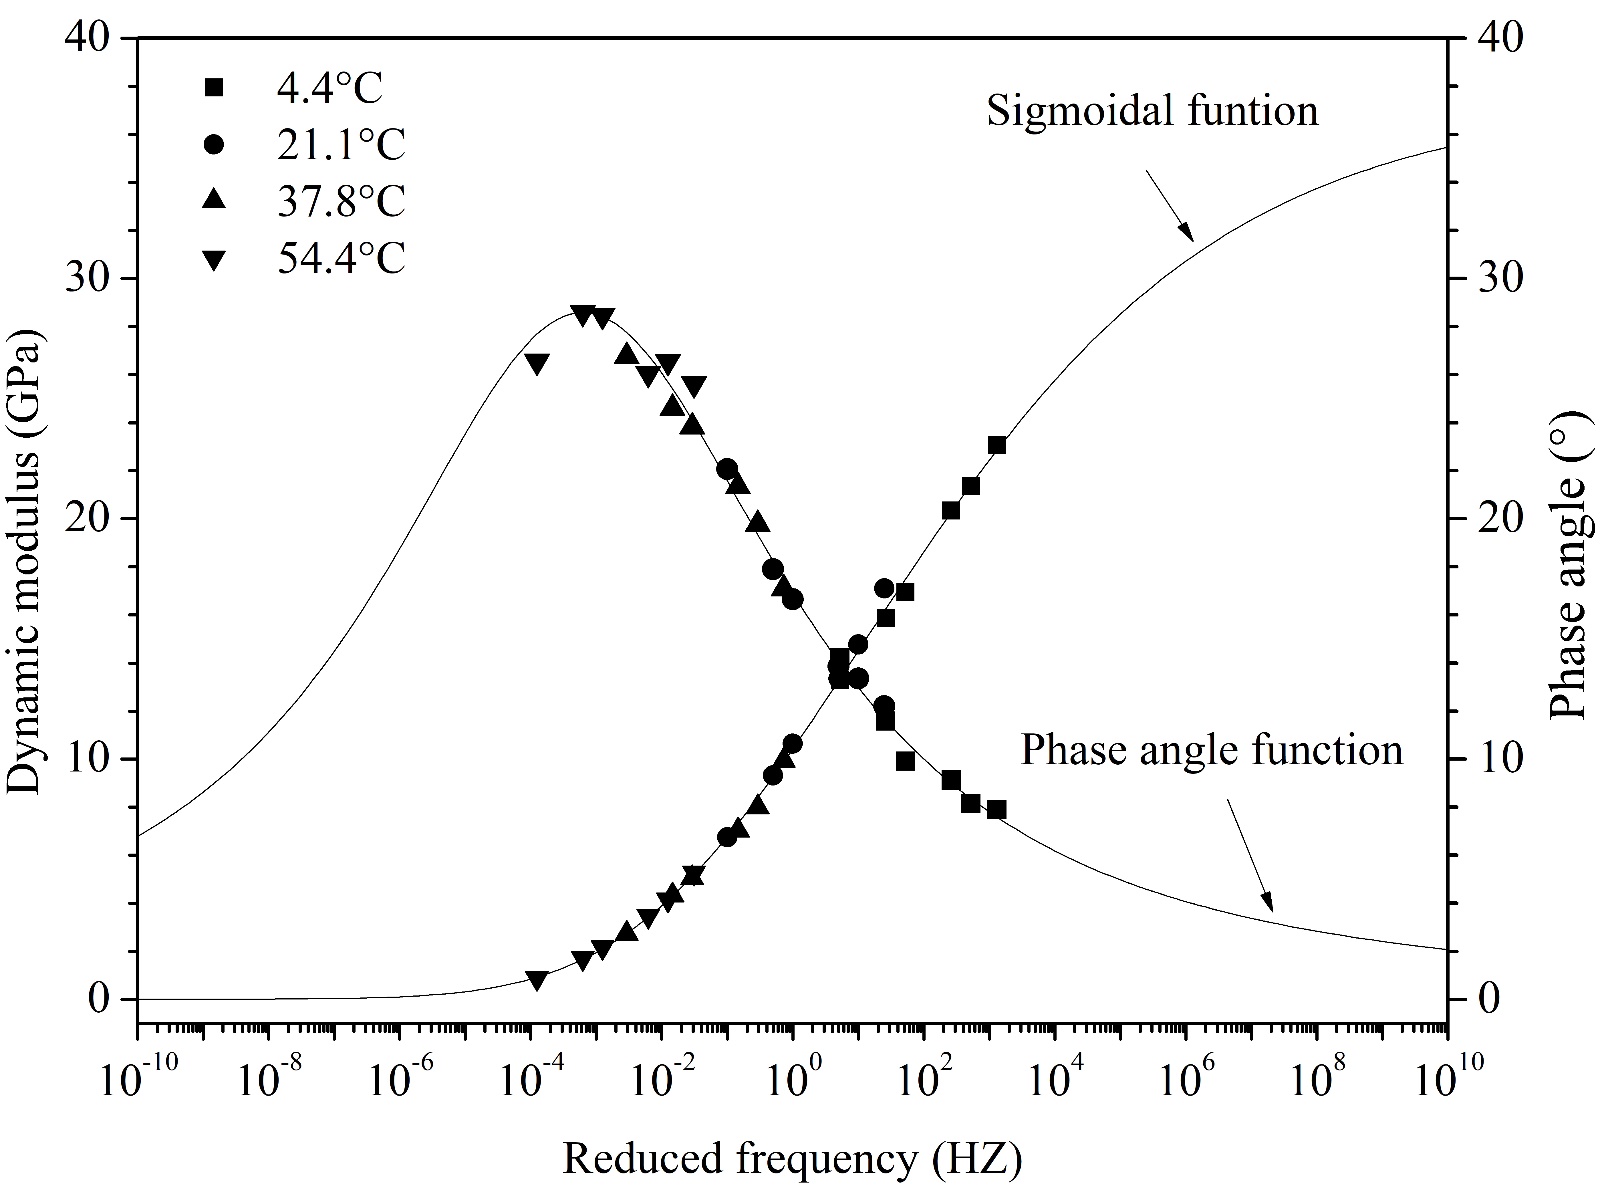
Where |E*| is the dynamic module; FR is the reduced frequency in Hz; α and δ are the upper and lower limit of the sigmoidal function, respectively; β and γ are shape parameters.
Where φ is the phase angle in degrees; φm is the maximum experimental phase angle; Fm is the frequency where φm occurs; FR is the reduced frequency in Hz; Rd and md are shape parameters.
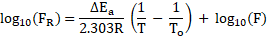
Where FR is the reduced frequency in Hz; F is the experimental frequency in Hz; ∆Ea is the activation energy; R is the universal gas constant, 8.314 J/(°K-mol); and T and To are the experimental and reference temperature in °K, respectively.
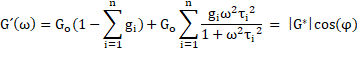
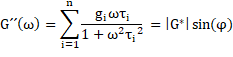
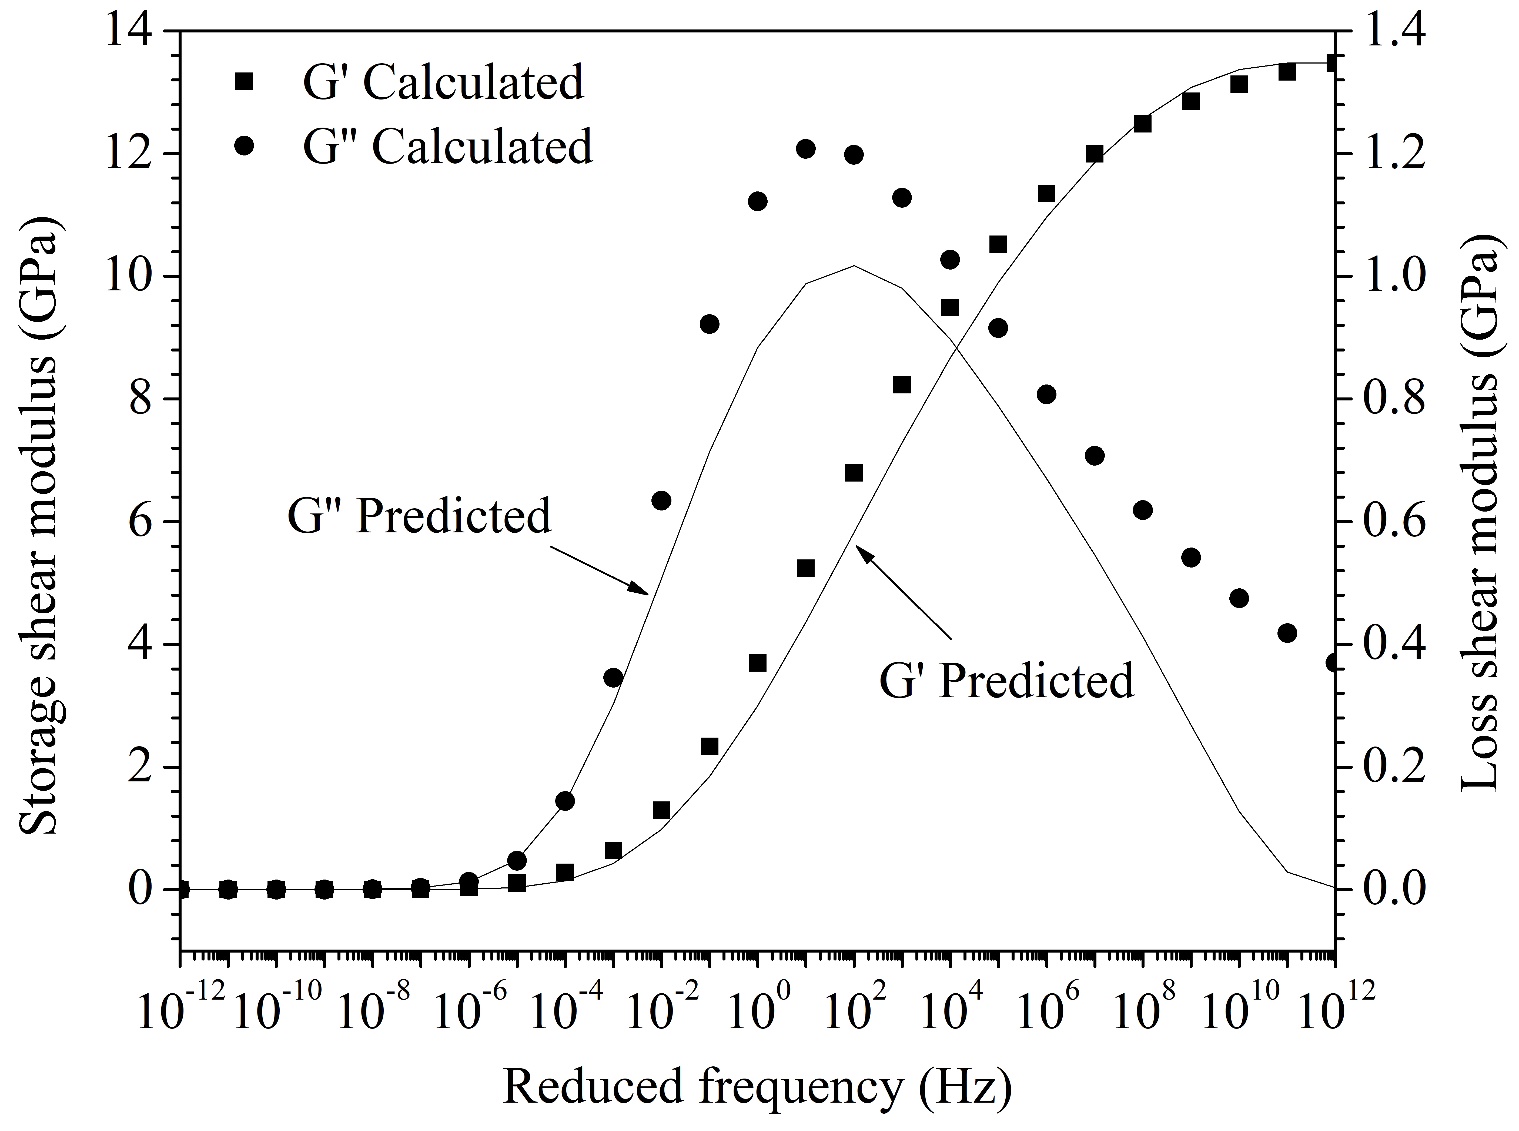
From the sigmoidal function, phase angle function, and considering the parameters in Table 3, dynamic moduli and phase angles were predicted for frequencies between 10-12 Hz and 1012 Hz in order to capture the viscoelastic response of HMW-W over a wide range. The predicted dynamic moduli were converted to shear dynamic moduli [|G*|=|E*|/2(1+μ)] assuming a constant Poisson's ratio of 0.35 and then the storage and loss shear moduli were calculated and fitted to (5) and (6), respectively. The Microsoft Excel Solver tool was used to reduce the error between the calculated and predicted storage shear modulus. From the fit, 25 parameters gi and τi, and Go were determined (Table 3), it should be noted that these parameters are mathematically equivalent to those in (1) [
relaxation times. Source: Created by the author.
| i | g | τ (s) |
| 1 | 0.000102499 | 10-12 |
| 2 | 0.010269321 | 10-11 |
| 3 | 0.025971950 | 10-10 |
| 4 | 0.041943435 | 10-9 |
| 5 | 0.056357998 | 10-8 |
| 6 | 0.069640108 | 10-7 |
| 7 | 0.082506251 | 10-6 |
| 8 | 0.094740323 | 10-5 |
| 9 | 0.104829141 | 10-4 |
| 10 | 0.110297328 | 10-4 |
| 11 | 0.108669478 | 10-3 |
| 12 | 0.098646385 | 10-2 |
| 13 | 0.080904557 | 10-1 |
| 14 | 0.058196752 | 100 |
| 15 | 0.034862904 | 101 |
| 16 | 0.015873795 | 102 |
| 17 | 0.004857768 | 103 |
| 18 | 0.001031532 | 104 |
| 19 | 0.000222914 | 106 |
| 20 | 0.000058803 | 107 |
| 21 | 0.000014791 | 108 |
| 22 | 0.000001728 | 109 |
| 23 | 0.000000054 | 1010 |
| 24 | 4.8330700E-10 | 1011 |
| 25 | 1.8713700E-10 | 1012 |
Note: = 13 480.25839 GPa
Where, G'(ω) and G´´(ω) are the storage and loss shear modulus, respectively; gi are dimensionless shear modulus coefficients, τi is the relaxation time, Go is the instantaneous shear module, and ω=2πf is the angular frequency.
Figure 6 illustrates the storage and loss shear moduli of HMW-W, although it is observed under-fitting between the predicted and calculated loss shear moduli was the best fitting achieved because the fitting considers the 25 parameters gi and τi, and Go simultaneously making it a little difficult to obtain a satisfactory result [
2.2.2. AC-concrete interface bonding
Interface bonding between AC and concrete is influenced by several factors such as dosage and type of tack coat at the interface, the type of AC, the concrete surface texture, and the temperature [
2.2.3. Tire-pavement contact pressure and moving vehicular loading
The vertical and tangential tire-pavement contact pressure were considered in the FE model; however, they were taken from the literature since the contact pressures of BRTs such as those used in Bogota are not reported. The contact pressures used were measured in the field on a dual-tire assembly (DTA) type 275/80R22.5 at different inflation pressures and tire loads [
Figure 7 illustrates the variation of tire-pavement contact pressure along the tire footprint (Y-direction), which is based on field measurements [
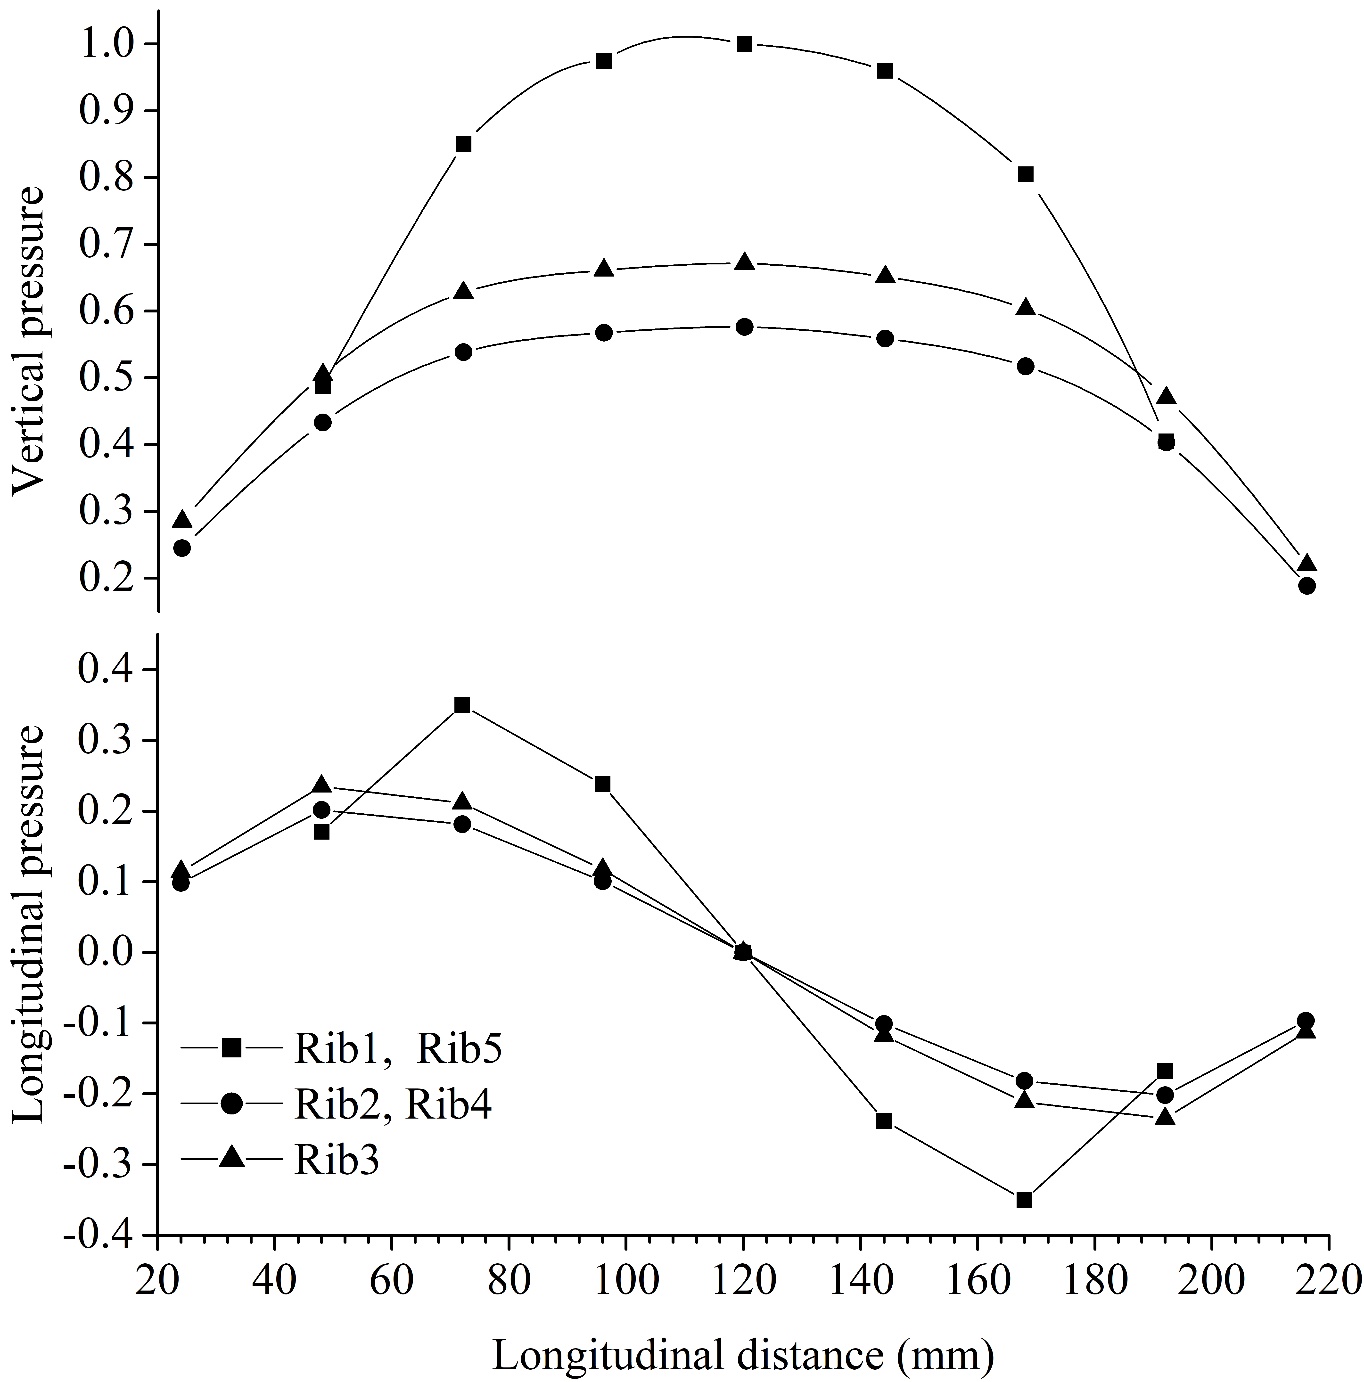
Each tire was composed of 5 treads, the outer and inner treads have been meshed with 14 and 18 elements, respectively (Figure 8). The PV, PL, and PT were assigned to each element within the treads depending on their location in the longitudinal distance.
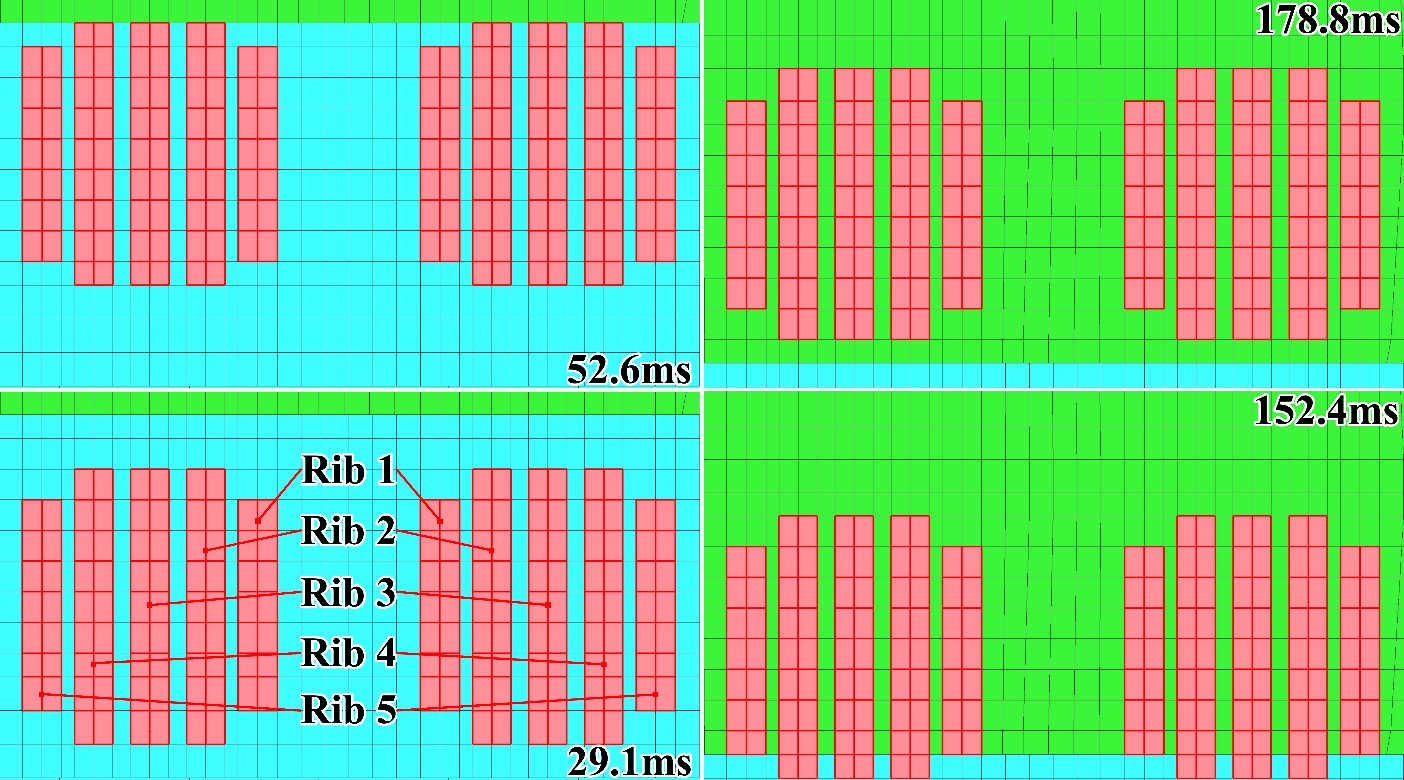
The mechanical response of the AC is time-dependent and in practice, this time is related to the vehicle speed, for instance, at low speeds (high loading time) the dynamic modulus is reduced and therefore higher strains are experienced compared to higher speeds [
3. RESULTS AND DISCUSSION
3.1. Effect of COF on vertical displacement and LTE
Figure 9 illustrates the effect on vertical displacement and LTE caused by varying the COF at the AC-concrete interface. The effect was measured by the FWD test. According to the results, COFs of 0.02 and 0.1 represented debonding of the AC-concrete interface since sliding was experienced at the joint between the AC and the CS causing vertical displacement in different directions. The CS (loaded) was displaced downward causing an uplift of the flowable fluid fill, and consequently, upward displacement of the AC (unloaded). Due to debonding of the interface LTE across the transition joint was not experienced (negative LTE). Furthermore, increasing the COF from 0.02 to 0.1 (increasing the bonding) caused the reduction of the vertical displacement in the AC and CS, however, this effect was negligible on the LTE since it remained negative. In this sense, COFs of 0.02 and 0.1 could represent a state of a very poor and poor bond of the AC-concrete interface, respectively.
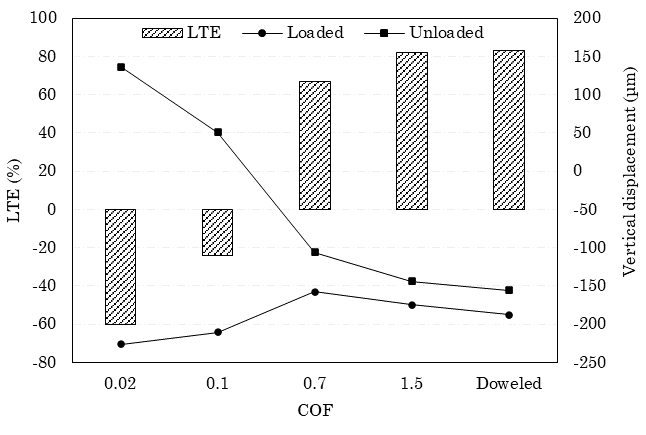
On the other hand, COFs f 1.5 and 0.7 allowed load transfer across the joint. The LTE experienced was 82.2 % and 67.1 %, respectively. In this regard, increasing the AC-concrete interface bonding increases the LTE, but increasing the interface bonding increased the vertical displacement of the AC and the CS by approximately 11 %. However, when comparing the PCCP results against those of the direct ACP-PCCP transition, for the 1.5 COF, good agreement was observed in the LTE (0.9 % difference) and the vertical displacement of the loaded (6.8 % difference) and unloaded (7.8 % difference) slab. Therefore, COFs of 1.5 and 0.7 could represent a state of good and acceptable bonding of the AC-concrete interface, respectively. Since the COFs of 0.02 and 0.1 represented debonding of the AC-concrete interface, these were not used to simulate the moving vehicular loading at the direct ACP-PCCP transition, instead, only the CFs of 1.5 and 0.7 were used.
3.2. Differential surface displacement of the transition joint
The vertical and longitudinal displacement was measured at the surface edge of the AC and CS, along the transition joint (X direction). The difference between the displacement of the AC and CS represents the differential displacement (DD). It is thought that DD can affect the performance of an ACP-PCCP transition [
Figure 10 illustrates the vertical DD, noting that for the COFs of 0.7 and 1.5, in the time instants when the tires were mainly supported on the AC (29.1 ms and 52.6 ms), the maximum vertical DD was experienced, On the contrary, when the tires were mainly supported on the CS (152.4 ms and 178.8 ms) the vertical DD was approximately 35 % lower than the maximum vertical DD. This could be caused mainly by the difference in stiffness between the AC and the concrete since the modulus of the concrete is high compared to the AC allowing for smaller displacements. As the tires advanced above the joint (78.99 ms to 131.79 ms) the tire-pavement contact pressure was progressively distributed in the CS leading to the progressive reduction of the vertical DD.
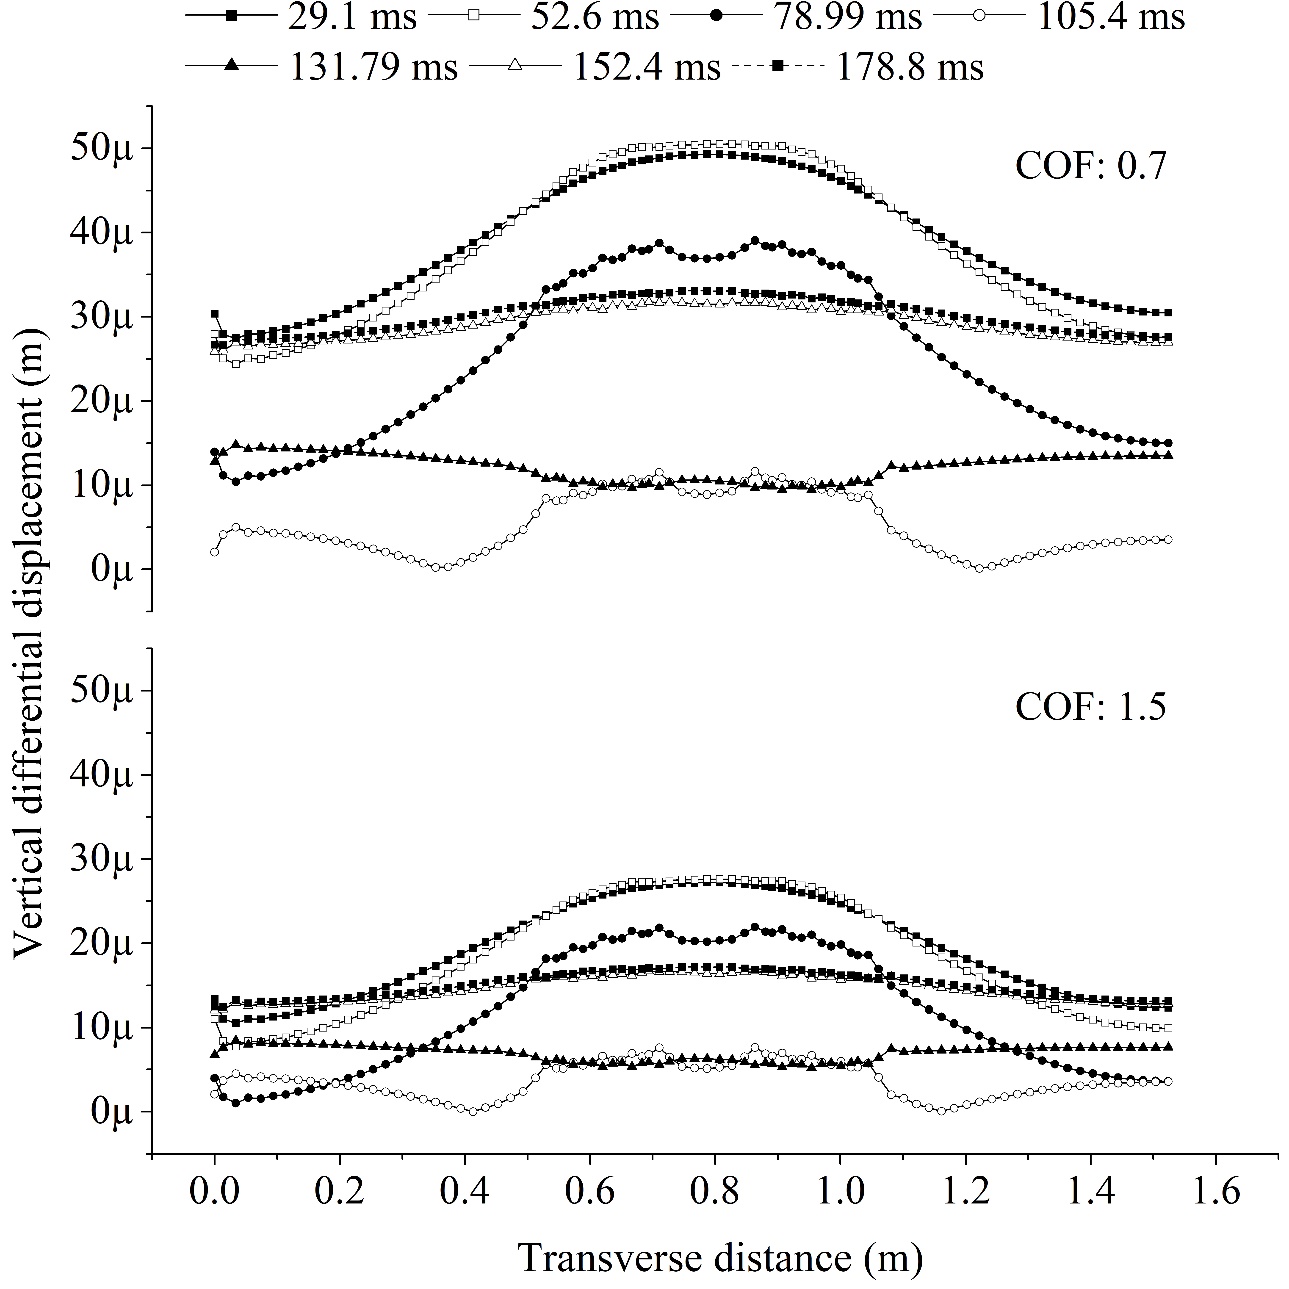
On the other hand, just below the tires, the highest vertical DD of the joint was experienced (at all time instants), since the vertical DD increased between 0.5 m and 1.1 m, the distance where it was located to the loading area. In addition, increasing the CA-concrete interface bond reduced the vertical DD by approximately 47 % at each time instant, therefore, increasing the interface bond may be conservative.
Figure 11 reveals that the difference in stiffness between the AC and the concrete also affects the longitudinal DD of the joint, since the maximum DD occurred at the instant when the tires were mainly supported on the AC (78.99 ms), in the following time instants (105.4 ms to 178.8 ms) the maximum longitudinal DD was reduced between 17 % to 61 % when the tires were mainly supported on the CS.
Even though longitudinal DD was about 0.5 % of the maximum vertical DD (almost negligible), the longitudinal DD may increase due to the cyclic vehicle traffic. On the other hand, increasing the AC-concrete interface bonding reduces longitudinal DD, though not significantly, since increasing the COF from 0.7 to 1.5 caused approximately a 9 % reduction of the longitudinal DD at each time instant. It is worth mentioning that the data in Figure 10 presented dispersion due to its low magnitude and the vertical scale used for visualization.
3.3. Tensile strains at the bottom of the AC
Figure 12 illustrates the longitudinal and transverse tensile strains at the bottom of the AC (εL and εT, respectively). These strains were analyzed since they are related to fatigue cracking [
According to Figure 12, the direct ACP-PCCP transition might not develop cracking at the bottom of the AC, or its development might be delayed since the maximum εL in the ACP (51με) was reduced to one-third in the direct ACP-PCCP transition (16.9 με). On the other hand, even though the maximum εT (23.5 με) at the direct ACP-PCCP transition was about 2 times higher than that of the ACP (12.5 με), its magnitude was 50 % lower than the maximum εL at the ACP, therefore, the increase in εT was negligible. Furthermore, increasing the AC-concrete interface bonding might be conservative for fatigue cracking, since increasing the COF from 0.7 to 1.5 reduced the εL and εT by 6 % and 9 %, respectively. It is worth noting that the maximum tensile strains were experienced at 52.6 ms, when the tires were supported on the AC, near the edge of the joint (Figure 8).
3.4. Near-surface shear strains of the AC
The near-surface vertical shear strains are related to top-down cracking of the AC [
Figure 13b allows observing that the effect on the shear strain in the XZ plane (εXZ) caused by the sudden change from AC to concrete and the increased AC-concrete interface bonding was not significant since the maximum εXZ was 1.6 % lower than the maximum εXZ (61 με) in the ACP and increasing the COF reduced the εXZ by approximately 2 %. On the other hand, it is important to mention that the maximum εYZ and εXZ were exhibited just below the tires.
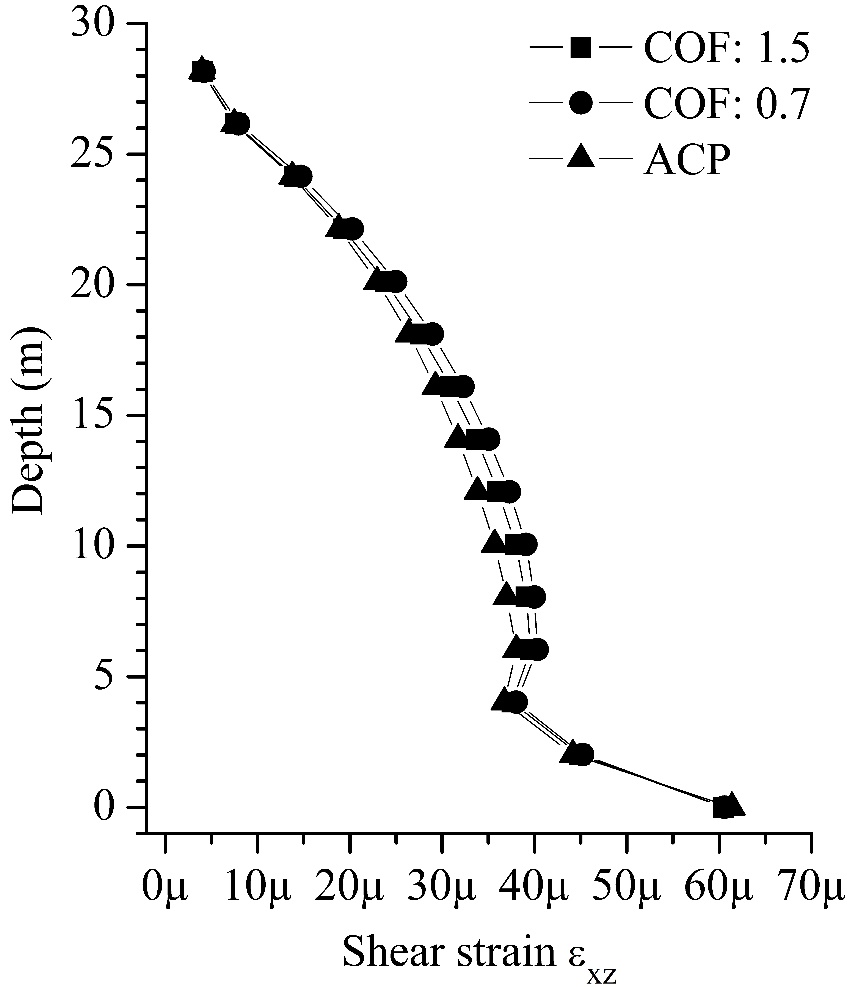
Figure 14 shows that up to 40 mm below the AC surface, the εYZ was 2.6 to 3 times higher than that of the ACP. At the direct ACP-PCCP transition and ACP, the εYZ gradually increased within the thickness until it reached its maximum magnitude at 40mm below the surface. The maximum εYZ was approximately 1.5 times greater than the surface εYZ. At depths greater than 40 mm the εYZ gradually decreased.
Therefore, premature near-surface cracking may initiate in the upper 40 mm of the AC. On the other hand, the effect on the εYZ caused by increasing the AC-concrete interface bonding was not significant in the upper 40 mm of the AC since increasing the COF caused between 1.1 % and 1.8 % increase in the εYZ. Figure 15 shows that the effect on the near-surface εXZ that causes the sudden change from AC to concrete, and the increase AC-concrete interface bonding might be negligible since the maximum εXZ of the direct ACP-PCCP transition was similar to that of the ACP (difference of 1.3 %), furthermore, up to 40 mm below the surface the difference between the εXZ of the direct ACP-PCCP transition and that of ACP ranged between 1.3 % and 3.3 % and, increasing the COF caused a reduction of the εXZ between 0.2 % and 1.2 %. The εXZ decreased with increasing depth in the AC, even though at depths greater than 40 mm the εXZ was approximately 15 % greater than that of the ACP, this increase may be depreciable due to its low magnitude compared to the maximum εXZ.
The contours of εYZ within the AC at 152.4 ms are illustrated in Figure 16. It is observed that the sudden change from AC to concrete is not conservative for the AC near the joint surface due to the relatively high εYZ experienced. In this regard, in the ACP the εYZ was rapidly reduced in the X direction, e.g., at 60 mm from the outer rib the εYZ decreased to - 1.3με (3.4 % of the maximum εYZ), on the contrary, at the transition joint at 60 mm from the outer rib, the εYZ decreased to - 65 με (63 % of the maximum εYZ), this strain was 1.7 times greater than the maximum εYZ of the ACP and, at distances greater than 60 mm the εYZ was not less than -61 με (1.6 times greater). Thus, premature near-surface cracking may also be developed along the joint.
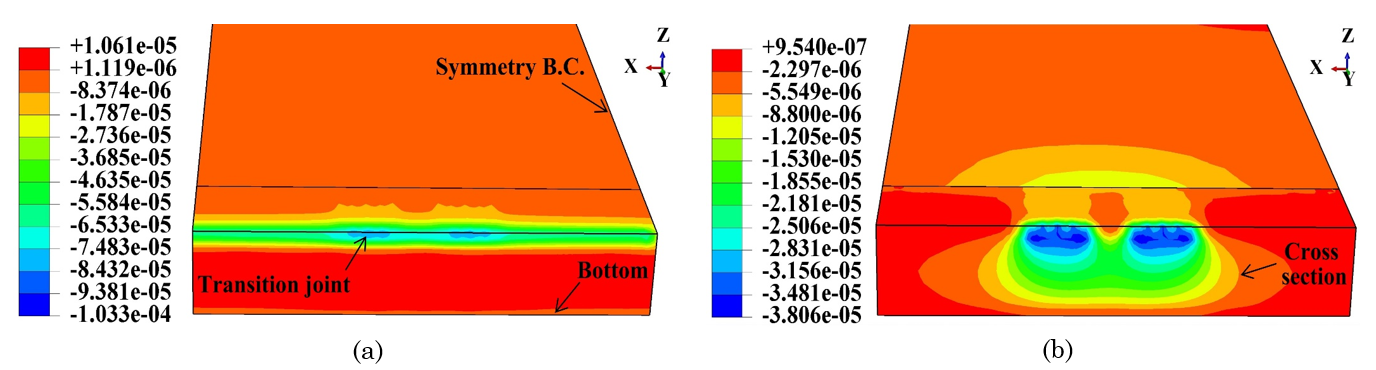
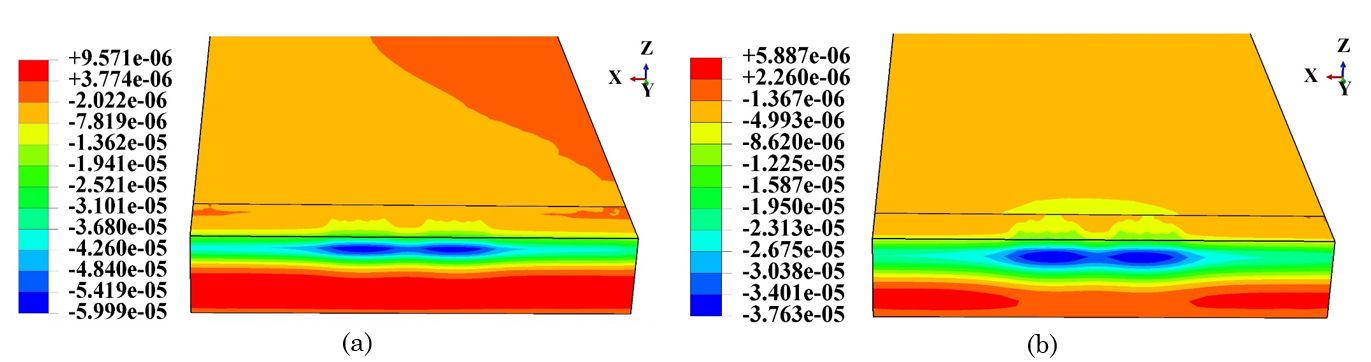
Figure 16 also illustrates that even near the joint the AC experiences relatively high εYZ, for instance, the maximum εYZ measured at 72 mm from the joint just below the tires was 1.6 times higher than the maximum εYZ in the ACP (Figure 17a). Even though the εYZ (37.6 με) at 122 mm from the joint was reduced, it was similar to the maximum εYZ in the ACP. Therefore, the AC may experience premature near-surface cracking to an extent of 122 mm from the transition joint mainly below the tires. Finally, it should be considered that poor compaction near the joint could also contribute to premature cracking of the AC.
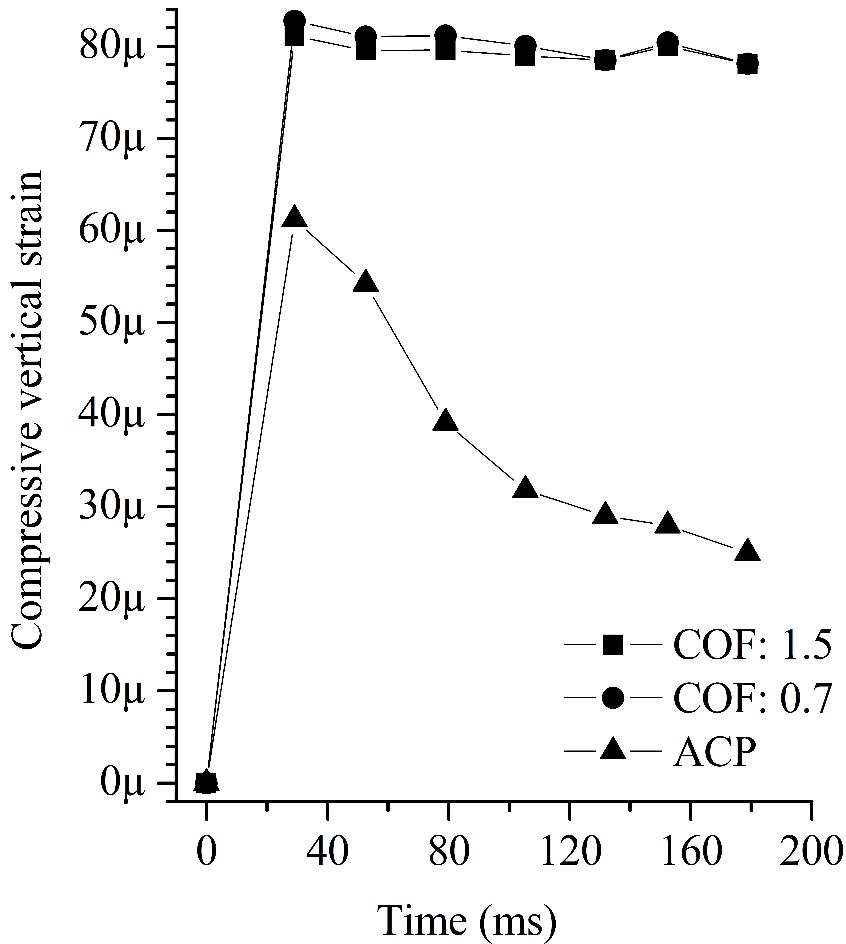
3.5. Compressive vertical strain on the subgrade top
The vertical compressive strain on the subgrade top (εZ) was analyzed since it is related to rutting development. According to Figure 18, in the direct ACP-PCCP transition, premature rutting might occur since the maximum εZ was about 1.26 times higher than that of ACP. Even though later the maximum εZ decreased by about 5 %, at the end of the simulation, the εZ was 3.1 times higher than that of the ACP. On the other hand, the effect on the maximum εZ caused by increasing the AC-concrete interface bonding might be negligible since increasing the COF reduced the maximum εZ by approximately 2 %. Furthermore, when the tires were mainly supported on the CS, no variation of εZ was observed with increasing COF.
3.6. Tensile stresses in the CS
Longitudinal (σL) and transverse (σT) stresses were analyzed since cracking can develop when they exceed the tensile strength of the concrete. Figure 19a and Figure 19b illustrate σL and Figure 19c and Figure 19d illustrate σT where positive indicates tensile stress and negative indicates compressive stress. As expected, compressive stresses were experienced mainly at the CS surface below the tires, however, at depths greater than 60 mm from the surface, the σL and σT changed to tension.
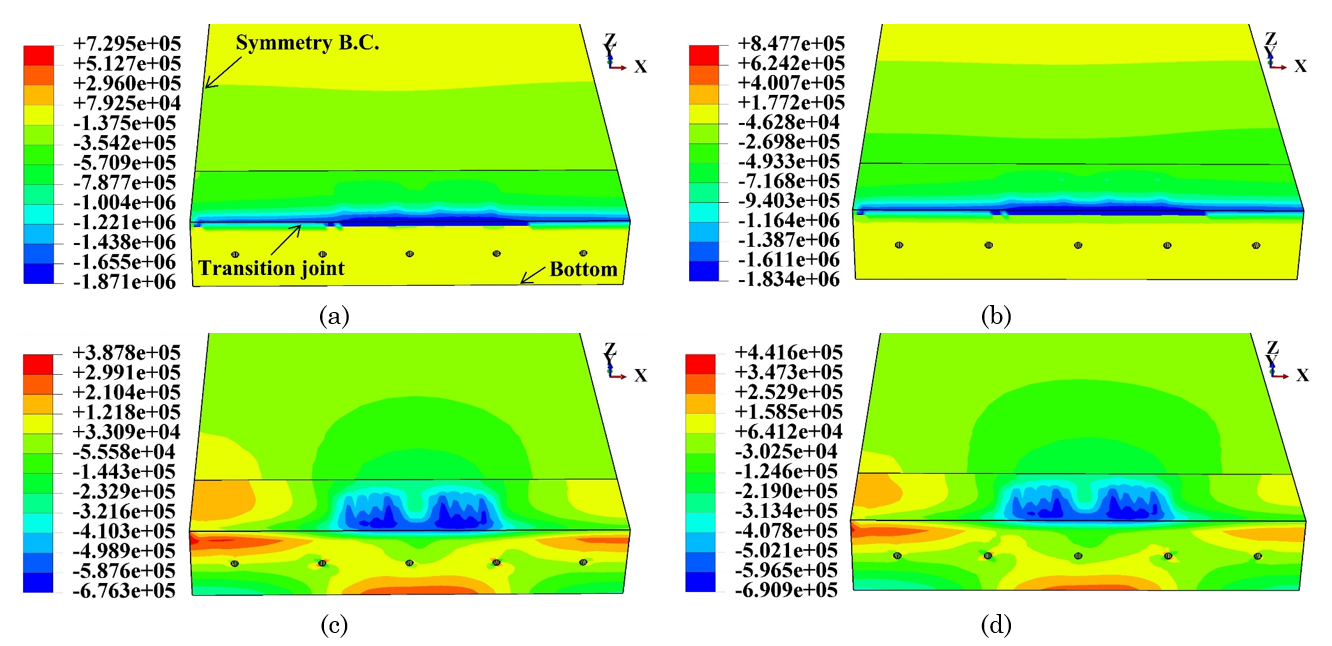
The maximum tensile σL and σT were around 0.27 MPa and 0.39 MPa, respectively. In this study the concrete had a tensile strength of 4.1 MPa [25], therefore, the simulated vehicular loading could not cause cracking of the concrete due to the wide difference between the concrete strength and the measured stresses. On the other hand, it was observed that increasing the AC-concrete interface bonding reduced the maximum tensile σL and σT by 3 % and 1.6 %, respectively, however, this effect might be negligible due to the low magnitude of the reduction.
4. CONCLUSIONS
The mechanical responses of a direct ACP-PCCP transition under moving vehicular loading were determined by dynamic FE analysis in order to identify failure mechanisms. In this study, COFs of 1.5 and 0.7 were used to represent good and acceptable AC-concrete interface bonding during the simulations. Lower COFs represented interface debonding. The mechanical responses of the direct ACP-PCCP transition were compared against those of an ACP. The failure mechanisms identified were: (1) near-surface shear strain of the AC (up to 40mm below the surface) with magnitude 1.6 to 3 times greater than that of the ACP mainly at the joint and below the tires, even though this strain was significant up to 122 mm from the joint, therefore, premature near-surface cracking of the AC may happen mainly near and along the joint; (2) compressive vertical strain on the subgrade top with magnitude 1.26 to 3.1 times greater than that of the ACP which might cause premature rutting; and (3) vertical differential displacement at the joint surface related to the difference in stiffness between the AC and the concrete and which could affect the pavement performance mainly under the tires. On the other hand, it was established that the tensile strains at the bottom of the AC might not cause cracking or delay its development since the strains were up to 50 % smaller than those of the ACP. In this study, the tensile stresses in the CS were also analyzed and compared against the concrete tensile strength, in this regard, it was determined that the CS could not develop cracks due to the wide difference between the concrete strength and the measured stresses. In addition, increasing the AC-concrete interface bonding might be (1) conservative on the tensile strains at the bottom of the AC and vertical differential displacement since it allows reducing the magnitude of the response, and (2) negligible on the near-surface shear strain of the AC, compressive vertical strain at the subgrade top, and tensile stresses in the CS since it does not cause a significant variation in the magnitude of the response.
5. ACKNOWLEDGMENTS AND FUNDING
The research presented here was funded by the Corporación Universitaria Minuto de Dios (project code CS119-052). Special thanks to Jhon Vladimir Acevedo Pérez for his support and contributions to this research project.
CONFLICTS OF INTEREST
The author has no conflict of interest with other entities or researchers.
6. REFERENCES
- arrow_upward [1] D. H. Chen and M. Won, “Field performance with state-of-the-art patching repair material,” Constr Build Mater, vol. 93, pp. 393–403, Sep. 2015, https://doi.org/10.1016/j.conbuildmat.2015.06.002
- arrow_upward [2] Y. su Jung, D. G. Zollinger, and S. D. Tayabji, “Best Design and Construction Practices for Concrete Pavement Transition Areas,” Texas, USA, 2006. Accessed: Jan. 09, 2021. [Online]. Available: http://tti.tamu.edu/documents/0-5320-1.pdf
- arrow_upward [3] California Department of Transportation, “Rigid Pavement,” California, USA, 2019. Accessed: Apr. 13, 2021. [Online]. Available: https://dot.ca.gov/programs/design/manual-highway-design-manual-hdm
- arrow_upward [4] W. Zhou, M. Won, and P. Choi, “Performance Evaluation of Whitetopping with Improved Design Practices in Texas,” J Test Eval, vol. 47, no. 3, p. 20170665, May 2019, https://doi.org/10.1520/JTE20170665
- arrow_upward [5] S. A. Vargas-Diaz and J. V. Acevedo-Pérez, “Consideraciones para el Análisis de Pavimento Flexible y Rígido Mediante Elementos Finitos con Aplicaciones de Abaqus,” Revista de Tecnología, vol. 18, no. 2, pp. 1-25, Sep. 2019, [Online]. Available: https://revistas.unbosque.edu.co/index.php/RevTec/article/view/4091
- arrow_upward [6] M. A. Elseifi, J. Baek, and N. Dhakal, “Review of modelling crack initiation and propagation in flexible pavements using the finite element method,” International Journal of Pavement Engineering, vol. 19, no. 3, pp. 251–263, Mar. 2018, https://doi.org/10.1080/10298436.2017.1345555
- arrow_upward [7] Y.-H. Cho, B. F. McCullough, and J. Weissmann, “Considerations on Finite-Element Method Application in Pavement Structural Analysis,” Transportation Research Record: Journal of the Transportation Research Board, vol. 1539, no. 1, pp. 96–101, Jan. 1996, https://doi.org/10.1177/0361198196153900113
- arrow_upward [8] J. Kim and K. D. Hjelmstad, “Three-Dimensional Finite Element Analysis of Doweled Joints for Airport Pavements,” Transportation Research Record: Journal of the Transportation Research Board, vol. 1853, no. 1, pp. 100–109, Jan. 2003, https://doi.org/10.3141/1853-12
- arrow_upward [9] M. Y. Riad, S. N. Shoukry, G. W. William, and M. R. Fahmy, “Effect of skewed joints on the performance of jointed concrete pavement through 3D dynamic finite element analysis,” International Journal of Pavement Engineering, vol. 10, no. 4, pp. 251–263, Aug. 2009, https://doi.org/10.1080/10298430701771783
- arrow_upward [10] Y. Ma, H. Kim, I. Kim, and Y.-H. Cho, “Development of a mechanistic-empirical prediction model for joint spalling distress in concrete pavements,” Constr Build Mater, vol. 44, pp. 276–286, Jul. 2013, https://doi.org/10.1016/j.conbuildmat.2013.03.029
- arrow_upward [11] Z. Leng, H. Ozer, I. L. Al-Qadi, and S. H. Carpenter, “Interface Bonding between Hot-Mix Asphalt and Various Portland Cement Concrete Surfaces: Laboratory Assessment,” Transportation Research Record: Journal of the Transportation Research Board, vol. 2057, no. 1, pp. 46–53, Jan. 2008, https://doi.org/10.3141/2057-06
- arrow_upward [12] H. Ozer, I. L. Al-Qadi, and Z. Leng, “Fracture-Based Friction Model for Pavement Interface Characterization,” Transportation Research Record: Journal of the Transportation Research Board, vol. 2057, no. 1, pp. 54–63, Jan. 2008, https://doi.org/10.3141/2057-07
- arrow_upward [13] H. Ozer, I. L. Al-Qadi, H. Wang, and Z. Leng, “Characterisation of interface bonding between hot-mix asphalt overlay and concrete pavements: modelling and in-situ response to accelerated loading,” International Journal of Pavement Engineering, vol. 13, no. 2, pp. 181–196, Apr. 2012, https://doi.org/10.1080/10298436.2011.596935
- arrow_upward [14] P. J. Yoo, I. L. Al-Qadi, M. A. Elseifi, and I. Janajreh, “Flexible pavement responses to different loading amplitudes considering layer interface condition and lateral shear forces,” International Journal of Pavement Engineering, vol. 7, no. 1, pp. 73–86, Mar. 2006, https://doi.org/10.1080/10298430500516074
- arrow_upward [15] J. Ling, F. Wei, H. Zhao, Y. Tian, B. Han, and Z. Chen, “Analysis of airfield composite pavement responses using full-scale accelerated pavement testing and finite element method,” Constr Build Mater, vol. 212, pp. 596–606, Jul. 2019, https://doi.org/10.1016/j.conbuildmat.2019.03.336
- arrow_upward [16] Y. Seo and S.-M. Kim, “Longitudinal cracking at transverse joints caused by dowel bars in Jointed Concrete Pavements,” KSCE Journal of Civil Engineering, vol. 17, no. 2, pp. 395–402, Mar. 2013, https://doi.org/10.1007/s12205-013-2047-5
- arrow_upward [17] J. A. Hernandez, A. Gamez, I. L. Al-Qadi, and M. de Beer, “Analytical Approach for Predicting Three-Dimensional Tire–Pavement Contact Load,” Transportation Research Record: Journal of the Transportation Research Board, vol. 2456, no. 1, pp. 75–84, Jan. 2014, https://doi.org/10.3141/2456-08
- arrow_upward [18] J. A. Hernandez and I. L. Al-Qadi, “Hyperelastic Modeling of Wide-Base Tire and Prediction of Its Contact Stresses,” J Eng Mech, vol. 142, no. 2, p. 4015084, Feb. 2016, https://doi.org/10.1061/(ASCE)EM.1943-7889.0001007
- arrow_upward [19] M. Guo and X. Zhou, “Tire-Pavement Contact Stress Characteristics and Critical Slip Ratio at Multiple Working Conditions,” Advances in Materials Science and Engineering, vol. 2019, pp. 1–11, Aug. 2019, https://doi.org/10.1155/2019/5178516
- arrow_upward [20] J. A. Hernandez and I. L. Al-Qadi, “Airfield Pavement Response Caused by Heavy Aircraft Takeoff: Advanced Modeling for Consideration of Wheel Interaction,” Transportation Research Record: Journal of the Transportation Research Board, vol. 2471, no. 1, pp. 40–47, Jan. 2015, https://doi.org/10.3141/2471-06
- arrow_upward [21] S.-M. Kim, M. K. Darabi, D. N. Little, and R. K. Abu Al-Rub, “Effect of the Realistic Tire Contact Pressure on the Rutting Performance of Asphaltic Concrete Pavements,” KSCE Journal of Civil Engineering, vol. 22, no. 6, pp. 2138–2146, Jun. 2018, https://doi.org/10.1007/s12205-018-4846-1
- arrow_upward [22] I. L. Al-Qadi and P. J. Yoo, “Effect of surface tangential contact stresses on flexible pavement response,” in Asphalt Paving Technology: Association of Asphalt Paving Technologists-Proceedings of the Technical Sessions, 2007, vol. 76, pp. 663–692. [Online]. Available: https://www.scopus.com/inward/record.uri?eid=2-s2.0-49649086957&partnerID=40&md5=d8b8cac98703db35aec0044d54741826
- arrow_upward [23] M. Keymanesh, M. M. Babaki, N. Shahriari, and A. Pirhadi, “Evaluating the Performance of Dowel in PCC Pavement of Roads using ABAQUS Finite Element Software,” International Journal of Transportation Engineering, vol. 5, no. 4, pp. 349–365, Oct. 2018, https://doi.org/10.22119/ijte.2018.47765
- arrow_upward [24] A. E. Abu El-Maaty, G. M. Hekal, and E. M. Salah El-Din, “Modeling of Dowel Jointed Rigid Airfield Pavement under Thermal Gradients and Dynamic Loads,” Civil Engineering Journal, vol. 2, no. 2, pp. 38–51, Feb. 2016, https://doi.org/10.28991/cej-2016-00000011
- arrow_upward [25] L. P. Priddy, J. D. Doyle, G. W. Flintsch, D. W. Pittman, and G. L. Anderton, “Three-dimensional modelling of precast concrete pavement repair joints,” Magazine of Concrete Research, vol. 67, no. 10, pp. 513–522, May 2015, https://doi.org/10.1680/macr.14.00278
- arrow_upward [26] V. Sadeghi and S. Hesami, “Investigation of load transfer efficiency in jointed plain concrete pavements (JPCP) using FEM,” International Journal of Pavement Research and Technology, vol. 11, no. 3, pp. 245–252, May 2018, https://doi.org/10.1016/j.ijprt.2017.10.001
- arrow_upward [27] G. A. Shafabakhsh, M. Vafaei, N. Amiri, and A. Famili, “Dynamic Effects of Moving Loads on the Jointed Plain Concrete Pavement Responses,” Engineering Journal, vol. 21, no. 5, pp. 137–144, Sep. 2017, https://doi.org/10.4186/ej.2017.21.5.137
- arrow_upward [28] M. A. Elseifi, I. L. Al-Qadi, and P. J. Yoo, “Viscoelastic Modeling and Field Validation of Flexible Pavements,” J Eng Mech, vol. 132, no. 2, pp. 172–178, Feb. 2006, https://doi.org/10.1061/(ASCE)0733-9399(2006)132:2(172)
- arrow_upward [29] P. J. Yoo and I. L. Al-Qadi, “The truth and myth of fatigue cracking potential in hot-mix asphalt: Numerical analysis and validation,” in Asphalt Paving Technology: Association of Asphalt Paving Technologists-Proceedings of the Technical Sessions, Apr. 2008, vol. 77, pp. 549–590. [Online]. Available: https://www.scopus.com/inward/record.uri?eid=2-s2.0-64549160292&partnerID=40&md5=d1fc85cbcdeb88d34388e2d03d227099
- arrow_upward [30] P. J. Yoo and I. L. Al-Qadi, “Effect of Transient Dynamic Loading on Flexible Pavements,” Transportation Research Record: Journal of the Transportation Research Board, vol. 1990, no. 1, pp. 129–140, Jan. 2007, https://doi.org/10.3141/1990-15
- arrow_upward [31] H. Wang and I. L. Al-Qadi, “Importance of Nonlinear Anisotropic Modeling of Granular Base for Predicting Maximum Viscoelastic Pavement Responses under Moving Vehicular Loading,” J Eng Mech, vol. 139, no. 1, pp. 29–38, Jan. 2013, https://doi.org/10.1061/(ASCE)EM.1943-7889.0000465
- arrow_upward [32] I. L. Al-Qadi, H. Wang, and E. Tutumluer, “Dynamic Analysis of Thin Asphalt Pavements by Using Cross-Anisotropic Stress-Dependent Properties for Granular Layer,” Transportation Research Record: Journal of the Transportation Research Board, vol. 2154, no. 1, pp. 156–163, Jan. 2010, https://doi.org/10.3141/2154-16
- arrow_upward [33] M. Kim, E. Tutumluer, and J. Kwon, “Nonlinear Pavement Foundation Modeling for Three-Dimensional Finite-Element Analysis of Flexible Pavements,” International Journal of Geomechanics, vol. 9, no. 5, pp. 195–208, Oct. 2009, https://doi.org/10.1061/(ASCE)1532-3641(2009)9:5(195)
- arrow_upward [34] I. L. Al-Qadi, H. Wang, P. J. Yoo, and S. H. Dessouky, “Dynamic Analysis and in Situ Validation of Perpetual Pavement Response to Vehicular Loading,” Transportation Research Record: Journal of the Transportation Research Board, vol. 2087, no. 1, pp. 29–39, Jan. 2008, https://doi.org/10.3141/2087-04
- arrow_upward [35] P. Liu, V. Ravee, D. Wang, and M. Oeser, “Study of the influence of pavement unevenness on the mechanical response of asphalt pavement by means of the finite element method,” Journal of Traffic and Transportation Engineering (English Edition), vol. 5, no. 3, pp. 169–180, Jun. 2018, https://doi.org/10.1016/j.jtte.2017.12.001
- arrow_upward [36] A. González, “Resumen de fallas de losas sistema Transmilenio Autopista Norte y Avenida Caracas,” Sociedad Colombiana de Ingenieros. pp. 1–37, 2015. [Online]. Available: https://sci.org.co/troncal-caracas/
- arrow_upward [37] M. Irfan, A. S. Waraich, S. Ahmed, and Y. Ali, “Characterization of Various Plant-Produced Asphalt Concrete Mixtures Using Dynamic Modulus Test,” Advances in Materials Science and Engineering, vol. 2016, pp. 1–12, 2016, https://doi.org/10.1155/2016/5618427
- arrow_upward [38] Urban Development Institute, “Especificación técnica: mezclas asfálticas en caliente, densas, semidensas, gruesas, y de alto módulo,” 2011. Accessed: May. 08, 2021. [Online]. Available: https://www.idu.gov.co/web/content/7623/510-11.pdf
- arrow_upward [39] L. Li et al., “Investigation of Prony series model related asphalt mixture properties under different confining pressures,” Constr Build Mater, vol. 166, pp. 147–157, Mar. 2018, https://doi.org/10.1016/j.conbuildmat.2018.01.120
- arrow_upward [40] S. W. Park and R. A. Schapery, “Methods of interconversion between linear viscoelastic material functions. Part I—a numerical method based on Prony series,” Int J Solids Struct, vol. 36, no. 11, pp. 1653–1675, Apr. 1999, https://doi.org/10.1016/S0020-7683(98)00055-9
- arrow_upward [41] J. Baek, “Modeling reflective cracking development in hot-mix asphalt overlays and quantification of control techniques,” p. 159, 2010, [Online]. Available: http://hdl.handle.net/2142/16021
- arrow_upward [42] J. A. Hernandez, I. Al-Qadi, and M. de Beer, “Impact of Tire Loading and Tire Pressure on Measured 3D Contact Stresses,” in Airfield and Highway Pavement 2013, Jun. 2013, pp. 551–560. https://doi.org/10.1061/9780784413005.044
- arrow_upward [43] University of the Andes, “Determinación del peso por eje de los buses articulados y buses alimentadores del sistema Transmilenio,” Bogotá, Colombia, 2004. Accessed: May. 14, 2021. [Online]. Available: https://www.idu.gov.co/web/content/7454/determinacion_peso_eje_buses_25nov14.pdf
- arrow_upward [44] S. Caro, D. Castillo, and M. Sánchez-Silva, “Methodology for Modeling the Uncertainty of Material Properties in Asphalt Pavements,” Journal of Materials in Civil Engineering, vol. 26, no. 3, pp. 440–448, Mar. 2014, https://doi.org/10.1061/(ASCE)MT.1943-5533.0000841
- arrow_upward [45] O. E. Gungor, I. L. Al-Qadi, A. Gamez, and J. A. Hernandez, “In-Situ Validation of Three-Dimensional Pavement Finite Element Models,” in The Roles of Accelerated Pavement Testing in Pavement Sustainability, L. G. Loría-Salazar, F. Leiva-Villacorta, J. P. Aguiar-Moya, and A. Vargas-Nordcbeck, Eds. Cham: Springer International Publishing, 2016, pp. 145–159. https://doi.org/10.1007/978-3-319-42797-3_10