Design of Influent Distribution System in Domestic Wastewater Treatment Units
Diseño del sistema de distribución del afluente en unidades de tratamiento de aguas residuales domésticas
 PDF
PDF
Received: June 17, 2022
Accepted: September 23, 2022
Available: November 18, 2022
A. L. Macías, D. C. Rodríguez, F. J. Molina, “Design of Influent Distribution System in Domestic Wastewater Treatment Units,” TecnoLógicas, vol. 25, nro. 55, e2428, 2022. https://doi.org/10.22430/22565337.2428
Highlights
Abstract
The efficient treatment of domestic wastewater is associated with good operational practices in wastewater treatment plants (WWTP) and the proper design of each treatment unit, which ensures the correct hydraulic performance of each WWTP. For this reason, the objective of this article was to study the design of the multiple influent distribution systems of a high-rate primary sedimentary, a UASB (Upflow Anaerobic Sludge Blanket) reactor, and an up-flow anaerobic filter (FAFA) in the WWTPs of the municipalities of San Carlos and San Roque, and in the township of Santiago, respectively, located in Antioquia-Colombia. For this purpose, the methodology proposed by Hudson in 1981 was used to evaluate the performance of the current design and, subsequently, a pre-dimensioning was carried out to distribute the flow uniformly, to have velocities within the ranges recommended by the literature, and to obtain the total head loss generated by the distribution manifold in each treatment unit evaluated. It was found that the existing design is not efficient and that the new pre-dimensioning ensures homogeneous flow distribution and provides velocities that contribute positively to the treatment process. The study concludes that the smaller the number of orifices and the larger the pipe diameter, the more uniform the flow distribution, and that the total head loss depends on both the velocity head and the head loss coefficient. The diameter of the orifice was the predominant parameter to control the inlet velocity of the treatment units.
Keywords: Treatment plants, anaerobic reactors, primary settler, distribution system, wastewater treatment.
Resumen
El tratamiento eficiente de las aguas residuales domésticas está asociado a las buenas prácticas operacionales en las plantas de tratamiento de agua residual (PTAR) y al diseño adecuado de cada unidad de tratamiento, con lo cual se asegura el correcto funcionamiento hidráulico de cada PTAR. Por tal motivo, el objetivo de este artículo fue estudiar el diseño de los múltiples sistemas de distribución del afluente de un sedimentador primario de alta tasa, un reactor UASB (Upflow Anaerobic Sludge Blanket) y un filtro anaerobio de flujo ascendente (FAFA) en las PTAR de los municipios de San Carlos y San Roque, y en el corregimiento de Santiago, respectivamente, ubicados en Antioquia-Colombia. Para ello, se utilizó la metodología propuesta por Hudson en 1981 para evaluar el funcionamiento del diseño actual y, posteriormente, se realizó un predimensionamiento que permitiera distribuir el caudal uniformemente, tener velocidades dentro de los rangos recomendados por la literatura y obtener la pérdida de carga total generada por el múltiple de distribución en cada unidad de tratamiento evaluada. Se evidenció que el diseño existente no es eficiente y que el nuevo predimensionamiento asegura la distribución homogénea del caudal y proporciona velocidades que contribuyen positivamente al proceso de tratamiento. El estudio concluye que a menor número de orificios y mayor diámetro de tubería se presenta una distribución uniforme del caudal, además que la pérdida de carga total depende, tanto de la cabeza de velocidad, como del coeficiente de pérdida de carga. El diámetro del orificio fue el parámetro predominante para controlar la velocidad de entrada a las unidades de tratamiento.
Palabras clave: Plantas de tratamiento, reactores anaerobios, sedimentador primario, sistemas de distribución, tratamiento de aguas residuales.
1. INTRODUCTION
Wastewater treatment plants (WWTP) protect water resources and human health by reducing the amount of carbon, nutrients, and pathogens discharged into the environment [
The design of the inlet area in a high-rate primary settler is considered of great importance since it allows the homogeneous distribution of the flow in each unit and thus avoids the generation of short circuits in the system, which contributes not only to guaranteeing good design, but also an adequate functioning of the other units [
In general, to distribute the influent flow of these treatment units homogeneously, pipes with multiple outlets are used, which consist of the main duct with lateral holes normally spaced at regular intervals [
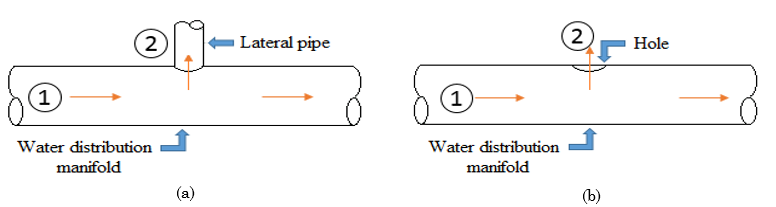
b) Pipe with multiple outlets in the form of a hole. Source: Created by the authors.

Where, h are the head losses between 1 m and 2 m, hL is the lateral entrance losses (due to the turn) (m), VL is the flow velocity in the lateral or hole (m/s) and g the acceleration of gravity (m/s2).
From (1) it is possible to develop and find the general expression for the total head loss coefficient (β), according to (2) [

Where, β is the coefficient of total head loss due to energy dissipation on the lateral, θ the coefficient of head loss at the input, φ the coefficient of head loss in the change of direction of the current, Vc the velocity in the distribution pipe (m/s) and VL the velocity in the laterals or holes (m/s). Furthermore, the losses through each hole ( h0) are calculated using the product of the head loss coefficient (β) and the speed head (VL2/2g), as shown in (3).

On the other hand, the total head loss coefficient (β) is related to two coefficients that adopt different experimental values according to Hudson [11], depending on the type of distribution, lateral type, adopting values of θ = 0.4, φ = 0.9 if the length of the lateral is greater than 3 times the diameter of the manifold and hole type, adopting values of θ = 0.7, and φ = 1.67, if the length of the lateral is less than or equal to 3 times the diameter of the distribution system.
Assuming that the head losses for each side are the same, to guarantee an adequate distribution and that the diameters of the holes or laterals are equal, it is possible to deduce (4) from a mass balance [

Where Qt is the total flow to distribute (m3/s), and AL is the area of each of the laterals or holes (m2). The previous equation will be useful to correct the speed of the first lateral or hole, for the other speed (5) is used [

Finally, to check the average speed gradient on the laterals or holes, (6) is used.

Where, γ is the density of water (kg/cm3), μ is the absolute viscosity (kg/cm2.s), f is the Darcy coefficient (Varies between 0.015 and 0.03) and Rh is the hydraulic radius of the section (m).
In wastewater treatment plants, the use of distribution systems is common, to carry out the entry and distribution of wastewater to both high-rate settlers and anaerobic reactors, for which it is necessary to verify and propose the appropriate conditions for these designs, based on the information that is available in the water purification systems. Based on the above, this work seeks to compare and evaluate the current design of the distribution systems at the entrance of the wastewater treatment units in three wastewater treatment plants in the region of Eastern Antioquia-Colombia, with the design, carried out through the methodology for high-rate settlers in purification plants and likewise, propose a design methodology and a pre-dimensioning for the distribution of wastewater in high-rate settlers and anaerobic reactors.
2. METHODS
2.1 Study area
The study was carried out in three wastewater treatment plants (WWTP), located in the eastern region of the department of Antioquia-Colombia, in San Roque and San Carlos municipalities and Santiago township belonging to the Santo Domingo municipality. San Carlos (Figure 2a) is a municipality with an extension of 702 km2 and a current total population of 16 064 inhabitants (6 031 correspond to the urban area and 10 033 to the rural area). Currently, it has a wastewater collection system that discharges to the treatment plant, which is subsequently discharged into the San Carlos River [
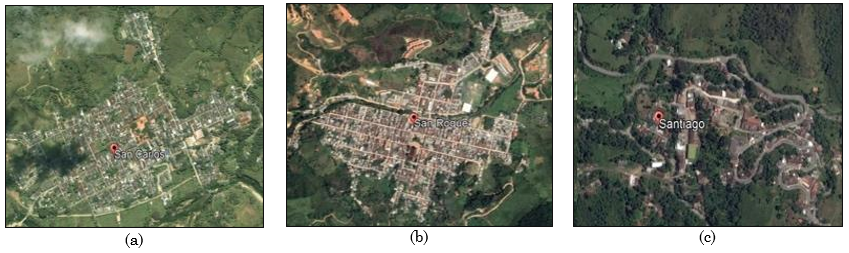
Source: Created by the authors based in Google Earth.
2.2 Wastewater treatment plants
San Carlos municipality WWTP has a preliminary treatment, consisting of an inlet channel, a lateral spillway (Figure 3a), two screening units and two-grit chamber (Figure 3b) and a Parshall gutter (Figure 3c) to measure the flow. A primary treatment, it has two high-rate primary settlers (Figure 3d), each one has two pipes with multiple outlets in its inlet area for the influent flow distribution, also, it has inclined asbestos-cement plates in its sedimentation area, two saw tooth gutters for effluent collection and a bottom sludge drain pipe that evacuates and transports the sludge to a pumping well, from which the sludge is pumped to an anaerobic digester (Figure 3e), by Lastly, there are five drying beds (Figure 3f) to dehydrate the sludge stabilized by the anaerobic digester.
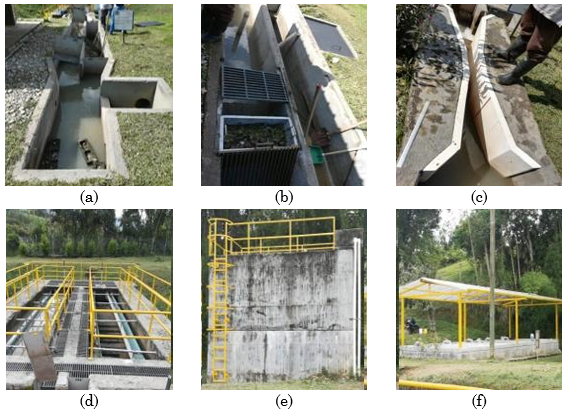
d) High-rate primary settlers. e) Anaerobic digester. f) Drying beds. Source: Created by the authors.
San Roque municipality WWTP has a preliminary treatment consisting of two screens with their respective baskets for cleaning them and two grit chamber in parallel (Figure 4a), these treatments are at a lower level compared to the other units of the WWTP, for this, there is a pumping station (Figure 4b) with 3 pumps (2 in operation and 1 enabled for emergencies situations) that fulfill the function of propelling the wastewater towards a UASB reactor (Figure 4c), consisting of 2 modules, each of which has a pipe with multiple outlets as influent flow distribution structure, a saw tooth gutter for the clarification collection and two sludge purge valves that discharge directly to 4 drying beds (Figure 4d), which carry out the dehydration of the sludge in the WWTP.
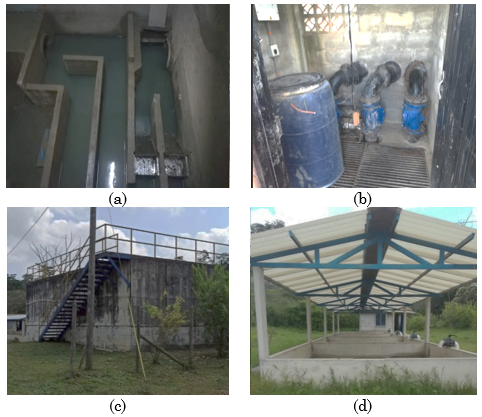
d) Drying beds. Source: Created by the authors.
Santiago township WWTP is compact and consists of a preliminary treatment (Figure 5a) that has an inlet channel, a screening (Figure 5b), and a grit chamber (Figure 5c). Subsequently, there are two anaerobic modules (Figure 5d) divided into four compartments each, the first two constitute septic tanks, the third is an Anaerobic Upflow Filter (FAFA) that has a pipe with outlets. Distribution system in its entrance structure and the room is a secondary settler. Finally, there are two drying beds (Figure 5e) in the WWTP connected to the anaerobic reactors to dehydrate the sludge.
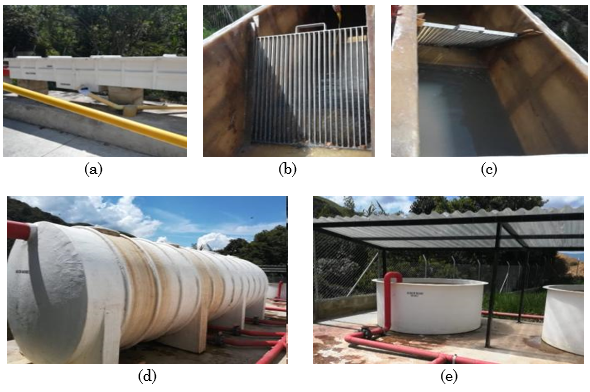
d) Anaerobic reactors. e) Drying beds. Source: Created by the authors.
2.3 Sizing of distribution system
An initial diagnosis of the existing design of the distribution system was made in the following treatment units: high-rate primary settlers in San Carlos municipality WWTP, UASB reactors in San Roque municipality WWTP and FAFA reactors in Santiago township WWTP, where the plans and design calculations were reviewed, to obtain data such as flow rates, number, and diameter of the holes and pipe diameters of the distribution system. From the collected data, the efficiency of the existing distribution system was evaluated, using the methodology proposed by Hudson [
Subsequently, after evaluating the design of the existing distribution pipes, a new pre-dimensioning was carried out that allowed for a better operation of the units, considering the uniform distribution of the flow, homogeneous head losses through the orifices and other variables for wastewater. Finally, a comparison was made between the design parameters before and after and between the different municipalities using graphs. The calculations were performed in Microsoft® Excel spreadsheet and the procedure used to evaluate the existing design of the distribution system in each WWTP, as well as for the pre-dimensioning, is presented below:
a) The methodology is based on an iterative process to find the total head loss coefficient (β) at the end of each iteration and correct the speed of each hole. For this, we start by assuming that the flow is distributed equally through each of the holes (i), a table is organized where the first column is the number of holes and the second column the flow of each hole (QLi), that is QLi = QDesign/number of holes
b)
Calculate the area of the hole with its diameter (DLi) (ALi = πDLi2/4) and then the speed for each side or hole (VLi = QLi/ALi), this speed will be put in column 3.
c)
In the fourth column is the flow of the pipe (Qci) after each hole. In the first row (Hole 1, i = 1) the total design flow will go and in the following ones it will decrease depending on the amount that comes out from each hole, that is, Qci=Qc(i-1)-QLi.
d)
Subsequently, the area of the pipe is found (Aci = πDci2/4), using its diameter (Dci). With this area and the flow (Qci) it is possible to find the velocity in the pipe (Vci = Qci/Aci), which is located in column 5.
e)
The relationship (Vci/VLi) 2 is found, to finally use (2) of the total head loss coefficient (β) and thus find this value for each hole (βi), shown in column 7. Besides, in column 8 of the table, it is possible to find the sum of 1/√(βi), to continue with the next iteration.
f)
In the last column, the losses for each hole are found; using (3), and then the total head losses for each treatment unit are found, by adding the losses in the holes or laterals.
g)
Another table is made equal to the previous one for the next iteration, but this time the uniform flow is not assumed, in this step we start with column 3 correcting the first velocity of the hole (VL1) using (4) and the others velocities (VLi) using (5).
h)
With the previous speed and the area of the hole (ALi) the flow in each hole (QLi=VLi*ALi), is calculated, which are located in the second column.
i)
The steps from numeral c) are followed until the results of the iterations are very similar. In this case, three iterations were made for each case since the values stabilized easily.
3. RESULTS AND DISCUSSION
3.1 Existing design evaluation of the distribution system
The existing dimensions of the distribution pipes in each of the treatment systems studied are shown in Table 1. In the case of San Carlos municipality WWTP, the flow is 40 L/s, therefore, the value used in the calculations was 10 L/s, this because the WWTP has 2 settlers (the flow is divided to 20 L/s in each settler) and each one with 2 distribution system (the flow is distributed at 10 L/s for each pipe). In the case of San Roque municipality WWTP, the dimensions of the distribution pipes and the number of holes were obtained from the plans of the treatment plant, where the design flow is 22.1 L/s and there are two UASB reactors, each with a distribution pipeline with manifolds, therefore, the flow used in the calculations was 11.05 L/s. Finally, in the case of Santiago township WWTP, field measurements were made with the reactors empty, because the dimensions were not found in plans and design spreadsheets of the system at the entrance of the FAFA. The design flow for this WWTP is 3.81 L/s, however, for the calculations it was taken as 1.905 L/s because the plant has two anaerobic reactors, therefore, the flow is distributed equally for both. In general, the diameters of the existing distribution pipes correspond to diameters of 8" for the high-rate settlers and the UASB reactors and 4" for the FAFA reactors and the diameters of the orifices of 3", 2" and 1 " respectively.
Source: Created by the authors.
| Parameter | High-rate primary settlers1 | UASB reactors2 | FAFA reactors3 |
| Total flow (m3/s) | 0.01 | 0.01 | 0.0019 |
| Number of holes (#) | 20.00 | 60.00 | 28.00 |
| Hole diameter (inch) | 3.00 | 2.00 | 1.00 |
| Pipe diameter (inch) | 8.00 | 8.00 | 4.00 |
| θ (dimensionless) | 0.70 | 0.70 | 0.70 |
| φ (dimensionless) | 1.67 | 1.67 | 1.67 |
1 San Carlos municipality; 2 San Roque municipality; 3 Santiago township.
θ: Coefficient of head loss at the input, φ: Coefficient of head
loss in the change of direction of the current.
The study carried out by [
Source: Created by the authors.
| Holes | QLi (m3/s) | VLi (m/s) | Qci (m3/s) | Vci (m/s) | (Vci/VLi)2 | βi | 1/√βi | ∆ho (m) | ||||
| 1 | 0.00019 | 0.04 | 0.010 | 0.31 | 55.72 | 94.75 | 0.10 | 0.0082 | ||||
| 2 | 0.00020 | 0.04 | 0.010 | 0.30 | 46.61 | 79.54 | 0.11 | 0.0080 | ||||
| 3 | 0.00022 | 0.05 | 0.010 | 0.30 | 38.59 | 66.15 | 0.12 | 0.0077 | ||||
| 4 | 0.00023 | 0.05 | 0.009 | 0.29 | 31.60 | 54.47 | 0.14 | 0.0074 | ||||
| 5 | 0.00025 | 0.06 | 0.009 | 0.28 | 25.55 | 44.36 | 0.15 | 0.0071 | ||||
| 6 | 0.00028 | 0.06 | 0.009 | 0.27 | 20.37 | 35.72 | 0.17 | 0.0067 | ||||
| 7 | 0.00030 | 0.07 | 0.009 | 0.27 | 16.00 | 28.42 | 0.19 | 0.0064 | ||||
| 8 | 0.00033 | 0.07 | 0.008 | 0.26 | 12.35 | 22.33 | 0.21 | 0.0061 | ||||
| 9 | 0.00037 | 0.08 | 0.008 | 0.25 | 9.36 | 17.33 | 0.24 | 0.0057 | ||||
| 10 | 0.00041 | 0.09 | 0.008 | 0.24 | 6.95 | 13.30 | 0.27 | 0.0054 | ||||
| 11 | 0.00045 | 0.10 | 0.007 | 0.22 | 5.04 | 10.12 | 0.31 | 0.0051 | ||||
| 12 | 0.00050 | 0.11 | 0.007 | 0.21 | 3.56 | 7.65 | 0.36 | 0.0048 | ||||
| 13 | 0.00056 | 0.12 | 0.006 | 0.19 | 2.45 | 5.79 | 0.42 | 0.0045 | ||||
| 14 | 0.00063 | 0.14 | 0.006 | 0.18 | 1.64 | 4.43 | 0.48 | 0.0043 | ||||
| 15 | 0.00070 | 0.15 | 0.005 | 0.16 | 1.05 | 3.46 | 0.54 | 0.0041 | ||||
| 16 | 0.00076 | 0.17 | 0.004 | 0.13 | 0.65 | 2.78 | 0.60 | 0.0040 | ||||
| 17 | 0.00083 | 0.18 | 0.004 | 0.11 | 0.37 | 2.32 | 0.66 | 0.0039 | ||||
| 18 | 0.00089 | 0.19 | 0.003 | 0.09 | 0.19 | 2.02 | 0.70 | 0.0039 | ||||
| 19 | 0.00093 | 0.20 | 0.002 | 0.06 | 0.08 | 1.84 | 0.74 | 0.0039 | ||||
| 20 | 0.00096 | 0.21 | 0.001 | 0.03 | 0.02 | 1.73 | 0.76 | 0.0039 | ||||
| Total flow | 0.01000 | Total loss | 0.1100 | |||||||||
| Flow difference (%) | 80.36000 | |||||||||||
In the case of the UASB reactors in San Roque municipality WWTP (Table 3), it is shown that the flow difference, in this case, is 87.10 %, this value being much greater than the 10 % allowed, besides, the losses varied between values of 0.0099 m in the first hole and 0.0038 m in the last hole, with total losses of 0.39 m for the treatment unit. With the above, it is evident that the design of these distribution system in these reactors is not adequate. In this case, since the UASB reactors are a biological process, the distribution of the flow not only affects the hydraulics of the reactor but also affects the contact of the microorganisms with the wastewater, decreasing the efficiency of the process for the removal of the material organic present.
Source: Created by the authors.
| Holes | QLi (m3/s) | VLi (m/s) | Qci (m3/s) | Vci (m/s) | (Vci/VLi)2 | βi | 1/√βi | ∆ho (m) |
| 1 | 0.000055 | 0.03 | 0.011 | 0.34 | 157.95 | 265.48 | 0.061 | 0.0099 |
| 2 | 0.000056 | 0.03 | 0.011 | 0.34 | 149.26 | 250.96 | 0.063 | 0.0099 |
| 3 | 0.000058 | 0.03 | 0.011 | 0.34 | 140.89 | 236.98 | 0.065 | 0.0098 |
| 4 | 0.000059 | 0.03 | 0.011 | 0.34 | 132.84 | 223.54 | 0.067 | 0.0097 |
| 5 | 0.000060 | 0.03 | 0.011 | 0.33 | 125.10 | 210.62 | 0.069 | 0.0096 |
| 6 | 0.000062 | 0.03 | 0.011 | 0.33 | 117.68 | 198.22 | 0.071 | 0.0095 |
| 7 | 0.000064 | 0.03 | 0.011 | 0.33 | 110.55 | 186.32 | 0.073 | 0.0094 |
| 8 | 0.000065 | 0.03 | 0.011 | 0.33 | 103.73 | 174.92 | 0.076 | 0.0092 |
| 9 | 0.000067 | 0.03 | 0.011 | 0.33 | 97.19 | 164.01 | 0.078 | 0.0091 |
| 10 | 0.000069 | 0.03 | 0.011 | 0.32 | 90.94 | 153.57 | 0.081 | 0.0090 |
| 11 | 0.000071 | 0.03 | 0.010 | 0.32 | 84.97 | 143.59 | 0.083 | 0.0089 |
| 12 | 0.000073 | 0.04 | 0.010 | 0.32 | 79.27 | 134.07 | 0.086 | 0.0088 |
| 13 | 0.000075 | 0.04 | 0.010 | 0.32 | 73.83 | 125.00 | 0.089 | 0.0087 |
| 14 | 0.000077 | 0.04 | 0.010 | 0.32 | 68.66 | 116.36 | 0.093 | 0.0086 |
| 15 | 0.000079 | 0.04 | 0.010 | 0.31 | 63.74 | 108.14 | 0.096 | 0,0085 |
| 16 | 0.000082 | 0.04 | 0.010 | 0.31 | 59.07 | 100.34 | 0.100 | 0.0083 |
| 17 | 0.000084 | 0.04 | 0.010 | 0.31 | 54.64 | 92.94 | 0.104 | 0.0082 |
| 18 | 0.000087 | 0.04 | 0.010 | 0.31 | 50.44 | 85.94 | 0.108 | 0.0081 |
| 19 | 0.000090 | 0.04 | 0.010 | 0.30 | 46.47 | 79.31 | 0.112 | 0.0080 |
| 20 | 0.000093 | 0.05 | 0.010 | 0.30 | 42.73 | 73.06 | 0.117 | 0.0078 |
| 21 | 0.000096 | 0.05 | 0.010 | 0.30 | 39.20 | 67.16 | 0.122 | 0.0077 |
| 22 | 0.000099 | 0.05 | 0.010 | 0.29 | 35.88 | 61.62 | 0.127 | 0.0076 |
| 23 | 0.000103 | 0.05 | 0.009 | 0.29 | 32.76 | 56.41 | 0.133 | 0.0074 |
| 24 | 0.000107 | 0.05 | 0.009 | 0.29 | 29.84 | 51.53 | 0.139 | 0.0073 |
| 25 | 0.000111 | 0.05 | 0.009 | 0.28 | 27.11 | 46.97 | 0.146 | 0.0071 |
| 26 | 0.000115 | 0.06 | 0.009 | 0.28 | 24.56 | 42.71 | 0.153 | 0.0070 |
| 27 | 0.000119 | 0.06 | 0.009 | 0.28 | 22.18 | 38.75 | 0.161 | 0.0068 |
| 28 | 0.000124 | 0.06 | 0.009 | 0.27 | 19.98 | 35.07 | 0.169 | 0.0067 |
| 29 | 0.000129 | 0.06 | 0.009 | 0.27 | 17.94 | 31.65 | 0.178 | 0.0065 |
| 30 | 0.000134 | 0.07 | 0.009 | 0.27 | 16.05 | 28.50 | 0.187 | 0.0064 |
| 31 | 0.000140 | 0.07 | 0.008 | 0.26 | 14.31 | 25.60 | 0.198 | 0.0062 |
| 32 | 0.000146 | 0.07 | 0.008 | 0.26 | 12.72 | 22.93 | 0.209 | 0.0061 |
| 33 | 0.000153 | 0.08 | 0.008 | 0.25 | 11.25 | 20.49 | 0.221 | 0.0059 |
| 34 | 0.000160 | 0.08 | 0.008 | 0.25 | 9.92 | 18.27 | 0.234 | 0.0058 |
| 35 | 0.000167 | 0.08 | 0.008 | 0.24 | 8.71 | 16.24 | 0.248 | 0.0056 |
| 36 | 0.000175 | 0.09 | 0.008 | 0.24 | 7.61 | 14.41 | 0.263 | 0.0055 |
| 37 | 0.000183 | 0.09 | 0.008 | 0.23 | 6.62 | 12.76 | 0.280 | 0.0053 |
| 38 | 0.000192 | 0.09 | 0.007 | 0.23 | 5.73 | 11.28 | 0.298 | 0.0052 |
| 39 | 0.000202 | 0.10 | 0.007 | 0.22 | 4.94 | 9.95 | 0.317 | 0.0050 |
| 40 | 0.000212 | 0.10 | 0.007 | 0.21 | 4.23 | 8.77 | 0.338 | 0.0049 |
| 41 | 0.000222 | 0.11 | 0.007 | 0.21 | 3.61 | 7.73 | 0.360 | 0.0047 |
| 42 | 0.000234 | 0.12 | 0.007 | 0.20 | 3.06 | 6.81 | 0.383 | 0.0046 |
| 43 | 0.000245 | 0.12 | 0.006 | 0.19 | 2.58 | 6.00 | 0.408 | 0.0045 |
| 44 | 0.000258 | 0.13 | 0.006 | 0.19 | 2.16 | 5.30 | 0.434 | 0.0044 |
| 45 | 0.000271 | 0.13 | 0.006 | 0.18 | 1.79 | 4.69 | 0.462 | 0.0043 |
| 46 | 0.000284 | 0.14 | 0.006 | 0.17 | 1.48 | 4.17 | 0.490 | 0.0042 |
| 47 | 0.000298 | 0.15 | 0.005 | 0.16 | 1.21 | 3.73 | 0.518 | 0.0041 |
| 48 | 0.000311 | 0.15 | 0.005 | 0.15 | 0.99 | 3.35 | 0.547 | 0.0040 |
| 49 | 0.000325 | 0.16 | 0.005 | 0.14 | 0.79 | 3.02 | 0.575 | 0.0040 |
| 50 | 0.000339 | 0.17 | 0.004 | 0.13 | 0.63 | 2.75 | 0.603 | 0.0039 |
| 51 | 0.000352 | 0.17 | 0.004 | 0.12 | 0.50 | 2.53 | 0.629 | 0.0039 |
| 52 | 0.000365 | 0.18 | 0.004 | 0.11 | 0.38 | 2.34 | 0.654 | 0.0039 |
| 53 | 0.000377 | 0.19 | 0.003 | 0.10 | 0.29 | 2.19 | 0.676 | 0.0039 |
| 54 | 0.000388 | 0.19 | 0.003 | 0.09 | 0.21 | 2.06 | 0.697 | 0.0038 |
| 55 | 0.000398 | 0.20 | 0.002 | 0.08 | 0.15 | 1.95 | 0.715 | 0.0038 |
| 56 | 0.000407 | 0.20 | 0.002 | 0.06 | 0.10 | 1.87 | 0.731 | 0.0038 |
| 57 | 0.000414 | 0.20 | 0.002 | 0.05 | 0.06 | 1.81 | 0.744 | 0.0038 |
| 58 | 0.000419 | 0.21 | 0.001 | 0.04 | 0.04 | 1.76 | 0.754 | 0.0038 |
| 59 | 0.000423 | 0.21 | 0.001 | 0.03 | 0.02 | 1.73 | 0.761 | 0.0038 |
| 60 | 0.000426 | 0.21 | 0.000 | 0.01 | 0.00 | 1.71 | 0.765 | 0.0038 |
| Total flow | 0.010000 | Total loss | 0.3900 | |||||
| Flow difference (%) | 87.100000 |
Finally, from Table 4, it is concluded that the FAFA reactors in the Santiago township WWTP do not have an adequate design in the distribution system, because the flow difference between the first and last hole is 64.13 % (> 10 %) and the total loss had a value of 0.11 m, varying significantly from 0.0051 m in the first hole to 0.0033 in the last one, which affects both the hydraulics of the process and the adherence of the microorganisms to the support medium contained within the reactor.
Source: Created by the authors.
| Holes | QLi (m3/s) | VLi (m/s) | Qci (m3/s) | Vci (m/s) | (Vci/VLi)2 | βi | 1/√βi | ∆ho (m) |
| 1 | 0.000035 | 0.07 | 0.002 | 0.23 | 11.25 | 20.49 | 0.22 | 0.0051 |
| 2 | 0.000037 | 0.07 | 0.002 | 0.23 | 9.92 | 18.27 | 0.23 | 0.0050 |
| 3 | 0.000039 | 0.08 | 0.002 | 0.23 | 8.71 | 16.24 | 0.25 | 0.0049 |
| 4 | 0.000041 | 0.08 | 0.002 | 0.22 | 7.61 | 14.41 | 0.26 | 0.0047 |
| 5 | 0.000043 | 0.08 | 0.002 | 0.22 | 6.62 | 12.76 | 0.28 | 0.0046 |
| 6 | 0.000045 | 0.09 | 0.002 | 0.21 | 5.73 | 11.28 | 0.30 | 0.0045 |
| 7 | 0.000047 | 0.09 | 0.002 | 0.21 | 4.94 | 9.95 | 0.32 | 0.0043 |
| 8 | 0.000049 | 0.10 | 0.002 | 0.20 | 4.23 | 8.77 | 0.34 | 0.0042 |
| 9 | 0.000052 | 0.10 | 0.002 | 0.19 | 3.61 | 7.73 | 0.36 | 0.0041 |
| 10 | 0.000054 | 0.11 | 0.002 | 0.19 | 3.06 | 6.81 | 0.38 | 0.0040 |
| 11 | 0.000057 | 0.11 | 0.001 | 0.18 | 2.58 | 6.00 | 0.41 | 0.0039 |
| 12 | 0.000060 | 0.12 | 0.001 | 0.17 | 2.16 | 5.30 | 0.43 | 0.0038 |
| 13 | 0.000063 | 0.12 | 0.001 | 0.17 | 1.79 | 4.69 | 0.46 | 0.0037 |
| 14 | 0.000066 | 0.13 | 0.001 | 0.16 | 1.48 | 4.17 | 0.49 | 0.0036 |
| 15 | 0.000069 | 0.14 | 0.001 | 0.15 | 1.21 | 3.73 | 0.52 | 0.0035 |
| 16 | 0.000072 | 0.14 | 0.001 | 0.14 | 0.99 | 3.35 | 0.55 | 0.0035 |
| 17 | 0.000076 | 0.15 | 0.001 | 0.13 | 0.79 | 3.02 | 0.58 | 0.0034 |
| 18 | 0.000079 | 0.16 | 0.001 | 0.12 | 0.63 | 2.75 | 0.60 | 0.0034 |
| 19 | 0.000082 | 0.16 | 0.001 | 0.11 | 0.50 | 2.53 | 0.63 | 0.0034 |
| 20 | 0.000085 | 0.17 | 0.001 | 0.10 | 0.38 | 2.34 | 0.65 | 0.0033 |
| 21 | 0.000088 | 0.17 | 0.001 | 0.09 | 0.29 | 2.19 | 0.68 | 0.0033 |
| 22 | 0.000090 | 0.18 | 0.001 | 0.08 | 0.21 | 2.06 | 0.70 | 0.0033 |
| 23 | 0.000092 | 0.18 | 0.001 | 0.07 | 0.15 | 1.95 | 0.72 | 0.0033 |
| 24 | 0.000094 | 0.19 | 0.000 | 0.06 | 0.10 | 1.87 | 0.73 | 0.0033 |
| 25 | 0.000096 | 0.19 | 0.000 | 0.05 | 0.06 | 1.81 | 0.74 | 0.0033 |
| 26 | 0.000097 | 0.19 | 0.000 | 0.04 | 0.04 | 1.76 | 0.75 | 0.0033 |
| 27 | 0.000098 | 0.19 | 0.000 | 0.02 | 0.02 | 1.73 | 0.76 | 0.0033 |
| 28 | 0.000099 | 0.20 | 0.000 | 0.01 | 0.00 | 1.71 | 0.77 | 0.0033 |
| Total flow | 0.002000 | Total loss | 0.1100 | |||||
| Flow difference (%) | 64.130000 |
3.2 Pre-dimensioning with the proposed methodology
As it was demonstrated in the previous calculations, the design of the distribution system for the three WWTPs is not adequate since they do not fulfill their main function of uniformly distributing the influent flow to the treatment units. For this reason, a pre-dimensioning of these pipes was proposed using the Hudson [
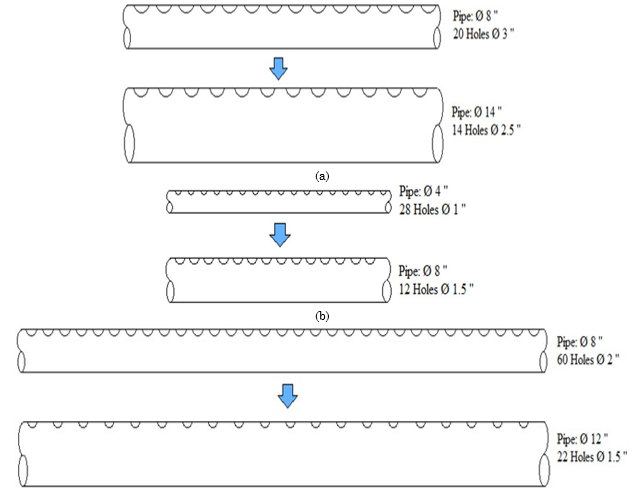
Table 5 shows the pre-dimensioning of the distribution system in the treatment units of each municipality. In the case of San Carlos municipality, for high-rate settlers, an increase was made in the diameter of the pipeline, going from 8" in the existing design to 14" in the pre-dimensioning and a hole diameter of 2.5". In the case of UASB reactors in San Roque municipality, pre-dimensioning was proposed with an increase in pipe diameter from 8" in the existing design to 12" in pre-dimensioning and a decrease in the diameter of the holes to 1.5". Finally, the pre-dimensioning of the distribution system was carried out in Santiago township WWTP, with an increase in the diameter of the existing pipe from 4" to 8" and the diameter of the hole to 1.5".
Source: Created by the authors.
| Parameter | High-rate primary settlers1 | UASB reactors2 | FAFA reactors3 |
| Total flow (m3/s) | 0.01 | 0.01 | 0.0019 |
| Number of holes (#) | 14.00 | 22.00 | 12.00 |
| Hole diameter (inch) | 2.50 | 1.50 | 1.50 |
| Pipe diameter (inch) | 14.00 | 12.00 | 8.00 |
| θ (dimensionless) | 0.70 | 0.70 | 0.70 |
| φ (dimensionless) | 1.67 | 1.67 | 1.67 |
1 San Carlos municipality; 2 San Roque municipality; 3 Santiago township.
θ: Coefficient of head loss at the input, φ: Coefficient of head loss
in the change of direction of the current.
The difference in flow rates between the first and last holes with the new design for the high-rate settlers in San Carlos municipality was 9.38 % (Table 6), this being less than 10 %, thus ensuring uniform distribution of the flow in the settler. Additionally, the losses between the holes are equal with values of 0.0047 m in each one, likewise, it is possible to reduce the total pressure loss in the treatment unit since it goes from having a value of 0.11 m in the current design to 0.07 m in the pre-dimensioning carried out, which improves the hydraulic behavior of the settler, reducing the energy required for its operation. It was also found that the speeds in the holes (VLi) are very close to 0.2 m/s, which can improve the efficiency of the treatment since, in the existing design, there are very small speeds of up to 0.04 m/s, a situation that can cause sedimentation of particles and possible obstruction of the holes. In this case, the main problem in high rate settling tanks for wastewater is obstructions in the internal pipes and channels. The design of these includes the homogeneous distribution of the flow-through each plate and the effective removal of solids without re-suspension [
Source: Created by the authors.
| Holes | QLi (m3/s) | VLi (m/s) | Qci (m3/s) | Vci (m/s) | (Vci/VLi)2 | βi | 1/√βi | ∆ho (m) |
| 1 | 0.0007 | 0.21 | 0.010 | 0.10 | 0.23 | 2.08 | 0.69 | 0.0047 |
| 2 | 0.0007 | 0.21 | 0.009 | 0.09 | 0.19 | 2.02 | 0.70 | 0.0047 |
| 3 | 0.0007 | 0.22 | 0.009 | 0.09 | 0.16 | 1.97 | 0.71 | 0.0047 |
| 4 | 0.0007 | 0.22 | 0.008 | 0.08 | 0.13 | 1.92 | 0.72 | 0.0047 |
| 5 | 0.0007 | 0.22 | 0.007 | 0.07 | 0.11 | 1.88 | 0.73 | 0.0047 |
| 6 | 0.0007 | 0.22 | 0.007 | 0.07 | 0.09 | 1.84 | 0.74 | 0.0047 |
| 7 | 0.0007 | 0.23 | 0.006 | 0.06 | 0.07 | 1.81 | 0.74 | 0.0047 |
| 8 | 0.0007 | 0.23 | 0.005 | 0.05 | 0.05 | 1.79 | 0.75 | 0.0047 |
| 9 | 0.0007 | 0.23 | 0.004 | 0.04 | 0.04 | 1.76 | 0.75 | 0.0047 |
| 10 | 0.0007 | 0.23 | 0.004 | 0.04 | 0.03 | 1.74 | 0.76 | 0.0047 |
| 11 | 0.0007 | 0.23 | 0.003 | 0.03 | 0.02 | 1.73 | 0.76 | 0.0047 |
| 12 | 0.0007 | 0.23 | 0.002 | 0.02 | 0.01 | 1.72 | 0.76 | 0.0047 |
| 13 | 0.0007 | 0.23 | 0.001 | 0.01 | 0.00 | 1.71 | 0.77 | 0.0047 |
| 14 | 0.0007 | 0.23 | 0.001 | 0.01 | 0.00 | 1.70 | 0.77 | 0.0047 |
| Total flow | 0.0100 | Total loss | 0.0700 | |||||
| Flow difference (%) | 9.3800 |
In Table 7, for the UASB reactors in the San Roque municipality, it is evident that the flow difference is less than 10 %, yielding a value of 5.69 %, thus guaranteeing the uniform distribution of flow to have adequate performance in the reactor. All hole’s velocity (VLi) showed a value greater than 0.4 m/s and the pipeline velocities (Vci) were less than 0.2 m/s, thus ensuring the phenomenon of mixing in the reactor and avoiding air bubbles in this. Likewise, homogeneous head losses are obtained for each of the holes with a value of 0.0175 m, which also helps the proper operation of the treatment system. In this case, the total head loss in the UASB reactor remained at the value of 0.39 m, it was not possible to decrease as in the previous case due to the significant increase in the holes velocity, however, total losses were balanced with increasing the pipe diameter, thus obtaining a value similar to the current design.
Source: Created by the authors.
| Holes | QLi (m3/s) | VLi (m/s) | Qci (m3/s) | Vci (m/s) | (Vci/VLi)2 | βi | 1/√βi | ∆ho (m) |
| 1 | 0.00048 | 0.42 | 0.011 | 0.15 | 0.13 | 1.91 | 0.72 | 0.0175 |
| 2 | 0.00049 | 0.43 | 0.011 | 0.14 | 0.12 | 1.89 | 0.73 | 0.0175 |
| 3 | 0.00049 | 0.43 | 0.010 | 0.14 | 0.10 | 1.87 | 0.73 | 0.0175 |
| 4 | 0.00049 | 0.43 | 0.010 | 0.13 | 0.09 | 1.86 | 0.73 | 0.0175 |
| 5 | 0.00049 | 0.43 | 0.009 | 0.12 | 0.08 | 1.84 | 0.74 | 0.0175 |
| 6 | 0.00050 | 0.43 | 0.009 | 0.12 | 0.07 | 1.82 | 0.74 | 0.0175 |
| 7 | 0.00050 | 0.44 | 0.008 | 0.11 | 0.07 | 1.81 | 0.74 | 0.0175 |
| 8 | 0.00050 | 0.44 | 0.008 | 0.10 | 0.06 | 1.79 | 0.75 | 0.0175 |
| 9 | 0.00050 | 0.44 | 0.007 | 0.10 | 0.05 | 1.78 | 0.75 | 0.0175 |
| 10 | 0.00050 | 0.44 | 0.007 | 0.09 | 0.04 | 1.77 | 0.75 | 0.0175 |
| 11 | 0.00050 | 0.44 | 0.006 | 0.08 | 0.04 | 1.76 | 0.75 | 0.0175 |
| 12 | 0.00051 | 0.44 | 0.006 | 0.08 | 0.03 | 1.75 | 0.76 | 0.0175 |
| 13 | 0.00051 | 0.44 | 0.005 | 0.07 | 0.02 | 1.74 | 0.76 | 0.0175 |
| 14 | 0.00051 | 0.45 | 0.005 | 0.06 | 0.02 | 1.73 | 0.76 | 0.0175 |
| 15 | 0.00051 | 0.45 | 0.004 | 0.06 | 0.02 | 1.73 | 0.76 | 0.0175 |
| 16 | 0.00051 | 0.45 | 0.004 | 0.05 | 0.01 | 1.72 | 0.76 | 0.0175 |
| 17 | 0.00051 | 0.45 | 0.003 | 0.04 | 0.01 | 1.71 | 0.76 | 0.0175 |
| 18 | 0.00051 | 0.45 | 0.003 | 0.04 | 0.01 | 1.71 | 0.76 | 0.0175 |
| 19 | 0.00051 | 0.45 | 0.002 | 0.03 | 0.00 | 1.71 | 0.77 | 0.0175 |
| 20 | 0.00051 | 0.45 | 0.002 | 0.02 | 0.00 | 1.70 | 0.77 | 0.0175 |
| 21 | 0.00051 | 0.45 | 0.001 | 0.01 | 0.00 | 1.70 | 0.77 | 0.0175 |
| 22 | 0.00051 | 0.45 | 0.001 | 0.01 | 0.00 | 1.70 | 0.77 | 0.0175 |
| Total flow | 0.01100 | Total loss | 0.3900 | |||||
| Flow difference (%) | 5.69000 |
To obtain good performance from UASB reactors, the influent substrate must be evenly distributed across the bottom of the reactors, to ensure adequate close contact between biomass and substrate, improve mixing regime and avoid the presence of dead zones inside the reactor. In this case, the distribution pipeline velocity must be high enough to avoid that the solids present in the tributary frequently obstruct the pipes and, also, allow a speed of less than 0.2 m/s so that the air bubbles occasionally dragged into the tube they may return upwards (in the opposite direction to the wastewater). On the other hand, holes velocity must be greater than 0.4 m/s to favor good mixing, greater contact with the mud bed, and to avoid the deposition of inert solids near the point of discharge of the tube [
Finally, in the pre-dimensioning of the FAFA reactors in Santiago township WWTP (Table 8), it was decided to increase both the pipe diameter and that of the hole, this due to the problem of the WWTP regarding the overflow of the reactors, which is caused by the plugging with residues of the pipes and holes, increasing the diameter could solve this problem. The flow difference was 8.39 % (less than 10 %), which guarantees the uniform distribution of the flow, contributing to the efficiency of the treatment. Besides, equal head losses were obtained in the holes with a value of 0.0018 m for each one, and the total head loss in the FAFA was reduced from a value of 0.11 m in the current design to 0.0215 m in the pre- sizing done. On the other hand, the hole speeds (VLi) are higher than in the current design, this could also help the overflow problem. However, for the design, it was taken into account that these speeds should not be as great as in UASB reactors (> 4 m/s) because low up-flow rates are needed so that the solids do not leave the effluent and on the contrary, they remain in the filter bed or rosettes, therefore it was decided not to significantly increase this parameter. A very important aspect of the design of anaerobic up-flow filters (FAFA) is the detail of the wastewater inlet and outlet devices since the efficiency of the treatment system depends substantially on the good distribution of the flow in the filter bed and this distribution is subject to the correct calculation of the input and output devices. The up-flow rate must be kept below the limit above which the solids are significantly lost in the effluent. In large scale reactors, the up-flow rate is usually around 2 m/h [
Source: Created by the authors.
| Holes | QLi (m3/s) | VLi (m/s) | Qci (m3/s) | Vci (m/s) | (Vci/VLi)2 | βi | 1/√βi | ∆ho (m) |
| 1 | 0.00015 | 0.13 | 0.0019 | 0.06 | 0.20 | 2.03 | 0.70 | 0.0018 |
| 2 | 0.00015 | 0.13 | 0.0018 | 0.05 | 0.16 | 1.97 | 0.71 | 0.0018 |
| 3 | 0.00015 | 0.14 | 0.0016 | 0.05 | 0.13 | 1.92 | 0.72 | 0.0018 |
| 4 | 0.00016 | 0.14 | 0.0014 | 0.04 | 0.11 | 1.88 | 0.73 | 0.0018 |
| 5 | 0.00016 | 0.14 | 0.0013 | 0.04 | 0.08 | 1.84 | 0.74 | 0.0018 |
| 6 | 0.00016 | 0.14 | 0.0011 | 0.03 | 0.06 | 1.80 | 0.74 | 0.0018 |
| 7 | 0.00016 | 0.14 | 0.0010 | 0.03 | 0.05 | 1.78 | 0.75 | 0.0018 |
| 8 | 0.00016 | 0.14 | 0.0008 | 0.03 | 0.03 | 1.75 | 0.76 | 0.0018 |
| 9 | 0.00016 | 0.14 | 0.0007 | 0.02 | 0.02 | 1.73 | 0.76 | 0.0018 |
| 10 | 0.00016 | 0.14 | 0.0005 | 0.02 | 0.01 | 1.72 | 0.76 | 0.0018 |
| 11 | 0.00016 | 0.14 | 0.0003 | 0.01 | 0.00 | 1.71 | 0.77 | 0.0018 |
| 12 | 0.00016 | 0.14 | 0.0002 | 0.01 | 0.00 | 1.70 | 0.77 | 0.0018 |
| Total flow | 0.00190 | Total loss | 0.0215 | |||||
| Difference flow (%) | 8.39000 |
3.3 Results comparison
Figure 6 shows the parameters considered to guarantee an efficient design of the inlet structures of the treatment systems. The percentage of difference in flows between the first and the last well decreased considerably with the new design in the 3 locations compared to the current design (Figure 6a), with percentages lower than the 10 % recommended to distribute the flow evenly. It has been shown that the overall efficiency of decanters depends on the hydraulic structures, especially the design and location of the inlet and outlet [
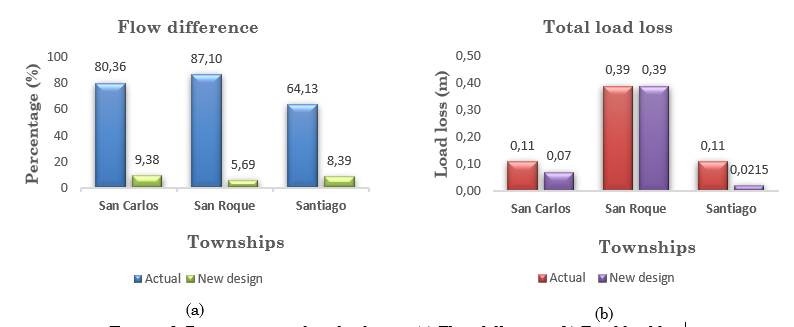
In [
On the other hand, the total head loss decreased or remained constant for the 3 locations with the new design (Figure 6b). Studies suggest that the inlet design of treatment systems should focus on decreasing the total head loss and head velocity of the wastewater, avoiding short circuits, alleviating the effects of density currents, and minimizing general disturbances [
The comparison of the existing and pre-dimensioned pipe designs is shown in Figure 7, wherein the case of San Carlos WWTP settlers, the diameter went from 8" to 14" and from 20 holes from 3" to 14 holes 2.5" (Figure 7a). For Santiago WWTP (Figure 7b), the diameter of the pipeline went from 4" with 28 holes from 1" to 8" with 12 holes of 1.5" and finally for San Roque municipality, the design changed from 8-pipe" with 60 holes from 2" to 12" with 22 holes of 1.5" (Figure 7c).
4. CONCLUSIONS
In this study it was verified that the existing design of the distribution system in the three WWTPs is not optimal since it does not meet the main objective of uniformly distributing the flow, thus defining the importance of having a good design in the supply pipes treatment units because they can affect the system operation, especially in the wastewater treatment systems of our country, where this type of pipes are commonly found at the entrance, which are installed without prior design, ignoring the hydraulic conditions of each WWTP and affecting the efficient removal of contaminants, which becomes an environmental problem for receiving water bodies. The pre-dimensioning carried out in addition to ensuring the homogeneous distribution of the flow, provided speeds that positively contribute to the treatment process, since when carrying out this new design it was evident that by reducing the number of holes and increasing the pipe diameter, a better distribution of the flow, in addition, the hole diameter is the predominant parameter to control the speed at the entrance of the treatment unit (holes velocity), which allows maintaining a speed such that no debris is deposited that can plug holes and thus avoid poor distribution of wastewater. The total head loss in the treatment units varied with the speed head in the hole and the coefficient of head loss, therefore, in case of requiring higher speeds in the holes, the diameters of the holes should be decreased. In this way, the losses will increase, however, this can be balanced with the increase in the diameter of the pipe, which would cause a decrease in the coefficient of total head loss (βi), therefore in some cases, it will be possible to reduce losses, which would improve the hydraulic behavior of the treatment unit (San Carlos and Santiago) and in others, it will remain the same (San Roque) or could even increase.
5. ACKNOWLEDGMENTS AND FUNDING
This work was carried out within the framework of the agreement 329-2019 Cornare University of Antioquia. The authors express their gratitude to the people involved in this work, especially to the Environmental Management and Modeling Research Group (GAIA) of the University of Antioquia for supporting the development of this work.
CONFLICTS OF INTEREST
The authors declare that there is no conflict of interest.
AUTHOR CONTRIBUTIONS
Astrid L. Macias contributed to the writing and editing of the document and to the collection and analysis of the information.
Diana C. Rodríguez and Francisco J. Molina contributed to the review of the document and analysis of the information. These authors also contributed to propose the orientation of the theme and the methodological design of the work.
6. REFERENCES
- arrow_upward [1] J. Tang, C. Zhang, X. Shi, J. Sun, and J. A. Cunningham, “Municipal wastewater treatment plants coupled with electrochemical, biological and bio-electrochemical technologies: Opportunities and challenge toward energy self-sufficiency,” J Environ Manage, vol. 234, pp. 396–403, Mar. 2019, https://doi.org/10.1016/j.jenvman.2018.12.097
- arrow_upward [2] H. Awad, M. Gar Alalm, and H. Kh. El-Etriby, “Environmental and cost life cycle assessment of different alternatives for improvement of wastewater treatment plants in developing countries,” Science of The Total Environment, vol. 660, pp. 57–68, Apr. 2019, https://doi.org/10.1016/j.scitotenv.2018.12.386
- arrow_upward [3] F. Molina and R. Mejía, “Presente y futuro del tratamiento de aguas residuales municipales en el departamento de Antioquia: una mirada inicial,” Ingeniería y Sociedad, no. 5, pp. 34–38, Dec. 2012, [Online]. Available: https://revistas.udea.edu.co/index.php/ingeso/article/view/13985
- arrow_upward [4] M. Esmaeili Varaki, J. Farhoudi, and D. Walker, “Study of flow structure and sediment entry to a lateral intake,” Proceedings of the Institution of Civil Engineers - Water Management, vol. 164, no. 7, pp. 347–360, Jul. 2011, https://doi.org/10.1680/wama.2011.164.7.347
- arrow_upward [5] J. A. Valencia, Teoría y práctica de la purificación del agua, 3rd ed., vol. 1. Bogotá D.C, Colombia: McGraw-Hill Interamericana, 2000. [Online]. Available: https://books.google.com.co/books?id=xljBOwAACAAJ
- arrow_upward [6] L. Sun and N. Chang, “Integrated-signal-based leak location method for liquid pipelines,” J Loss Prev Process Ind, vol. 32, pp. 311–318, Nov. 2014, https://doi.org/10.1016/j.jlp.2014.10.001
- arrow_upward [7] J. A. Pérez Parra, Manual de Tratamiento de Agua, 1st ed. Universidad Nacional de Colombia, 1981. [Online]. Available: https://repositorio.unal.edu.co/handle/unal/2056
- arrow_upward [8] G. Tchobanoglous, F. L. Burton, H. D. Stensel, Inc. Metcalf & Eddy, and F. Burton, Wastewater Engineering: Treatment and Reuse, 1 st. New York, USA: McGraw-Hill Education, 2003. [Online]. Available: https://books.google.com.co/books?id=-eoeAQAAIAAJ
- arrow_upward [9] A. C. van Haandel and G. Lettinga, Tratamento anaeróbio de esgotos: um manual para regiões de clima quente, EpGraf, Campina Grande-PB, Brasil, vol. 4, 1994
- arrow_upward [10] R. L. Droste and R. L. Gehr, Theory and Practice of Water and Wastewater Treatment, John Wiley & Sons. New York, USA: Wiley, 2018. [Online]. Available: https://books.google.com.co/books?id=gmV-DwAAQBAJ
- arrow_upward [11] J. A. Cabrera and F. J. F.J. Otaya, “Determinación y evaluación de la distribución de flujo y su eficiencia, en la estructura de entrada sumergida para el conducto principal y laterales de sección constante y variable, en un tanque decantador de placas inclinadas,” Universidad de Nariño, Pasto, 2014. Accessed: Apr. 11, 2022. [Online]. Available: http://sired.udenar.edu.co/id/eprint/1677
- arrow_upward [12] S. D. Graber, “Manifold Flow in Pressure-Distribution Systems,” J Pipeline Syst Eng Pract, vol. 1, no. 3, pp. 120–126, Aug. 2010, https://doi.org/10.1061/(ASCE)PS.1949-1204.0000059
- arrow_upward [13] M. Rahmani Firozjaei, S. A. A. Salehi Neyshabouri, S. Amini Sola, and S. H. Mohajeri, “Numerical Simulation on the Performance Improvement of a Lateral Intake Using Submerged Vanes,” Iranian Journal of Science and Technology, Transactions of Civil Engineering, vol. 43, no. 2, pp. 167–177, Jun. 2019, https://doi.org/10.1007/s40996-018-0126-z
- arrow_upward [14] H. E. Hudson, “Water clarification processes: Practical Design and Evaluation,” First Edition, Van Nostrand Reinhold Co, 1981.
- arrow_upward [15] H. Haddad, E. Ahmad, and K. Azizi, “Numerical simulation of the inlet sedimentation rate to lateral intakes and comparison with experimental results,” Journal of Research in Ecology, vol. 5, no. 1, pp. 464–472, Feb. 2017, [Online]. Available: https://www.academia.edu/33966292/Numerical_simulation_of_the_inlet_sedimentation_rate_to_lateral_intakes_and_comparison_with_experimental_results
- arrow_upward [16] Centro Panamericano de Ingeniería Sanitaria y Ciencias del Ambiente (CEPIS), Tratamiento de agua para consumo humano: Plantas de filtración rápida. Lima, Perú, 2004
- arrow_upward [17] Alcaldía Municipal San Carlos Antioquia, “Plan de desarrollo del municipio de San Carlos (2016-2019),” San Carlos, Antioquia, 2016. [Online]. Available: https://www.sancarlos-antioquia.gov.co/Transparencia/PLANDEDESARROLLOSANCARLOSSOMOSTODOS/SitePages/Inicio.aspx
- arrow_upward [18] F. A. Úsuga, A. F. Patiño, D. C. Rodríguez, and G. A. Peñuela, “Kinetic study and removal of contaminants in the leachate treatment using subsurface wetlands at pilot scale,” Revista ION, vol. 30, no. 2, pp. 55–63, May 2017, https://doi.org/10.18273/revion.v30n2-2017005
- arrow_upward [19] S. R. Qasim, Wastewater Treatment and Reuse, Theory and Design Examples, Volume 1: Principles and Basic Treatment. CRC Press, 2017. https://doi.org/10.1201/b22368
- arrow_upward [20] J. Arboleda Valencia, Teoría, diseño y control de los procesos de clarificación del agua. Lima, Perú: McGraw-Hill Interamericana, 1972
- arrow_upward [21] M. von Sperling and C. de Lemos Chernicharo, Biological Wastewater Treatment in Warm Climate Regions Volume I, Londres: IWA Publishing, 2005. [Online]. Available: https://es.b-ok.lat/book/3600509/1bbab6
- arrow_upward [22] K. Hirom and T. T. Devi, “Application of Computational Fluid Dynamics in Sedimentation Tank Design and Its Recent Developments: a Review,” Water Air Soil Pollut, vol. 233, no. 1, p. 22, Jan. 2022, https://doi.org/10.1007/s11270-021-05458-9
- arrow_upward [23] C. Reyes, F. Apaz, Y. Niño, B. Barraza, C. Arratia, and C. F. Ihle, “A review on steeply inclined settlers for water clarification,” Miner Eng, vol. 184, p. 107639, Jun. 2022, https://doi.org/10.1016/j.mineng.2022.107639
- arrow_upward [24] F. Bouisfi, A. Bouisfi, H. Ouarriche, M. el Bouhali, and M. Chaoui, “The effect of inlet and outlet position and sediments concentration on sedimentation tank efficiency,” in 2018 4th International Conference on Optimization and Applications (ICOA), Apr. 2018, pp. 1–4. https://doi.org/10.1109/ICOA.2018.8370535
- arrow_upward [25] C. He, J. Wood, J. Marsalek, and Q. Rochfort, “Using CFD Modeling to Improve the Inlet Hydraulics and Performance of a Storm-Water Clarifier,” Journal of Environmental Engineering, vol. 134, no. 9, pp. 722–730, Sep. 2008, https://doi.org/10.1061/(ASCE)0733-9372(2008)134:9(722)
- arrow_upward [26] P. Rodríguez López, A. Gutiérrez Lavín, M. M. Mahamud López, and J. L. Bueno de las Heras, “Flow models for rectangular sedimentation tanks,” Chemical Engineering and Processing: Process Intensification, vol. 47, no. 9–10, pp. 1705–1716, Sep. 2008, https://doi.org/10.1016/j.cep.2007.09.020
- arrow_upward [27] A. G. Griborio, J. A. Rodríguez, L. Enriquez, and J. A. McCorquodale, “Use of three-dimensional computational fluid dynamics model for a new configuration of circular primary settling tank,” Water Science and Technology, vol. 84, no. 2, pp. 333–348, Jul. 2021, https://doi.org/10.2166/wst.2021.110