Human Activities Recognition using Semi-Supervised SVM and Hidden Markov Models
Reconocimiento de actividades humanas mediante SVM semisupervisado y modelos ocultos de Markov
 PDF
PDF
Received: July 30, 2022
Accepted: December 12, 2022
Available: December 22, 2022
S. Morales-García; C. Henao-Baena; A. Calvo-Salcedo, “Human Activities Recognition using Semi-Supervised SVM and Hidden Markov Models,” TecnoLógicas, vol. 26, nro. 56, e2474, 2023. https://doi.org/10.22430/22565337.2474
Highlights
Abstract
Automatic human activity recognition is an area of interest for developing health, security, and sports applications. Currently, it is necessary to develop methods that facilitate the training process and reduce the costs of this process. This paper explores a methodology to classify human physical activities in a semi-supervised paradigm. With this approach, it is possible to reduce the number of labels necessary to train the learning model and the complexity of this process. This process begins by deducting the number of micro-movements or sub-movements where the data should be grouped and assigning the label through a clustering technique. We perform this procedure for a specific group of micro-movements whose label is unknown. Later, the classification process starts by using two methods, a Support Vector Machine (SVM) that identifies the micro-movements and a Markov Hidden Model that detects the human physical activity as a function of sequences. The results show that with a percentage of 80 % of the known labels, we achieved outcomes like the supervised paradigms found in the literature. This facilitates training these learning models by reducing the number of examples requiring labels and reduces the economic costs, which is one of the significant limitations of machine learning processes.
Keywords: Spectral clustering, semi-supervised learning, motion estimation, data fusion, human activity recognition.
Resumen
El reconocimiento automático de la actividad humana es un área de interés para el desarrollo de aplicaciones en salud, seguridad y deportes. Actualmente, es necesario desarrollar métodos que faciliten el proceso de entrenamiento y reduzcan los costos de este proceso. Este trabajo explora una metodología para clasificar actividades físicas humanas en un paradigma semi-supervisado. Con este enfoque, es posible reducir el número de etiquetas necesarias para entrenar el modelo de aprendizaje y la complejidad de este proceso. Este proceso comienza deduciendo el número de micro-movimientos o submovimientos en los que deben agruparse los datos y asignando la etiqueta mediante una técnica de clustering. Realizamos este procedimiento para un grupo específico de micro-movimientos cuya etiqueta se desconoce. Posteriormente, se inicia el proceso de clasificación utilizando dos métodos, una Máquina de Vectores Soportados (SVM) que identifica los micro-movimientos y un Modelo Oculto de Markov que detecta la actividad física humana en función de secuencias. Los resultados muestran que con un porcentaje del 80 % de las etiquetas conocidas, se consigue resultados como los paradigmas supervisados encontrados en la literatura. Esto facilita el entrenamiento de estos modelos de aprendizaje al reducir el número de ejemplos que requieren etiquetas y reduce los costes económicos, que es una de las limitaciones significativas de los procesos de aprendizaje automático.
Palabras clave: Agrupamiento espectral, aprendizaje semisupervisado, estimación de movimiento, fusión de datos, reconocimiento de actividad humana.
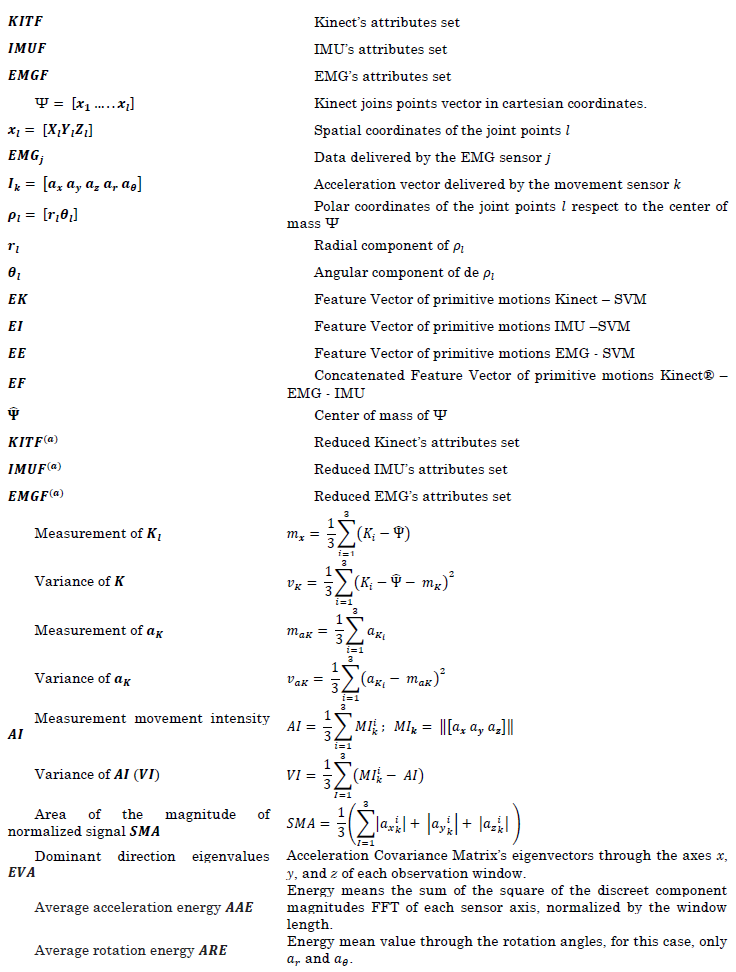
NOMENCLATURE
1. INTRODUCTION
Human physical recognition is a methodology that uses devices and computing algorithms to detect what action a person performs in a certain period. Therefore, rehabilitation, medical diagnostic, and intelligent surveillance systems, among others, have been implemented in sports [
The literature recommends opting for data fusion approaches, which use the information provided by two or more sensors to improve detection performance and increase robustness against partial occlusions and disconnections. Some methods show that combining IMU and EMG sensor (first case) or IMU and Kinect® (second case) improved activity estimation compared to the use of a single type of modality [
Also, K-means suffers from high dimensionality or when the database is too complex and could present partial occlusion problems or lighting changes by only using the Kinect® for activity classification. Other approaches use modern methods of machine learning as deep learning. Among the more common techniques, it has been highlighted the convulsed neural network, learning by reinforcement, etc. These methods have encompassed the identification of human physical activity and have achieved reliable results [
-
- Design, documentation, and validation of a human physical activity classification methodology under a semi-supervised learning paradigm.
- An automatic method that allows inferring the number of sub-activities where the data should be clustered.
- The proposed method suggests that the classifier recognizes 80 % of the labels, and we achieved reliable results according to what is written in the literature.
This work is organized as follows. Firstly, a methodological section describes the detail of each component and the validation process. Secondly, a section presents how the methodology's performance is evaluated and quantified. Lastly, a section describes the conclusion and further discussions of this research.
2. MATERIALS AND METHODS
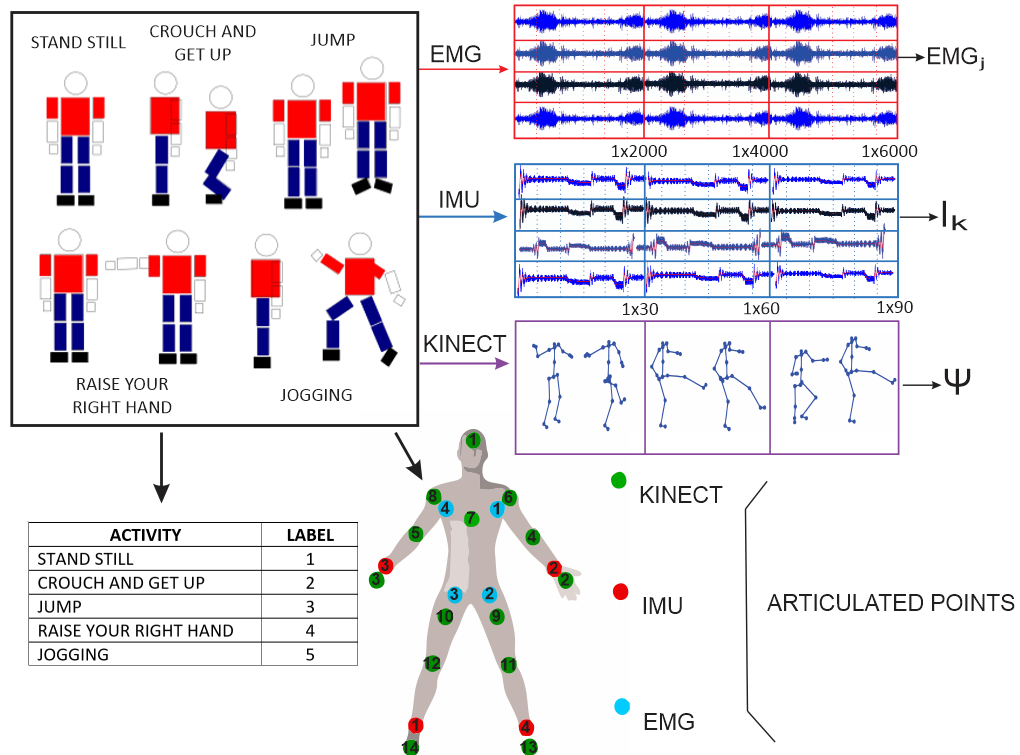
The methodology has three stages: search to extract the information from the sensors, descriptor calculation about the data, and relevant feature analysis of the compiled information. The second stage classifies the activity execution into micro-movements (primitive movements), and the last step codifies sequences for activity detection. Figure 1 shows the methodological process implemented in this work. The methods and instruments that conform to the methodology are described as follows.

2.1 Database
For this work, we used the database supplied by [
2.2 Dimensionality Analysis of the Sensors and Joint Points
In this section, we discuss the method to process the data through the statistic descriptors to parameterize the information given by each articulated point in a feature set that replaces the information recollected by the instruments. It is essential to clarify the new data space is redundant. Therefore, a dimensionality analysis is introduced to establish the minimum feature set, stabilizing the primitive movement classifier’s performance [
2.3 Feature Extraction
For each sensor, the feature set is extracted inside an observation window proposed by [
It was previously highlighted the data is normalized concerning the torso. Additionally, the average m and standard deviation v are calculated on each set of i, which allows for building the descriptor (1).

Where i corresponds to the i-th join point of the Kinect®, therefore, the set of 𝑖 ∈ {1,2 … 𝑖} computes the vector KITF as the link of all the 𝑲𝑰𝑻𝑖. Analogously, for each 𝐼𝑘, the physical parameter of the human movement and the statistic movements provided by [

Thus, for the set of 𝑘 ∈ {1,2 … 𝑘}, the concatenation provides, as a result, the descriptor 𝑰𝑴𝑼𝑘 (3).

For the EMG sensors, the physical activity of four human muscles is captured, delivering the EMGj, where j is the j-th sensor. EMGj is segmented to distinguish every primitive movement. For each primitive motion, we calculate the Wavelet transform, with a Daubechies configuration, with thirty-five orthogonal coefficients and six levels, generating the descriptor EMGF. We chose this descriptor because it is the same as the one used in [
2.4 Dimensionality Reduction Analysis
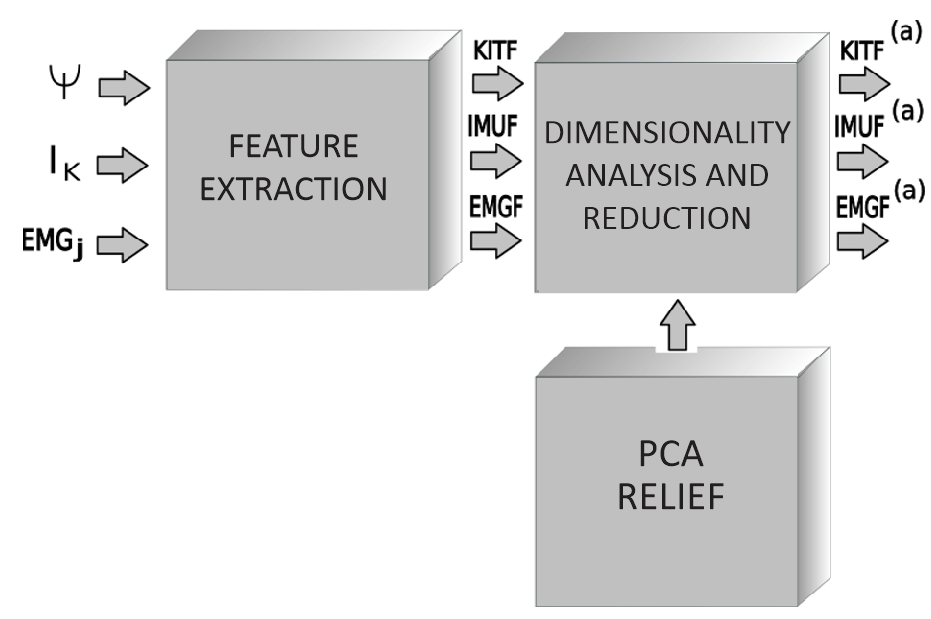
In this stage, the most relevant features are determined to ease the clustering process of primitive motion identification. We use the Principal Component Analysis (PCA) and ReliefF methods to make this possible. The former reduces the feature space size by selecting the attributes with the most critical database information. We find crucial information by determining the direction with the highest variance of the sample space [
These methods are selected by the sturdiness presented in multiclass problems and dealing with data at a substantial noise level. Figure 3 shows a block diagram that explains the dimension reduction process done by the data provided by the database where 𝐾𝐼𝑇𝐹(𝑎), 𝐼𝑀𝑈𝐹(𝑎), 𝐸𝑀𝐺𝐹(𝑎), correspond to the reduced space of features.
2.5 Primitive Motion Detection
Activity recognition can be divided into sub-activities or primitive movements. The goal is to divide each activity in a time window (establishing the primitive motions), generating a sequence that allows building a model for activity recognition. This will enable us to generate a unique code that provides a discriminating factor for the classification of the activity, as shown in Figure 4.
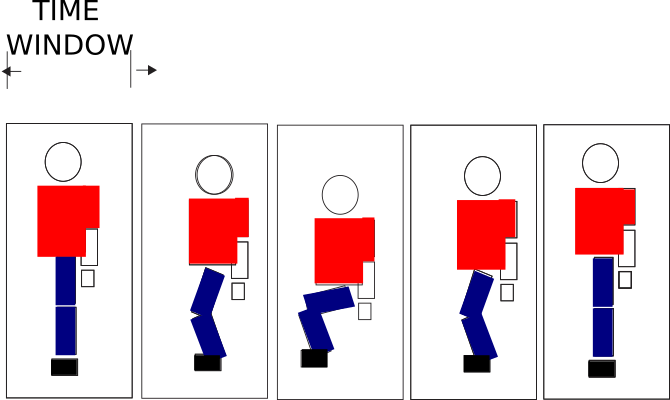
It is important to note that each window does not obey a posture but a submovement. In addition, for sensor modalities where it is impossible to determine the visuality of a body posture, as is the case for IMU and EMG sensors, we assign the label based on the information provided by the Kinect®’s sensor. This is possible because the sensors are synchronized in their capture (See Figure 5). The primitive movements chosen in this work are 1- Repose, 2- Half Crouches, 3- Fully crouching, 4- Suspended in mid-air (1/2), 4-Raise hand (1/4), 5- Raise hand (3/4), 6- Move right leg forward, and 7- Move left leg forward.
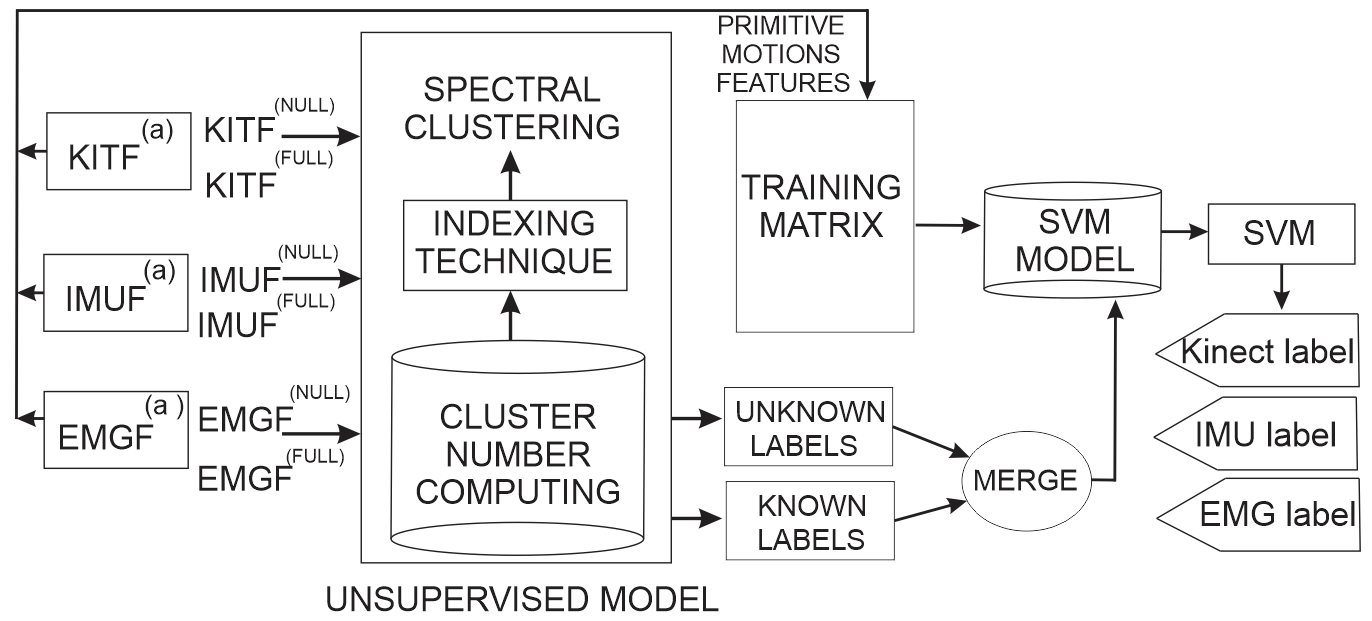
The micro-movement identification is achieved by combining an unsupervised learning technique (Spectral Clustering) with a supervised learning technique (SVM). The fusion of the former is done by estimating the labels of the unknown primitive motions, yet they are needed to train the supervised model. The latter emulates the codification of the activities.
It is important to clarify how the primitive movement classification includes an instrument that allows for correcting the issues in building the database. In this situation, a proportion of the reduced space {KITF(a), IMUF(a), EMGF(a)} does not have any associated label space {KITF(null), IMUF(null), EMGF(null)}, while the remainder are known {KITF(full), IMUF(full), EMGF(full)}, therefore, the features on the simplified plane {KITF(null), IMUF(null), EMGF(null)} are processed by an unsupervised model that searches to infer the unknown labels, so the Spectral Clustering technique is applied [
Thus, the identification of data groups is performed by the similarity of the samples. When the method assigns the distinctive set from {KITF(null), IMUF(null), EMGF(null)}, they combine with other known groups, completing the training data set for the supervised model (SVM).
2.6 Compute of Clusters Number
In other words, the procedure is explained as follows, in the first place, the number of primitive motions (∁) is determined, the physical activities should be divided, and the previous process is done by spectral clustering (see Figure 5).
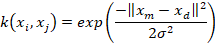
This process is performed by the data set of the joint points. The goal is to build a similar graphic based on the Ng-Jordan-Weiss algorithm for spectral clustering. The algorithm uses a Gaussian kernel given by (4) as a scale factor σ2 to calculate an affinity matrix A ∈ Rn×n where Aij = k(xi, xj) with i ≠ j which Aii = 0. Then, from 𝐴 the affinity matrix 𝐿 is built, i.e., a place where the inputs are normalized, the data is similar to each other if they are at a maximum distance of [−1 1], i.e., the process establishes how similar xm is concerning xd evaluating k(xm, xd), so if it is close to 1, the data is clustered to its assigned ∁ ; otherwise, set us a zero. Measurements 1 and -1 are dimensionless and therefore have no units.
Finally, these values are normalized by computing the matrix Ψ, and then, the matrix is represented in a graphic. Therefore, the number of primitive motions suggested for the data is visualized. Calculating σ2 is inferred, as shown in [
2.7 Activity Recognition
For activity recognition, shown in Figure 2, we put a data fusion module that centralizes the information supplied by primitive motion detection. A Hidden Markov Model (HMM) is applied as an activity classifier. This methodological instrument is shown in Figure 6.
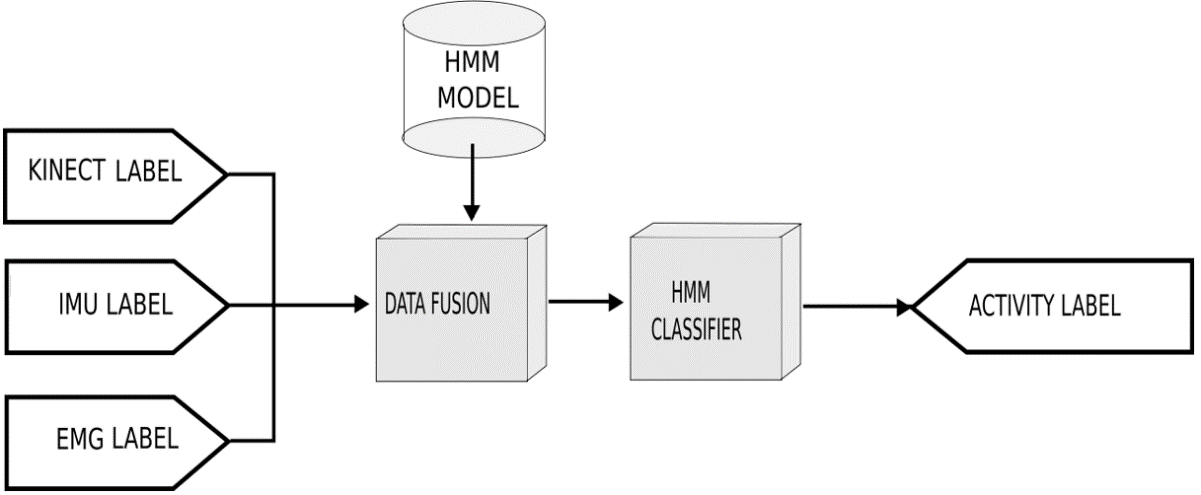
2.7.1 Data Fusion
In this stage, the labels that model the activity for each sensor modality are fused. It is important to note the information measured by the sensors is found in different frequencies. Hence, it is necessary for a module that gathers the data before applying the HMM.
To sum up, a feature vector EF is generated to linearly concatenate the set of labels delivered by the support vector machine during an observation window of 3 seconds, shown in the following structure (5).

2.7.2 Hidden Markov Model Classifier
The HMM training uses 24 states and 32 centroids to build the codebook, and this process chooses the best-performing model after achieving 100 iterations. To evaluate the performance of the trained model, we use a cross-validation strategy, which divides the database into 70 % for training and 30 % for evaluation in 100 iterations of Montecarlo experiments. The average, variance, confusion matrix, and index calculation compute the statistics acquired by the experiments. For every test, the success percentage average will be reported for each class defined by this paper.
2.8 Experiments
The experiments achieved in his work are approached from different parts. First, the joint points are analyzed by applying ReliefF and PCA, allowing the most relevant information of the sensor coordinates to be inferred (a color diagram is used as a representation scale graphic). This enables unlabeled samples to be grouped through similarity analysis and is represented graphically. We perform this procedure graphically by analyzing the values of the covariance function defined in (4), assuming the value σ2 as an initial value of 0.3. When the number of appropriate sets for the data is identified, we evaluate the percentage of supervised labels required by primitive movement detection.
Then, we proceed with a cross-validation experiment to measure the SVM performance by changing the portion of a priori labels (from 10 % to 100 %), i.e., we change the participation of the known labels vs the unknown labels. Therefore, the model performance of the primitive movement classification is evaluated. It is essential to clarify the test seeks to establish the number of known stances by the SVM to divide the primitive motions properly. This process is done by calculating the average success concerning the number of samples classified a priori by the SVM, i.e., we establish the model capacity to recover the unknown labels by evaluating the accuracy for a different proportion of the unlabeled data.
These results will be displayed in bar charts and tables for different sensors used in this work. Also, we include the performance results by considering the different sensor modalities. These results are shown in confusion matrices using color diagrams. For physical activity In Recognition, the results are similarly displayed.
However, we compute the impact by fusing different modes for physical activity identification. The results are compared to those presented in [
3. RESULTS AND DISCUSSION
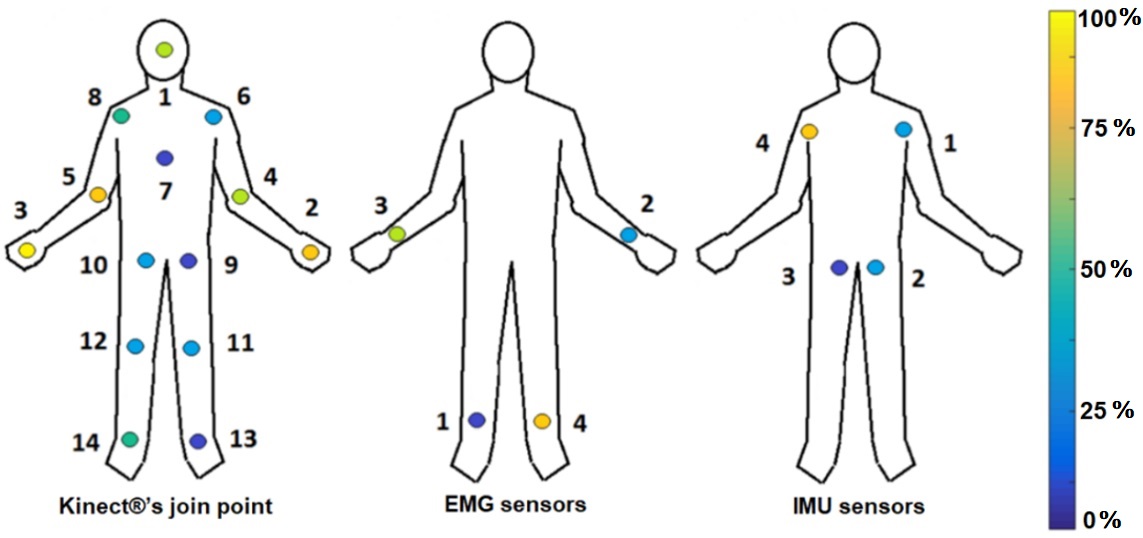
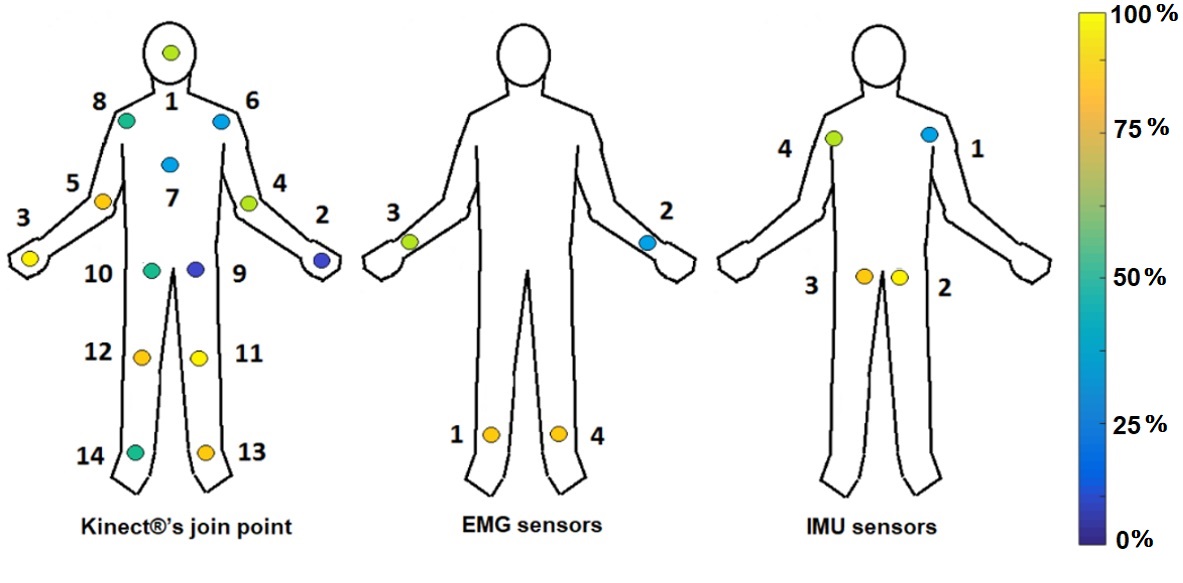
Figures 7 and 8 show the relevant distribution graphic for each joint point sampled by the Kinect®, IMU, and EMG sensors, according to the ReliefF and PCA techniques. The yellow points bring the most relevant information (100 %), while the blue points give the least relevant information (0 %). Figure 7 exposes that using the ReliefF technique, the main features are stored in the arms and hands, while the PCA technique (Figure 8) shows the relevant information presented in the legs. Finally, we establish ReliefF technique offers better results than PCA by bringing reliable information and using fewer joint points.
The results of the similarity analysis are shown in Figure 9 (a, b, c) for each kind of sensor (Kinect®, IMU, EMG). The Kinect®’s Graphic (Figure 9 (a)) presents the information clustered in different sets, where this could build 5, 6, or 7 clusters, but it is unknown which cluster gives the most reliable classification results.
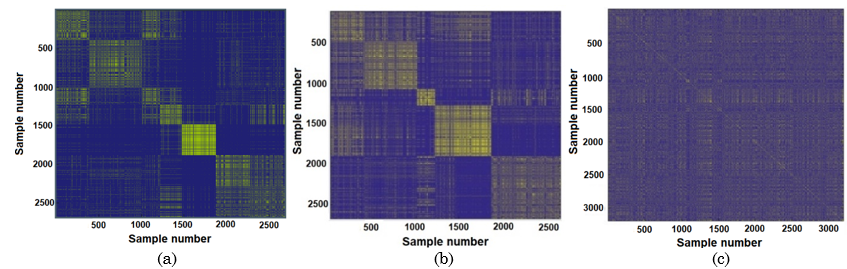
The same happens with the IMU sensor network (Figure 9 (b)). Finally, the sampled data by the EMG sensors (Figure 9 (c)) displays complete overlap, which generates a hypothesis that the data capture was inaccurate or required more EMG sensors to track the primitive motions correctly.
Given the last situation where the number of clusters is uncertain, cross-validation, the process with the SVM is performed by changing the number of sets and calculating the average performance for 200 iterations of Montecarlo. The results of this testing show that 7 clusters have the best performance (see Figure 10). The previous test is based on the low dispersion and more competitive average performance against the other settings. It is crucial to notice the goal is to compute the number of sets that enhance the performance of the primitive motions classifier because they suggest a searching restricted space automatically inferred and not being defined by a prior or by an expert.
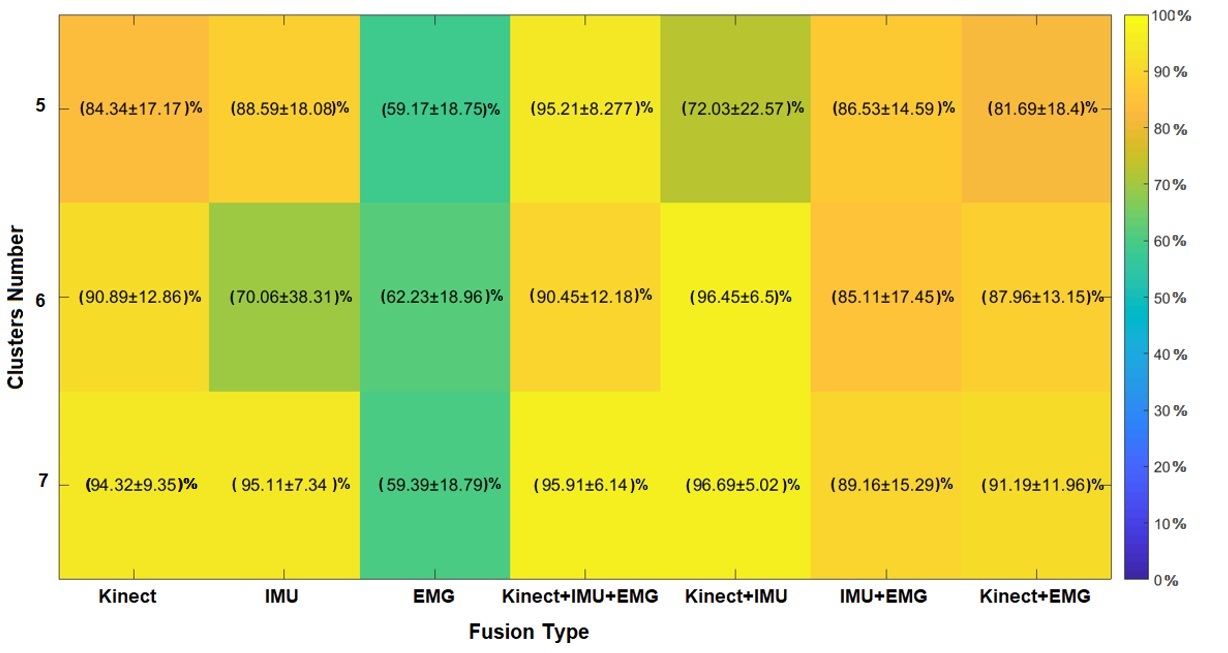
Figure 11 shows the results of the accuracy percentage calculation and standard deviation for a Montecarlo experiment by considering seven clusters. This proves by adding more supervised labels, the system is stabilized, and the dispersion is decreased (see Figures 11 (a) and (b)).
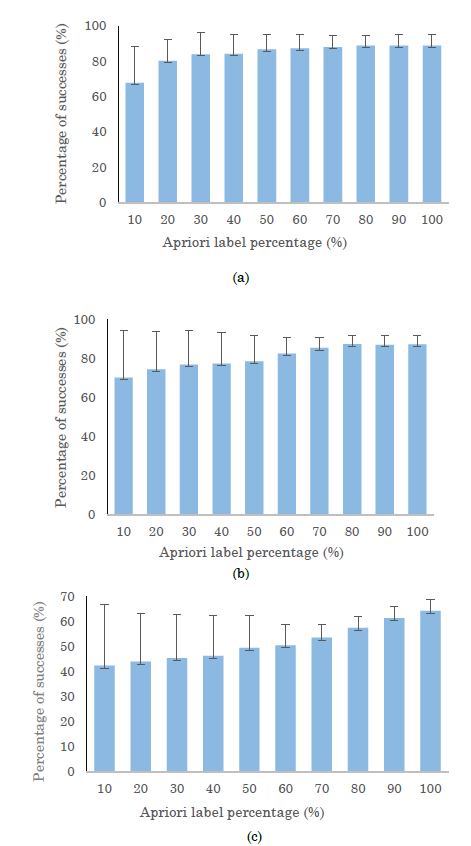
The previous process allows us to infer a suitable percentage of labels happens when the standard deviation is stable, so the recognition process requires 80 percent of a priori samples for Kinect® and IMU modalities. Meanwhile, the EMG sensors require using 100 % of labels, i.e., they need a supervised method for this kind of modality (see Figure 11 (c)). Then, the primitive movement detection performance is verified.
Figure 12 shows the success percentage for seven primitive motions by choosing 80 % of the supervised labels. It shows a reliable performance for primitive motion detection, comparable with state-of-the-art methodologies. However, the EMG sensor only reaches an efficiency of 58.57 % ± 20.15 % despite having 100 % of the a priori labels. This behavior happens for the overlap of the samples in comparison with the other kind of sensor.
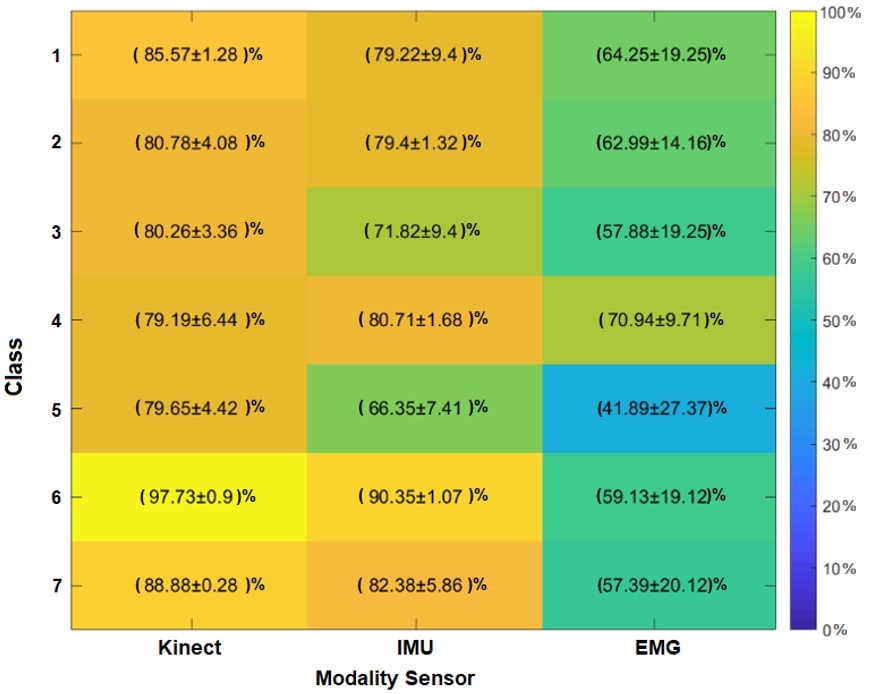
Since the performance of primitive movements is consistent, we perform physical activity recognition using the HMM. The set of labels 𝐸𝐹 are computed by the models that emulate the primitive movement codification (see Figures 10 and 12). Figure 13 presents the physical activity classifier’s performance along with the fusion sensors modality, Kinect®, IMU, and EMG, assuming seven primitive movements have better results than 6 (see Figure 10). Also, the Kinect® sensor has better average performance for classes 1, 3, and 4. IMU Sensor has high average efficiency for classes 2 and 5. Besides, it shows the best total performance average.
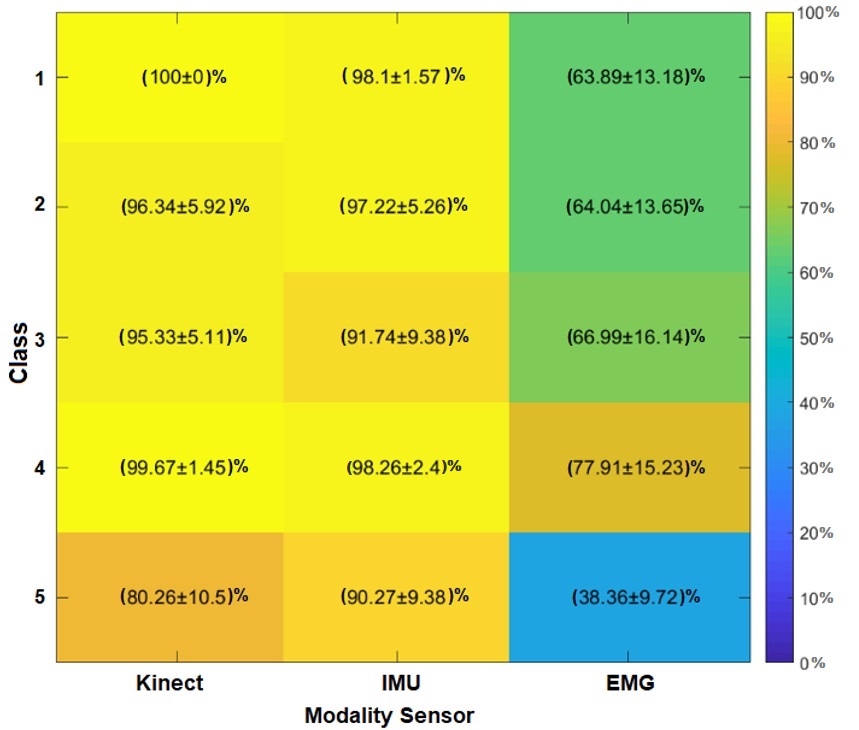
Figure 14 displays the activity classification results considering all fusion modalities: Kinect®+IMU, IMU+EMG, Kinect®+EMG, and Kinect®+IMU+EMG. In Figure 14, we show the sensor modality, Kinect®+IMU, delivers the best average performance for class 1 (along with the modality, Kinect®+IMU+EMG), 2, 3, and 5; also, it has the best total average. Meanwhile, IMU+EMG fusion only has the best average performance for class 4.
The results in Figure 14 suggest uncertainty levels greater than 5 %. This phenomenon occurs due to the variability induced by the EMG modality (see IMU+EMG and Kinect®+EMG). In both fusions, the classifier is confounded (see Figure 14). Although EMG reduces classifier performance, note how the fusion method improves the performance provided by electromyography. This implies that sensor fusion helps to strengthen the individual weakness of each modality and increases classification performance. The above indicates that the EMG modality should not be included since the variability of the fusions is less or similar for the Kinect® and the IMU (comparing the standard deviation of classes 1, 2, and 5).
On the other hand, the performance of the Kinect®+IMU and Kinect®+IMU+EMG fusions is interesting because it improves the stability in the classification, allowing all classes to present detection with greater than 89 % accuracy. Note that the fusion of the three types of sensors does not show the best hit performance due to the instability presented by the EMG modality. This implies that future research is required, in which other forms of description are explored, as well as the inclusion of an EMG sensor network with more sensing points. Although this research is required, the results demonstrate the fulfillment of our hypothesis. This focuses on the primitive motions classification without labels and the competitive performance of the method with other developments in the literature. Finally, we compare the results of this work with another state-of-the-art methodology, such as [1].
We chose this work because it uses a supervised classification strategy for primitive motion detection, which allows us to test the performance and hypothesis of this research. Table 1 shows that the supervised method performs similarly to the unsupervised method. However, the supervised system evidence is in lower deviation; this is observed in the mergers, IMU+EMG, Kinect®+EMG, and Kinect®+IMU+EMG. The above information suggests that the overlap between the EMG database samples hinders the performance of the semi-supervised learning methodology for labeling activities. Although our method has lower performance, its hit rate is competitive, which makes it attractive for this type of application.
and supervised learning models. Source: Created by the author.
| Sensor mode | KINECT+ IMU | IMU + EMG | KINECT+ EMG | KINECT+ IMU + EMG |
| Semi-supervised learning model | (96.69±5.02) % | (89.16±15.29) % | (91.19±11.96) % | (95.91±6.14) % |
| Supervised learning model | (98.03±2.32) % | (97.60±2.55) % | (95.14±3.59) % | (98.04±2.31) % |
Also, Table 1 evidence the difference in the standard deviations between both methods. Note that merging with EMG results in lower accuracy of the semi-supervised algorithm in labeling the activities. This is due to the uncertainty built in each Montecarlo experiment cycle to evaluate the performance of the unsupervised learning technique because it implies changing the selection of the 80 % of the labels in each test, developing fake classifications of micro-movement that impact the physical activity detector’s Performance (HMM). Although the result is lower, the Kinect + IMU and Kinect+IMU+EMG mergers present competitive results, demonstrating the usefulness of this method. The previous is an advantage for the field since fewer labels are required to classify the same activities, translating into less time to train the model and possible costs in labeling the database.
4. CONCLUSIONS
This work presents a methodology that classifies human physical activity through a semi-supervised learning approach; this process defines an automatic method that allows computing the number of micro-movements where the physical activity should be divided and looking at the results from Figure 10. This parameter affects the performance and stability of the SVM. On the other hand, the results in Figure 11 show the robustness of the SVM method for the primitive motions classification when the percentage of known labels is close to 80 %. The previous process is due to the average performance, and uncertainty is similar to a supervised learning approach, i.e., the performance is statistically overlapped.
The results in Table 1 suggest a supervised learning procedure is more stable concerning unsupervised learning due to the lower dispersion, and this behavior prevails for all the sensor modalities presented in this article. However, the results from the fusion of Kinect+IMU and Kinect+IMU+EMG show similar behavior for both strategies. This suggests that the semi-supervised approach is competitive for physical human activity classification against the unsupervised one under these modalities. These results are shown in Figure 14, where the fusion from some sensor modalities (Kinect+IMU) achieves high average performance and stabilizes the uncertainty values for action recognition.
5. ACKNOWLEDGMENTS
The authors wish to thank the Universidad Tecnológica de Pereira for the support received during the development of this research. This work has not been financed by any entity and is the result of work carried out by the authors.
CONFLICTS OF INTEREST
The authors declare that there is no conflict of interest.
AUTHOR CONTRIBUTIONS
Santiago Morales conducted the initial literature review, proposed, and implemented the model, collected, and preprocessed datasets, ran experiments, and drafted the first version of the paper under the supervision of Andrés Calvo and Carlos Henao. Andrés Calvo and Carlos Henao edited and extended the manuscript.
6. REFERENCES
- arrow_upward [1] A. F. Calvo, G. A. Holguin, and H. Medeiros, “Human Activity Recognition Using Multi-modal Data Fusion,” in Progress in Pattern Recognition, Image Analysis, Computer Vision, and Applications, Springer International Publishing, 2019, pp. 946–953. https://doi.org/10.1007/978-3-030-13469-3_109
- arrow_upward [2] R. Gravina, P. Alinia, H. Ghasemzadeh, and G. Fortino, “Multi-sensor fusion in body sensor networks: State-of-the-art and research challenges,” Information Fusion, vol. 35, pp. 68–80, May 2017, https://doi.org/10.1016/j.inffus.2016.09.005
- arrow_upward [3] M. Jiang, J. Kong, G. Bebis, and H. Huo, “Informative joints based human action recognition using skeleton contexts,” Signal Process Image Commun, vol. 33, pp. 29–40, Apr. 2015, https://doi.org/10.1016/j.image.2015.02.004
- arrow_upward [4] A. Bhattacharya, A. Sarkar, and P. Basak, “Time domain multi-feature extraction and classification of human hand movements using surface EMG,” in 2017 4th International Conference on Advanced Computing and Communication Systems (ICACCS), Jan. 2017, pp. 1–5. https://doi.org/10.1109/ICACCS.2017.8014594
- arrow_upward [5] A. Bayat, M. Pomplun, and D. A. Tran, “A Study on Human Activity Recognition Using Accelerometer Data from Smartphones,” Procedia Comput Sci, vol. 34, pp. 450–457, Dec. 2014, https://doi.org/10.1016/j.procs.2014.07.009
- arrow_upward [6] M. Bocksch, J. Seitz, and J. Jahn, “Pedestrian Activity Classification to Improve Human Tracking and Localization,”, in 2013 International Conference on Indoor Positioning and Indoor Navigation, Dec. 2013, pp. 667–671. [Online]. Available: https://www.researchgate.net/publication/259885771_Pedestrian_Activity_Classification_to_Improve_Human_Tracking_and_Localization
- arrow_upward [7] C. Wu, J. Zhang, S. Savarese, and A. Saxena, “Watch-n-patch: Unsupervised understanding of actions and relations,” in 2015 IEEE Conference on Computer Vision and Pattern Recognition (CVPR), Jun. 2015, pp. 4362–4370. https://doi.org/10.1109/CVPR.2015.7299065
- arrow_upward [8] E. H. Spriggs, F. de La Torre, and M. Hebert, “Temporal segmentation and activity classification from first-person sensing,” in 2009 IEEE Computer Society Conference on Computer Vision and Pattern Recognition Workshops, Jun. 2009, pp. 17–24. https://doi.org/10.1109/CVPRW.2009.5204354
- arrow_upward [9] F. Destelle et al., “Low-cost accurate skeleton tracking based on fusion of kinect and wearable inertial sensors,” in 2014 22nd European Signal Processing Conference (EUSIPCO), Sep. 2014, pp. 371–375. Accessed: Oct. 31, 2021. [Online]. Available: https://ieeexplore.ieee.org/abstract/document/6952093
- arrow_upward [10] D. Martín de Castro, “Aplicación Android para el reconocimiento automático de actividades físicas en tiempo real,” Universidad Carlos III de Madrid., Madrid, España, 2012. Accessed: Nov. 14, 2021. [Online]. Available: http://hdl.handle.net/10016/17138
- arrow_upward [11] L. E. Pamplona-Beron, C. A. Henao Baena, and A. F. Calvo-Salcedo, “Human activity recognition using penalized support vector machines and Hidden Markov Models,” Revista Facultad de Ingeniería Universidad de Antioquia, no. 103, pp. 152–163, May 2021, https://doi.org/10.17533/udea.redin.20210532
- arrow_upward [12] M. Georgi, C. Amma, and T. Schultz, “Recognizing Hand and Finger Gestures with IMU based Motion and EMG based Muscle Activity Sensing,” in Proceedings of the International Conference on Bio-inspired Systems and Signal Processing, Dec. 2015, pp. 99–108. https://doi.org/10.5220/0005276900990108
- arrow_upward [13] H. Tannous et al., “A New Multi-Sensor Fusion Scheme to Improve the Accuracy of Knee Flexion Kinematics for Functional Rehabilitation Movements,” Sensors, vol. 16, no. 11, p. 1914, Nov. 2016, https://doi.org/10.3390/s16111914
- arrow_upward [14] S. Feng and R. Murray-Smith, “Fusing Kinect Sensor and Inertial Sensors with Multi-rate Kalman Filter,” in IET Conference on Data Fusion & Target Tracking 2014: Algorithms and Applications, 2014, pp. 1–8. https://doi.org/10.1049/cp.2014.0527
- arrow_upward [15] S. Gaglio, G. L. Re, and M. Morana, “Human Activity Recognition Process Using 3-D Posture Data,” IEEE Trans Hum Mach Syst, vol. 45, no. 5, pp. 586–597, Oct. 2015, https://doi.org/10.1109/THMS.2014.2377111
- arrow_upward [16] K. Chen, D. Zhang, L. Yao, B. Guo, Z. Yu, and Y. Liu, “Deep Learning for Sensor-based Human Activity Recognition: Overview, Challenges, and Opportunities,” ACM Comput Surv, vol. 54, no. 4, pp. 1–40, May 2022, https://doi.org/10.1145/3447744
- arrow_upward [17] R. Mutegeki and D. S. Han, “A CNN-LSTM Approach to Human Activity Recognition,” in 2020 International Conference on Artificial Intelligence in Information and Communication (ICAIIC), Feb. 2020, pp. 362–366. https://doi.org/10.1109/ICAIIC48513.2020.9065078
- arrow_upward [18] A. Bevilacqua, K. MacDonald, A. Rangarej, V. Widjaya, B. Caulfield, and T. Kechadi, “Human Activity Recognition with Convolutional Neural Networks,” in Machine Learning and Knowledge Discovery in Databases, Springer International Publishing, 2019, pp. 541–552. https://doi.org/10.1007/978-3-030-10997-4_33
- arrow_upward [19] M. Robnik-Šikonja and I. Kononenko, “Theoretical and Empirical Analysis of ReliefF and RReliefF,” Mach Learn, vol. 53, pp. 23–69, Dec. 2003, [Online]. Available: https://link.springer.com/article/10.1023/A:1025667309714
- arrow_upward [20] J. Shlens, “A Tutorial on Principal Component Analysis,” Apr. 2014, [Online]. Available: http://arxiv.org/abs/1404.1100
- arrow_upward [21] K. Y. Yeung and W. L. Ruzzo, “Principal component analysis for clustering gene expression data,” Bioinformatics, vol. 17, no. 9, pp. 763–774, Sep. 2001, https://doi.org/10.1093/bioinformatics/17.9.763
- arrow_upward [22] P. Cunningham, B. Kathirgamanathan, and S. J. Delany, “Feature Selection Tutorial with Python Examples,” Jun. 2021, [Online]. Available: http://arxiv.org/abs/2106.06437
- arrow_upward [23] L. Zelnik-Manor and P. Perona, “Self-Tuning Spectral Clustering,” in Adv. Neural Inf. Process. Syst, Dec. 2004, vol. 17. [Online]. Available: https://proceedings.neurips.cc/paper/2004/file/40173ea48d9567f1f393b20c855bb40b-Paper.pdf
- arrow_upward [24] D. Niu, J. G. Dy, and M. I. Jordan, “Dimensionality Reduction for Spectral Clustering.,” in Proceedings of the Fourteenth International Conference on Artificial Intelligence and Statistics, Dec. 2011, vol. 15, pp. 552–560. Accessed: Dec. 06, 2021. [Online]. Available: http://proceedings.mlr.press/v15/niu11a/niu11a.pdf
- arrow_upward [25] J. Platt, “Sequential Minimal Optimization: A Fast Algorithm for Training Support Vector Machines,” Dec. 1998, Accessed: Oct. 06, 2021. [Online]. Available: https://www.microsoft.com/en-us/research/publication/sequential-minimal-optimization-a-fast-algorithm-for-training-support-vector-machines/
- arrow_upward [26] A. Rahimi and B. Recht, “Random Features for Large-Scale Kernel Machines,” in Advances in Neural Information Processing Systems, 2007, vol. 20, pp. 1–8. [Online]. Available: https://proceedings.neurips.cc/paper/2007/file/013a006f03dbc5392effeb8f18fda755-Paper.pdf