Probabilistic and Harmonic Assessment of Power Quality Parameters from Distributed Energy Resources in a Distribution Network
Evaluación probabilística y armónica de parámetros de calidad de energía de recursos energéticos distribuidos en una red de distribución
 PDF
PDF
Accepted: December 17, 2023
Available: January 30, 2024
J. Caballero-Peña, G. Osma-Pinto, “Probabilistic and Harmonic Assessment of Power Quality Parameters from Distributed Energy Resources in a Distribution Network,” TecnoLógicas, vol. 27, nro. 59, e2684, 2024 . https://doi.org/10.22430/22565337.2684
Highlights
Highlights
Abstract
Distributed energy resources (DERs) are leading actors in energy transition worldwide. Despite the environmental benefits, DERs are intermittent (consumption/generation power changes according to the input variables), and the use of power electronic devices affects the power quality in distribution networks. Typically, models and simulations (deterministic or probabilistic) are proposed to estimate such impacts. However, previous studies have analyzed the main effects caused by one or two DERs during a day. These studies had a reduced level of detail in the applied methodology in modeling and impact evaluation, or they did not consider that the harmonic distortion level depends on input variables. The aim of this article was to develop a probabilistic harmonic simulation approach to characterize the hourly effect of photovoltaic systems (PVS), battery energy storage systems, and electric vehicle charging stations in a 34-node IEEE test feeder. The individual and collective effect estimation of the DERs consists of the hourly quantification of the effective voltage value, voltage unbalance, power factor, and harmonic distortion, with data obtained using Python and PowerFactory co-simulation for 23 operation scenarios. These impacts were assessed through indicators proposed in the literature and hypothesis tests (inferential statistics). Each DER generally operates at a specific time, making it easy to identify the individual effects of network parameters. The PVS increased the effective voltage value and total harmonic distortion. However, electric vehicles and batteries increase the voltage unbalance and power factor due to the two-phase connection in some network nodes.
Keywords: Distributed energy resources, python-PowerFactory co-simulation, probabilistic load flow, harmonic distortion, inferential statistics.
Resumen
Los recursos energéticos distribuidos (RED) son actores líderes en la transición energética en todo el mundo. A pesar de los beneficios ambientales, los RED son intermitentes (la energía de consumo/generación cambia según las variables de entrada), y el uso de dispositivos de electrónica de potencia afecta la calidad de la energía en las redes de distribución. Por lo general, se proponen modelos y simulaciones (deterministas o probabilísticas) para estimar dichos impactos. Sin embargo, estudios previos han analizado los principales efectos causados por uno o dos RED durante un día, con un nivel de detalle reducido en la metodología aplicada en el modelado y evaluación de impacto, o sin considerar que el nivel de distorsión armónica depende de las variables de entrada. El objetivo del presente artículo fue desarrollar un enfoque de simulación armónica probabilística para caracterizar el efecto horario de los sistemas fotovoltaicos (SFV), los sistemas de almacenamiento de energía de baterías y las estaciones de carga de vehículos eléctricos en un alimentador de prueba IEEE de 34 nodos. La estimación del efecto individual y colectivo del RED consistió en la cuantificación horaria del valor efectivo de tensión, desequilibrio de tensión, factor de potencia y distorsión armónica, con datos obtenidos mediante co-simulación Python y PowerFactory para 23 escenarios de operación. Estos impactos fueron evaluados a través de indicadores propuestos en la literatura y pruebas de hipótesis (estadística inferencial). Cada RED generalmente opera en un momento específico, lo que facilita la identificación de los efectos individuales de los parámetros de la red. El SFV aumentó el valor de voltaje efectivo y la distorsión armónica total. Sin embargo, los vehículos eléctricos y las baterías aumentan el desequilibrio de tensión y el factor de potencia debido a la conexión bifásica en algunos nodos de la red.
Palabras clave: Recursos energéticos distribuidos, co-simulación Python-PowerFactory, flujo de carga probabilístico, distorsión armónica, estadística inferencial.
1. INTRODUCTION
Exponential growth in demand, greenhouse gas emissions, rapid depletion of fossil fuels, and global mismatch between supply and demand are caused by population growth and urbanisation [
The value of a DER lies in its capacity to reduce conventional energy participation, reduce greenhouse gases, decentralise energy, create new business models, and overcrowd prosumers [
PVS enhance system reliability and efficiency when operated properly; the large-scale adverse effects include power fluctuation, flicker, power losses, and increased levels of harmonic distortion [
It is important to stress the impact on power quality for the entire group of effects produced by DER integration [
In this context, previous studies have used probabilistic and deterministic simulation approaches to determine the influence of the parameters produced by DER. Moreira et al.[
Other studies have analysed the influence of DER through in situ measurements. [
The literature shows that each DER has its impacts on the power grid, such impacts depending on the connection location and the installed capacity. In addition, some effects can be mitigated if two DERs operate jointly. Specifically, the effects on power quality parameters depend on the power electronics devices and vary according to the specifications of each one.
However, there is a need for studies that consider joint integration of more than two DERs to analyse the impact on power quality parameters that make the analysis more realistic. Additionally, few studies modelling DER have considered stochastic input values. Similarly, DER harmonic models that depend on input variables are ignored (e.g. a low level of solar irradiance causes high current harmonic distortion levels). These must be considered in each hour for more accurate investigations and simulations. Inferential statistics are a simple tool that should be considered given the large amount of data that probabilistic analyses yield; to date, only measurements have been used. To the best of our knowledge, no study has analysed the joint impact of PVS, EV, and batteries using a harmonic probabilistic approach through a co-simulation between PowerFactory and Python.
Following the above, the objective of this study is to analyse the joint impact of three DERs, namely PVS, EV, and BESS, on power quality parameters from a probabilistic approach. For this purpose, this study models PVS and electric vehicle charging stations (EVCS) as probabilistic density functions (PDF), considering recent irradiance data, temperature, and travel behaviour. A rule-based management strategy was defined for BESS and fitted to a probabilistic approach. A harmonic load flow (HLF) was executed in DIgSILENT PowerFactory in an iterative process using the Monte Carlo method. The results were extracted and analysed.
This study focuses on the hourly analysis of power quality parameters: effective and unbalanced voltage, power factor, and voltage and current harmonic distortion. The impacts were studied and quantified using indicators and inferential statistics. To quantify the individual and collective effects, 23 simulation scenarios were defined using the 34-node IEEE test feeder.
The remainder of this paper is structured as follows: Section 2 presents the methodology and DER modelling; Section 3 describes the case study, simulation scenarios, indicators, and inferential statistics; Section 4 presents the results obtained for all parameters; Sections 5 and 6 present a discussion and conclusions, respectively.
2. METHODOLOGY
This section presents the communication process between PowerFactory and Python to carry out the probabilistic harmonic analysis (2.1), load (2.2), PVS (2.3), and EVCS (2.4) modelling, the BESS rule-based management strategy (2.5), and the study case (2.6). This study considered actual data to define the most suitable DER model.
In general, to apply the methodology, the following steps must be followed: model the electrical network in PowerFactory, define the DER to be analyzed, define the number of scenarios (capacity and connection points), model each DER in PowerFactory, establish the co- simulation between Python and PowerFactory to run a harmonic analysis many times (e.g. in this study 100 times) extract the data from each simulation, and finally analyze it using heat maps and inferential statistics.
For each hour of the day of each scenario and for each sample of the harmonic analysis, the PVS and EV have a power value at nominal frequency defined by a distribution and a current source model must be selected within a set of models defined by previous measurements. In the case of BESS, predefined rules must be defined through a quasi-dynamic analysis for each day of each scenario. These also have harmonic patterns and vary randomly.
2.1 Probabilistic harmonic analysis
The methodology of this study focused on Python and PowerFactory co-simulations. PowerFactory performs the study case modelling and executes the harmonic load flow; Python provides the current source models of the DER and automates the tasks. Figure 1 shows a harmonic simulation flowchart for 100 samples, considering the inputs, outputs, and software interactions. The process is repeated 100 times, considering the input randomness, making the process probabilistic with a harmonic load flow.

Source: Created by the authors.
The first step is to model the test network and the DER at the fundamental frequency. Then, the BESS management strategy is defined in PowerFactory. It is necessary to specify the number of scenarios, DER location, and DER capacity (first iteration cycle). Subsequently, the “n” harmonic models for loads, EV, BESS, and PVS must be defined for each hour and sent to PowerFactory (second cycle). The harmonic load flow is executed "n" times, modifying the PDF input values and harmonic models in each iteration (third cycle). The HLF results were exported to Excel for analysis.
2.2 Load modelling
A Gaussian distribution can describe the demand pattern whose standard deviation (σ) is in the range of 5 % to 10 % of the mean value (µ) [
Source: Created by the authors.
2.3 PVS modelling
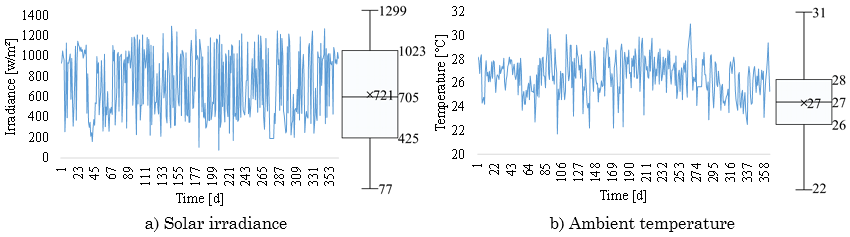
Solar irradiance and ambient temperature data are the basis of PVS modelling. These data were obtained from the Electrical Engineering Building at Universidad Industrial de Santander (UIS; Bucaramanga, Colombia) for each hour of the day during the year. Figure 3 presents the solar irradiance and ambient temperature data at Hour 12, considering every day of the year, with mean values of 721 W/m2 and 26.6 °C, respectively. One hundred samples from the entire group for one hour were used as input for the fundamental frequency model.

Source: Created by the authors.
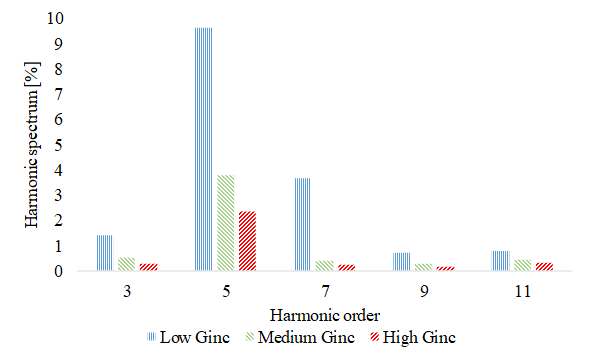
The PVS harmonic model is the current source for considering frequencies higher than the fundamental frequency and is characterized by on-site data. Figure 4 presents the mean values by harmonic order concerning the fundamentals of a PVS connected to the UIS network, grouped by the solar irradiance level. The percentage value variations of the current harmonic spectrum are higher in the low-irradiance case than in the high-irradiance case [
Source: Created by the authors.
2.4 EV modelling
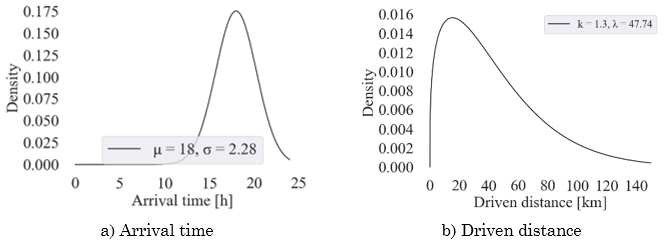
The estimation of the daily demand profile for EV relies on driver behavior data, encompassing factors such as daily travel distance and arrival time. This information was obtained from the National Household Travel Survey, which provides data on transport behavior in the United States. The arrival time PDF (Normal [
Source: Created by the authors.
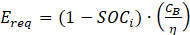
The daily travel distance (d) plays a crucial role in determining the state of charge of the vehicle battery (𝑆𝑂𝐶𝑖) upon arrival at home. It is also a critical parameter to assess the energy required to charge the vehicle entirely. The charging time 𝑡𝑐ℎ can be estimated by considering a constant charging power P, as depicted in (1), (2) y (3). 𝑆𝑂𝐶𝑖 represents the initial state of charge; 𝐸𝑐 is the electric vehicle consumption in kWh/km; 𝐶𝐵 is the nominal battery capacity in kWh; d is the daily travel distance in km; 𝐸𝑟𝑒𝑞 is the energy required to charge the EV completely in kWh, and η denotes the charging efficiency. The simulations charge the EV at 43 kW (fast charging).
 (1)
(1) (2)
(2) (3)
(3)
Figure 6 shows the daily demand profile and normal distribution defined by one hour for the probabilistic analysis. This result is obtained from the EV number (33 in each EVCS), the probability of each connected EV, and charging power (43 kW). The probability of vehicles being connected within a one-hour timeframe (blue bars) corresponds to the total number of vehicles linked to the charging station (orange bars). This alignment arises since the necessary charging duration is either less than or equal to one hour. The normal distribution was defined by considering the power value of the daily profile as the mean value and the standard deviation as 5 % of the mean value. For instance, each station had six EVs (18 % of 33) connected at Hour 18 with a charging power of 43 kW, indicating a consumption per station of 250 kW.

Source: Created by the authors.
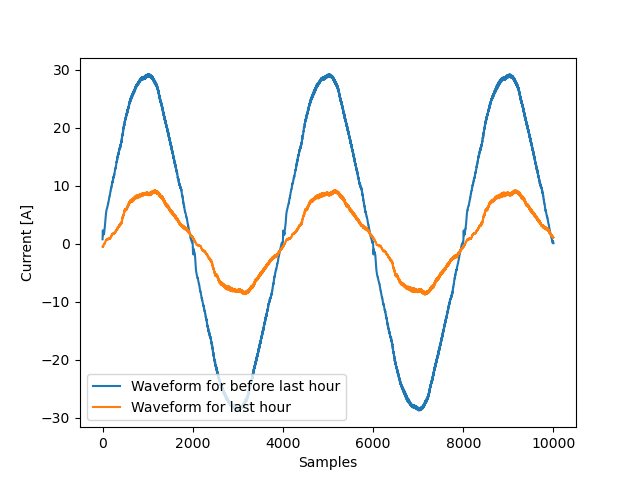
The Dutch lab (ElaadNL) provided the charging data for the Nissan Leaf during the charging process; variation in the current distortion level was observed with decreased charging power, as reported by [
Source: Created by the authors.
2.5 BESS modelling
A quasi-dynamic simulation language model was selected because it could be easily adapted to the BESS rule-based management strategy. The battery energy management and energy from/to the network must adapt according to the power balance, as shown in (4) where the generator convention was adopted.
 (4)
(4)
Moreover, a dead band was implemented to prevent undesirable behavior by incorporating the limits P StartFeed and P StartStore, which are parameters embedded in the QDSL model. Consequently, the charging/discharging operational mode was identified based on energy flow through the supply line. In this operational mode, ChargeP was defined in accordance with (5)
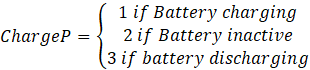 (5)
(5)
Accordingly, the BESS can charge to restore the SOC for periods when P is above the dead band (low energy demand). For periods when P is below the dead band (high energy demand), the BESS can be discharged to minimize the net import of energy from the grid. On the other hand, the battery’s SOC is a crucial parameter denoted as a percentage and representing the proportion of energy still available in the battery over the total energy when fully charged. Therefore, SOC is a state variable of the model with the condition 𝑆𝑂𝐶𝑚𝑖𝑛 ≤ 𝑆𝑂𝐶 ≤ 100%. The temporal evolution of SOC can be described using (6) assuming unity transfer efficiency between the AC and DC sides of the battery converter system.
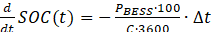 (6)
(6)
Additional considerations must be made to limit the BESS charging/discharging mode operation, depending on the current SOC. Accordingly, ChargeE mode operation is defined by (7) where 𝑆𝑂𝐶𝑚𝑖𝑛 and 𝑆𝑂𝐶𝑚𝑎𝑥 are the maximum and minimum allowed states of charge, respectively.
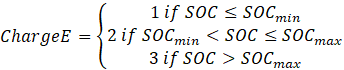 (7)
(7)
2.6 Study case
The IEEE 34-node test feeder was considered as a case study, including features that are more common in current networks such as voltage regulators and unbalanced loads [

Source: [
2.6.1 Simulation scenarios
To cover a wide range of possible DER connections, 23 scenarios were proposed (0–22). Scenario 0 represents the base case and is the reference to estimate the DER integration impact; Scenarios 1–8 integrate a single DER; Scenarios 19, 20, and 21 integrate two DER; Scenario 22 integrates three DER. Table 1 presents the resources used for each scenario. The maximum installed capacity per node of PVS, EV, and BESS was 2.0 MVA, 1.0 MVA, and 0.32 MVA, respectively. The maximum capacity values were chosen according to the actual values (PVS high integration and BESS low integration). The values were less than the rated capacity of the transformer (2.5 MVA), with 80 %, 40 %, and 12.8 % for PVS, EV, and BESS, respectively.
Source: Created by the authors.
| # | PVS | EV | BESS | |||||||
| Cap. [kVA] | Location | # | Cap. [kVA] | Location | # | Cap. [kVA] | Location | # | ||
| 0 | --- | --- | --- | --- | --- | --- | --- | --- | --- | |
| 1 | 1200 | 802,806,808,812 | 1200x4 | --- | --- | --- | --- | --- | --- | |
| 2 | 2000 | 802,806,808,812 | 2000x4 | --- | --- | --- | --- | --- | --- | |
| 3 | 1200 | 816,824,830,854 | 1200x4 | --- | --- | --- | --- | --- | --- | |
| 4 | 2000 | 816,824,830,854 | 2000x4 | --- | --- | --- | --- | --- | --- | |
| 5 | 1200 | 858,834,860,836 | 1200x4 | --- | --- | --- | --- | --- | --- | |
| 6 | 2000 | 858,834,860,836 | 2000x4 | --- | --- | --- | --- | --- | --- | |
| 7 | --- | --- | --- | 1000 | 802,806,808,812 | 5x4 | --- | --- | --- | |
| 8 | --- | --- | --- | 1600 | 802,806,808,812 | 8x4 | --- | --- | --- | |
| 9 | --- | --- | --- | 1000 | 816,824,828,854 | 5x4 | --- | --- | --- | |
| 10 | --- | --- | --- | 1600 | 816,824,828,854 | 8x4 | --- | --- | --- | |
| 11 | --- | --- | --- | 1000 | 864,842,860,840 | 5x4 | --- | --- | --- | |
| 12 | --- | --- | --- | 1600 | 864,842,860,840 | 8x4 | --- | --- | --- | |
| 13 | --- | --- | --- | --- | --- | --- | 320 | 802,806,808,812 | 80x4 | |
| 14 | --- | --- | --- | --- | --- | --- | 160 | 802,806,808,812 | 40x4 | |
| 15 | --- | --- | --- | --- | --- | --- | 320 | 816,824,828,854 | 80x4 | |
| 16 | --- | --- | --- | --- | --- | --- | 160 | 816,824,828,854 | 40x4 | |
| 17 | --- | --- | --- | --- | --- | --- | 320 | 858,834,836,840 | 80x4 | |
| 18 | --- | --- | --- | --- | --- | --- | 160 | 858,834,836,840 | 40x4 | |
| 19 | 2000 | 806,824,830,860 | 2000x4 | 1600 | 806,824,828,840 | 8x4 | --- | --- | --- | |
| 20 | --- | --- | --- | 1600 | 806,824,828,840 | 8x4 | 320 | 808,824,828,858 | 80x4 | |
| 21 | 2000 | 806,824,830,860 | 2000x4 | --- | --- | --- | 320 | 808,824,828,858 | 80x4 | |
| 22 | 2000 | 806,824,830,860 | 2000x4 | 1600 | 806,824,828,840 | 8x4 | 320 | 808,824,828,858 | 80x4 | |
The nodes used to integrate the DER were selected to integrate the EV, PVS, and BESS between each voltage-regulated transformer. The defined scenarios varied according to the DER capacity and location when they were connected individually. For collective impact, the highest scenarios were considered. Thus, each of the three sections represents individual and collective DER integration.
2.6.2 Evaluation indicators
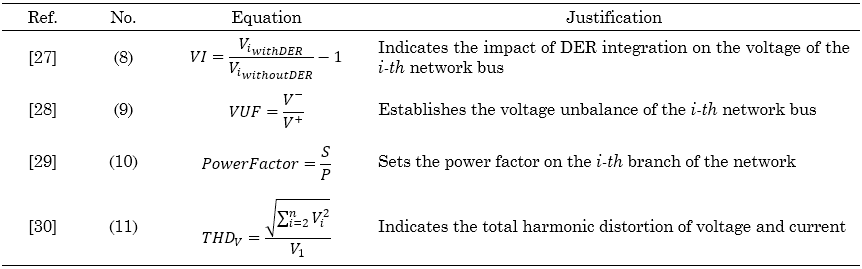
The impact characterization for each scenario was based on the estimation and analysis of the voltages (𝑉𝐴𝑁, 𝑉𝐵𝑁, and 𝑉𝐶𝑁) and currents (𝐼𝐴, 𝐼𝐵, and 𝐼𝐶) per frequency. Additionally, metrics were considered to assess the impacts caused by DER operation in electrical networks. The indicators are presented in Table 2. Based on the data provided by PowerFactory, it was possible to quantify the first three indicators of the table: node voltage variation (𝑉𝐼𝐴, 𝑉𝐼𝐵, and 𝑉𝐼𝐶), voltage unbalance factor (VUF), and power factor per phase. In addition, voltage and current harmonic distortions were calculated using frequency values. In total, thirteen parameters were considered in this study.
Source: Created by the authors.
2.6.3 Inferential statistics
Inferential statistics, comprising techniques such as point estimation, interval estimation and hypothesis tests, allow us to infer whether there exists statistical evidence supporting the presence of an impact, which strengthens the quality of the results.
The hypothesis tests involve two hypotheses: the null hypothesis (𝐻0) and alternative hypothesis (𝐻1), with 𝐻1 dictating whether the test is one- or two-sided. Hypothesis testing is categorized into parametric or non-parametric approaches depending on whether a Gaussian distribution adjusts the sample data. Parametric methods include the Student’s t-test, Student’s t-test for paired data, and variance analysis. Non-parametric tests were used, including the Wilcoxon rank-sum, Kruskal–Wallis H, and Mann–Whitney U tests. In both cases, the null hypothesis was accepted when the test P-value was higher than the critical value for a certain confidence level (α).
The comparison between mean values under two scenarios, with  and without
  DER integration, was facilitated by (12) The acceptance of H0 suggests no statistical difference between the two means. Nevertheless, by calculating a percentage difference, it becomes possible to assert that the integration of DER does not affect a specific parameter [
 (12)
(12)
3. RESULTS AND DISCUSSION
This chapter presents the results obtained from probabilistic harmonic simulations in the case study to quantify power quality parameters. The results correspond to the effective node voltages (Section 3.1), voltage unbalance (Section 3.2), power factor (Section 3.3), voltage total harmonic distortion (Section 3.4), current total harmonic distortion (Section 3.5), application of inferential statistics (Section 3.6), and the discussion (Section 3.7).
3.1 Voltage effective value
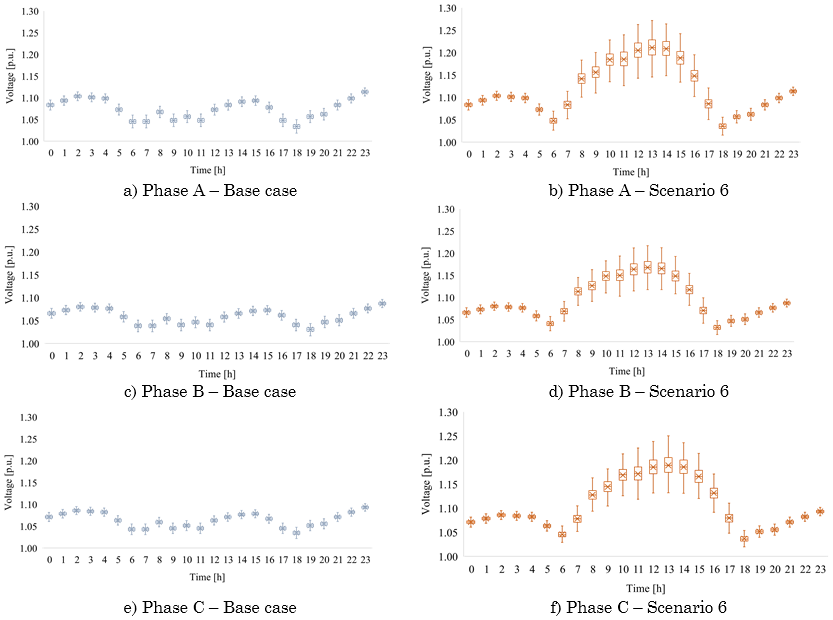
Figure 9 shows the probabilistic voltage results at Node 836 (the end zone of the feeder). A difference between the base case scenario (blue) and Scenario 6 (orange) results is observed due to the unique integration of the PVS. The greatest variations occurred during daytime hours (6 am–6 pm), with the most significant impact at midday. It was also observed that the PVS increased the interquartile range of the data owing to significant solar irradiance variability. In the base case, the voltage regulator transformers maintained the voltage of the three phases above 1.0 p.u. When connecting PVS at the end of the main branch, a considerable increase of almost 12 % was observed at noon in nodes close to the connection. The three phases (A, B, and C) of Node 836 had the same tendency, as the daily demand profile was the same for all loads. Node 836 was located on the main three-phase branch and did not have a considerable unbalance.
Source: Created by the authors.
Figure 10 depicts the average voltage values in p.u. for all scenarios at Node 840 during the day. Four regions were observed: the PV integration (Scenario 1 to Scenario 6), EV integration (Scenario 7 to Scenario 12), BESS integration (Scenario 13 to Scenario 18), and the integration of multiple DERs. Magenta represents values above 1.07 p.u. and green represents values below 1.04 p.u. The brightest magenta color represents the impact of the PVS, and the brightest green represents the impact of the EV.

Source: Created by the authors.
The impact of PVS was considerable during the day; the most significant impact occurred when PVS were connected in nearby areas. The maximum values were 1.21 p.u., 1.17 p.u., and 1.19 p.u., for phases A, B, and C, respectively, in Scenario 6, Hour 13. However, the EV affected the voltage parameter at night proportionally to the installed capacity. In scenarios 14 and 18, the maximum impact due to EV occurred with minimum values of 0.57, 0.92, and 0.76 for phases A, B, and C, respectively. When the BESS was integrated, no significant impacts on the voltage were observed. Figure 11.
Source: Created by the authors.
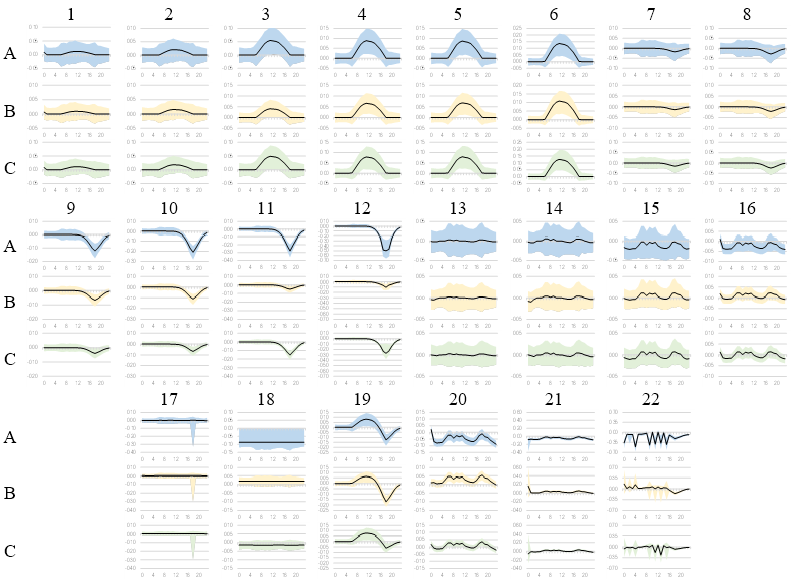
Figure 11 shows the differences between the two sample populations for phases A (blue), B (yellow), and C (green). The black line represents the difference between the means of Scenario X and Scenario 0, as shown in (13) The first six scenarios presented a positive difference produced by the PVS connection. The maximum difference occurred in Scenario 6 with values per phase of 0.20, 0.15, and 0.20, respectively. In the following six scenarios (7 to 12), the difference was negative, representing a decrease in the effective voltage value owing to the EV connection. In the BESS connection scenarios (13 to 19), the behavior was almost constant, with some peaks due to the connection and disconnection of batteries.
 (13)
(13)
3.2 Unbalance voltage
Probabilistic analysis calculates the unbalanced voltage value for all three-phase nodes using the second indicator (Table 2). Node 834 was chosen to analyze the voltage unbalance because it was in a central network zone and had the highest load; the bi-phase and three-phase values were derived from it. Figure 12 presents the probabilistic voltage unbalance results for the node for one day in the base case and 19 scenarios. It was observed that in the base case, the unbalance value remained constant during the day, with values between 0.0 % and 1.0 %. The unbalance remained almost constant during daylight hours, indicating that PVS did not have a considerable impact. However, when EVs were integrated, the unbalanced value increased to almost 3 % (Hour 18).

Source: Created by the authors.
Figure 13 shows the voltage unbalance heat map at Node 830 (central feeder zone) for all scenarios during the day. The scenarios that involve EV (7–12) had a more significant impact on the unbalance. This can be attributed to the fact that the two EVCS connected at the end of the system were biphasic. Moreover, the unbalance reached a value close to 5 % in nodes between the two regulating transformers, except in Hours 17, 18, and 19 for Scenario 12, which had values of 6.85 %, 7.00 %, and 6.67 %, respectively. The connection of the other two DERs (PVS and BESS) did not produce significant variations in the voltage unbalance parameter, which can be attributed to the fact that these resources were three-phase and that the base case had a low level of unbalance (less than 1 % and 2 % for PVS and BESS, respectively).
In Scenarios 21 and 22, some load–flow convergence issues occurred, producing unusual results due to the internal control loops of the batteries.

Source: Created by the authors.
Figure 14 presents the sample differences in the voltage unbalance indicator between Scenarios X and 0. For the PVS (Scenarios 1 to 6), there were no significant variations in the base case; the greatest difference occurred in Scenario 6 with a deterioration of the unbalance indicator of up to 0.75. In the EV connection scenarios, there was a deterioration of the indicator of up to 8 in Scenario 12 (the most critical EV integration scenario) due to the EV two-phase connection at the end of the main branch. The difference produced by the integration of the BESS was insignificant and occurred when the batteries began operating. In Hour 0 of Scenario 21, there was a significant variation owing to the operation of all connected BESS.

Source: Created by the authors.
3.3 Power factor
Figure 15 shows the power factor mean value in Line 836–840 (last line of the main branch) for all scenarios during the day. Phase A had the highest power factor values and phase C had the lowest values, mainly due to the characteristics of the connected loads.

Source: Created by the authors.
However, it is observed that the PVS did not have an impact in any scenario due to the defined three-phase model, with values close to 1 for the three phases. On their behalf, EVs significantly affected the power factor. For instance, the power factor improved considerably, with values close to 1.0 in Scenarios 11 and 12 owing to the unity factor model defined for the EV. The BESS negatively affected the power factor, as observed in Scenario 18, where the power factor deteriorated by approximately 11 %, 5 %, and 30 % for phases A, B, and C, respectively.
Figure 16 presents the power factor difference for each scenario for the base case for the three phases. Scenarios 11 and 12 have a significant impact owing to the connection of EV, with phase C having the most significant impact (0.35). BESS causes the power factor to vary, as shown in the figures for Scenarios 17, 18, and 22. The main reason for this variation was the calculation of the reactive power model. The highest range of variation occurred in Phase C of Scenario 22 (-0.4 to 0.4). The PVS did not affect the power factor because the defined model delivered only the active power.

Source: Created by the authors.
3.4 Voltage total harmonic distortion
The THDv parameter was obtained through PowerFactory harmonic analysis. The analysis was repeated 100 times with 100 input values to obtain 100 output values. The base scenario did not have harmonic distortion because there was no prior information on the level of distortion in IEEE 34-node network loads.
Three scenarios and three specific hours were selected to compare the integration of the three resources. Scenarios 6, 12, and 18 in Hours 12, 20, and 0 were the most critical for integrating the PVS, EV, and BESS. Figure 17 shows the voltage THD results for the scenarios at Node 824 for the three phases. The average result did not show high distortion values and did not exceed 1 %. Phase C was the most affected because it had the highest DER integration, and the PVS produced the greatest distortion because it had the greatest installed capacity.

Source: Created by the authors.
3.5 Current total harmonic distortion
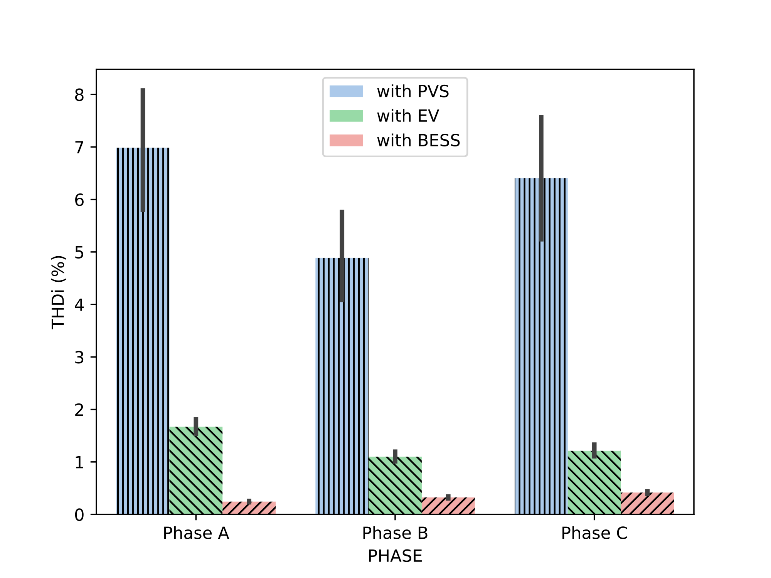
This section presents the results of the current harmonic distortion and total demand distortion. Line 824–828 was selected to observe the behavior of the parameters in the central zone of the IEEE 34-node network. Like the voltage distortion, the same scenarios were used to analyze the behavior of the current distortion. Figure 18 shows the current THD levels in the scenarios and most critical hours in Line 824–828. The average values showed a considerable impact when the PVS were connected in the network, reaching values higher than 5 % in the three phases. Phases A and C were the most affected by DER integration. The capacity defined for EV and BESS did not produce significant variations in the current distortion, with values below 2 %.
Source: Created by the authors.
Figure 19 presents the difference between Scenario X and the base case. Although the PVS had a more significant injection of distorted current during hours of low irradiance, an almost linear behavior was observed owing to the level of distortion and the injected current. The PVS impacted the THDi during daylight hours, with maximum values of 30, 20, and 10 for phases A, B, and C, respectively. The BESS did not affect this parameter because the installed capacity of the network was low. The EV had a higher THDi value at Hour 18 because the maximum integration occurred at that time.

Source: Created by the authors.
3.6 Application of inferential statistics
Inferential statistical analysis was applied to the parameters of voltage (Node 840), unbalanced voltage (Node 802), power factor (Line 800-802), and voltage and current THD. These specific network locations correspond to the first and last nodes of the main branch and the main network section, respectively. The purpose of the analysis was to support statistical evidence that there were differences between the base case mean and the mean of each scenario for the same parameter. Additionally, the mean values between Scenarios 1 and 23 were compared to identify the variations of each parameter between the case that only integrated the PVS and the case that integrated all DER. Thus, inferential statistics involves two stages: normality and hypothesis tests.
Four normality tests were performed: Shapiro-Wilk (SW), Kolmogorov-Smirnov (KS), Chi-squared (CS), and K2 D’Agostino (DA). The results showed that the tests were unreliable for this study; KS showed that all distributions were normal, and CS showed that all distributions were non-Gaussian. The SW may present errors based on the number of samples. Thus, the DA test was selected, which showed that most parameter data did not exhibit normal behavior. Consequently, this study used the parametric Student’s t-test for normal distributions and the non-parametric Wilcoxon signed-rank sum test for non-normal distributions.
Figure 20 shows the heat maps for each parameter under analysis. The green-magenta heat maps (Figure 20 b–d) correspond to the results of inferential voltage statistics. The blue-yellow color map (Figure 20 (a)) corresponds to unbalanced voltage. The cyan-orange (Figure 20 e–g) and blue-yellow (Figure 20 h–j) heat maps correspond to the power factor and current THD results, respectively. The numbers and colors in each cell correspond to the percentage difference between the means of each scenario and the base case (x-0) calculated using Equation (13). A difference with a positive sign indicates that scenario x recorded an increase in the mean compared with the base case. A negative sign indicates an opposite trend. For this reason, two colors per heat map were selected, which helped to identify positive and negative impacts. A different treatment was performed for the THD parameter because, at certain hours of the day in some scenarios, the values of these variables are zero, so it is impossible to obtain the percentage difference as defined in (14) In this case, the difference between the means was obtained. Figure 20 shows two types of numbers; a number that appears crossed out indicates that the null hypothesis was accepted; a number without a line represents the rejection of the null hypothesis. In addition, the grey cells indicate that the null hypothesis was accepted. This is a practical approach to observe the impacts of each DER, its percentage of variation in each parameter, and visually through colors.
 (14)
(14)
The results indicate that the voltage parameter was affected by the base case at certain hours of the day depending on the integrated DER. For instance, the voltage results (Figure 20 a–c) show that the PVS integration increased the effective voltage value to 10 % in Phase B between 6 am and 6 pm (hours of solar resource). Connecting the EV to the distribution network caused a voltage decrease of up to 11 % in Phase B; the integration occurred between 3 pm and 11 pm (arrival time of the EV at the EVCS). The BESS did not significantly impact the effective value of the voltage. Their effects could not be categorized within a specific time range, as observed for the integration of the PVS and EV. The phases most affected by the integration of the DER were A and C because they had a greater demand than Phase B. Thus, they were more susceptible to the variations produced by the DER as they had a high drop associated with the system load.
Concerning the voltage unbalance (Figure 20 (d)), Node 802 (central node) had a significant impact. EV and BESS are DER that had more impact and caused voltage unbalance because they were connected in a biphasic manner in the final zone of the branch. The percentage differences in the voltage unbalance reached maximum percentage values of 150 % in Scenario 18.
The power factor (Figure 20 e–g) was more affected by PVS integration. The most critical scenario for this parameter was when the PVS was connected in the most distant areas of the system, and the impact increased proportionally to the PVS installed capacity. The maximum percentage differences per phase were -26 %, -44 %, and -77 %, respectively. The EV and the BESS did not present variations greater than 5 % in any scenario.
The THDi distortion factor (Figure 20 h–j) had a considerable impact when PVS and EV were connected to the distribution network. The greatest impact on the current distortion was observed when the PVS was integrated. Phase C was the most affected by the voltage and current distortion, with a maximum difference of 7.2 % and 1.0 %, respectively.

Source: Created by the authors.
3.7 Discussion
DER (PVS, EV, and BESS) technologies were installed in low- and medium-voltage networks. However, these resources are a challenge in current networks because they introduce electronic devices, such as load controllers, converters, and inverters. This can cause malfunctions in operation owing to bidirectional power flows, parameters outside prescribed limits, and increased losses [
In the literature, power quality parameters are analyzed in two ways: measurements [
This study shows that the inherent randomness of DER affects the voltage and current distortion levels; for instance, low irradiance produces high levels of current distortion, and vice versa. However, it is evident that the level of distortion in current and voltage remains constant, primarily because the current magnitude during periods of low irradiance is relatively low, and its influence is not significant. The EV also impacts the current distortion, but under the premise that each type of vehicle or brand has different behaviors in the charging process and for distortion levels. The greatest impacts occur when more vehicles are connected to the network.
The impact of DER on electricity grids depends mainly on the physical characteristics of the grid, the integrated DER, the place of connection and the installed capacity. In general, a connection study should be performed each time a new DER is integrated into the grid. For this purpose, this study presents some reliable models that consider randomness for better estimates of the effects on electrical parameters. In addition, some types of graphs to analyze impact simply are proposed.
A comparison of related papers is presented in Table 3 Only some studies considered collective and individual DER integration. In addition, we studied the impact using inferential statistics. Only a few studies analyzed the impact of DER, considering the dependence between input variables and harmonic distortion levels. These gaps in the literature were addressed in this study.
Source: Created by the authors.
| Reference | [ |
[ |
[ |
[ |
[ |
[ |
[ |
This study |
| PVS integration | ü | û | ü | ü | û | ü | ü | ü |
| EV integration | û | ü | û | ü | ü | û | ü | ü |
| BESS integration | û | û | û | û | û | û | ü | ü |
| Different penetration levels | ü | ü | ü | ü | ü | ü | ü | ü |
| Different DER locations | û | û | û | ü | û | û | û | ü |
| Input uncertainty variables of DER | ü | ü | û | ü | ü | ü | ü | ü |
| Unbalance three-phase test feeder | ü | - | ü | ü | - | ü | ü | ü |
| Input variable dependence of harmonic parameters | ü | û | û | û | û | û | û | ü |
| Inferential statistics | û | û | û | û | û | ü | û | ü |
| Inferential statistics | û | û | û | û | û | ü | û | ü |
The proposed methodology presents advances in probabilistic modelling of DER considering its inherent uncertainty, which is closer to reality. In addition, the use and co-simulation between Python and PowerFactory, two software of interest in engineering topics. However, the Gaussian distributions defined for the case of EV and loads may not correctly model the data under certain conditions of the day. For this reason, another type of distribution and some comparison with real measurements could increase the precision of the models.
Future research should use the models defined here to determine the optimal location and capacity of the DER in electrical distribution networks. Other technologies are used for electric vehicles (smart charging and V2G). New methods have been developed to manage the energy of storage systems. All factors can vary the results presented in this study.
4. CONCLUSIONS
DER modelling as probability density functions and current sources dependent on random input values produces more reliable results, considering variations in the input values of each DER. In general, each DER operation occurs at a specific time of the day, which facilitates the identification of individual impacts on network parameters. The high-capacity values of PV generation arise around noon because it is the hour with the highest solar irradiance, and the EV demands more energy from 4 pm to 9 pm because it is the characteristic time when people return home after work. However, BESS generates and consumes energy throughout the day, causing irregular impacts. It is important to mention that the impact of each DER on electricity grids is primarily contingent upon the physical attributes of the grid, the integrated DER, the point of connection, and the installed capacity.
For estimation using indicators, all parameters in the defined scenarios present variations with respect to the base case the base case. PVS increases the RMS voltage value, whereas EV decreases this parameter. The magnitude of the impact depends considerably on the connection location and installed capacity. BESS does not affect the voltage parameter due to its low installed capacity. In contrast, the voltage unbalance is widely affected by the BESS and EV because they are connected in a two-phase manner in some network nodes. The power factor and harmonic distortion parameters exhibit a particular behavior; few studies have used the probabilistic approach. PVS affect the total harmonic distortion behavior the most. EVs have the most significant effect on the power factor.
Inferential statistics allow us to infer whether there is a statistical difference between the two-sample means, making it a simple and compact tool. The heat maps condensed information concerning inferential statistics and showed the most representative impacts of the DER. This study represents a step toward a better understanding of the impact of DER integration on distribution networks. The proposed procedure can help future researchers improve DER modelling and appropriation of topics such as co-simulation and impact estimation with indicators and inferential statistics.
5. ACKNOWLEDGEMENT AND FUNDING
The authors wish to thank the Department of Electrical, Electronics, and Telecommunications Engineering, the Vice-Rectorate for Research and Extension from the Universidad Industrial de Santander (Project 8593), and the Minister of Science, Technology, and Innovation (Project – Contract No. 80740-191-2019 – Funding Resource). In addition, we thank the ElaadNL lab for supplying the Nissan Leaf charging data.
CONFLICTS OF INTEREST
The authors declare that there is no conflict of interest.
AUTHOR CONTRIBUTIONS
Juan Caballero-Peña: Conceptualization; Methodology; Software; Validation; Formal analysis; Investigation; Data Curation; Writing - Original Draft; Visualization.
German Osma-Pinto: Methodology; Validation; Formal analysis; Investigation; Resources; Writing - Review & Editing; Supervision; Project administration; Funding acquisition.
6. REFERENCES
- arrow_upward [1] N. T. Mbungu, R. M. Naidoo, R. C. Bansal, M. W. Siti, and D. H. Tungadio, “An overview of renewable energy resources and grid integration for commercial building applications,” J. Energy Storage, vol. 29, p. 101385, Jun. 2020. https://doi.org/10.1016/j.est.2020.101385
- arrow_upward [2] P. Sharma, H. D. Mathur, P. Mishra, and R. C. Bansal, “A critical and comparative review of energy management strategies for microgrids,” Appl. Energy, vol. 327, p. 120028, Dec. 2022. https://doi.org/10.1016/j.apenergy.2022.120028
- arrow_upward [3] Y. Liu, and L. Wu, “Integrating Distributed Energy Resources into the Independent System Operators’ Energy Market: A Review,” Current Sustainable/Renewable Energy Reports, vol. 8, pp. 233–241, Aug. 2021. https://doi.org/10.1007/s40518-021-00190-8
- arrow_upward [4] M. Kumar, “Social, Economic, and Environmental Impacts of Renewable Energy Resources,” in Wind Solar Hybrid Renwable Energy System, London, UK: IntechOpen, 2020, pp. 227–235. https://doi.org/10.5772/intechopen.89494
- arrow_upward [5] J. Caballero-Peña, C. Cadena-Zarate, A. Parrado-Duque, and G. Osma-Pinto, “Distributed energy resources on distribution networks: A systematic review of modelling, simulation, metrics, and impacts,” International Journal of Electrical Power and Energy Systems, vol. 138, p. 107900, Jun. 2022. https://doi.org/10.1016/j.ijepes.2021.107900
- arrow_upward [6] A. J. Veldhuis, M. Leach, and A. Yang, “The impact of increased decentralised generation on the reliability of an existing electricity network,” Appl. Energy, vol. 215, pp. 479–502, Apr. 2018. https://doi.org/10.1016/j.apenergy.2018.02.009
- arrow_upward [7] T. Senjyu, and A. M. Howlader, “Operational aspects of distribution systems with massive DER penetrations,” in Integration of Distributed Energy Resources in Power Systems, Elsevier, 2016, pp. 51–76. https://doi.org/10.1016/B978-0-12-803212-1.00003-9
- arrow_upward [8] J. H. R. Enslin, and P. J. M Heskes, “Harmonic-interaction between a large number of distributed power inverters and the distribution network,” IEEE Trans. Power Electron., vol. 19, no. 6, pp. 1586–1593, Nov. 2004. https://doi.org/10.1109/TPEL.2004.836615
- arrow_upward [9] A. Arguello, J. D. Lara, J. D. Rojas, and G. Valverde, “Impact of Rooftop PV Integration in Distribution Systems Considering Socioeconomic Factors,” IEEE Syst. J., vol. 12, no. 4, pp. 3531–3542, Dec. 2018. https://doi.org/10.1109/JSYST.2017.2739022
- arrow_upward [10] I. C. Barutcu, E. Karatepe, and M. Boztepe, “Impact of harmonic limits on PV penetration levels in unbalanced distribution networks considering load and irradiance uncertainty,” International Journal of Electrical Power and Energy Systems, vol. 118, p. 105780, Jun. 2020. https://doi.org/10.1016/j.ijepes.2019.105780
- arrow_upward [11] Y. Yu et al., “Data-Driven Study of Low Voltage Distribution Grid Behaviour with Increasing Electric Vehicle Penetration,” IEEE Access, vol. 10, pp. 6053–6070, Jan. 2022. https://doi.org/10.1109/ACCESS.2021.3140162
- arrow_upward [12] M. N. Iqbal, L. Kütt, K. Daniel, B. Asad, and P. S. Ghahfarokhi, “Estimation of harmonic emission of electric vehicles and their impact on low voltage residential network,” Sustainability, vol. 13, no. 15, p. 8551, Jul. 2021. https://doi.org/10.3390/su13158551
- arrow_upward [13] S. Choudhury, “Review of energy storage system technologies integration to microgrid: Types, control strategies, issues, and future prospects,” Journal of Energy Storage, vol. 48, p. 103966, Apr. 2022. https://doi.org/10.1016/j.est.2022.103966
- arrow_upward [14] M. T. Tolmasquim, P. M. A. Senra, A. R. Gouvêa, A. O. Pereira Jr, A. C. Alves, and M. Moszkowicz, “Strategies of electricity distributors in the context of distributed energy resources diffusion,” Environ Impact Assess Rev., vol. 84, p. 106429, Sep. 2020. https://doi.org/10.1016/j.eiar.2020.106429
- arrow_upward [15] 1547-2018 - IEEE Standard for Interconnection and Interoperability of Distributed Energy Resources with Associated Electric Power Systems Interfaces, IEEE, Piscataway, NJ, USA, 2018. https://doi.org/10.1109/IEEESTD.2018.8332112
- arrow_upward [16] J. L. Moreira Pereira, A. F. Raiol Leal, G. Oliveira de Almeida, and M. E. de L. Tostes, “Harmonic effects due to the high penetration of photovoltaic generation into a distribution system,” Energies, vol. 14, no. 13, p. 4021, Jul. 2021. https://doi.org/10.3390/en14134021
- arrow_upward [17] M. Ahmed, Nahid-Al-Masood, and S. R. Deeba, “Impact of integrating battery energy storage system on harmonic distortion in an industrial microgrid,” in 2020 International Conference on Smart Grids and Energy Systems (SGES), Perth, Australia, 2020, pp. 712–717. https://doi.org/10.1109/SGES51519.2020.00132
- arrow_upward [18] U. H. Ramadhani, R. Fachrizal, M. Shepero, J. Munkhammar, and J. Widén, “Probabilistic load flow analysis of electric vehicle smart charging in unbalanced LV distribution systems with residential photovoltaic generation,” Sustain. Cities and Soc., vol. 72, p. 103043, Sep. 2021. https://doi.org/10.1016/j.scs.2021.103043
- arrow_upward [19] M. Al-Saadi et al., “Impact on the Power Grid Caused via Ultra-Fast Charging Technologies of the Electric Buses Fleet,” Energies, vol. 15, no. 4, p. 1424, Feb. 2022. https://doi.org/10.3390/en15041424
- arrow_upward [20] B. R. Prusty, and D. Jena, “A critical review on probabilistic load flow studies in uncertainty constrained power systems with photovoltaic generation and a new approach,” Renewable and Sustainable Energy Reviews, vol. 69, pp. 1286–1302, Mar. 2017. https://doi.org/10.1016/j.rser.2016.12.044
- arrow_upward [21] A. Martínez-Peñaloza, and G. Osma-Pinto, “Analysis of the performance of the norton equivalent model of a photovoltaic system under different operating scenarios,” International Review of Electrical Engineering, vol. 16, no. 4, pp. 328–343, 2021. https://doi.org/10.15866/iree.v16i4.20278
- arrow_upward [22] J. H. Angelim, and C. de M. Affonso, “Probabilistic assessment of voltage quality on solar-powered electric vehicle charging station,” Electric Power Systems Research, vol. 189, p. 106655, Dec. 2020. https://doi.org/10.1016/j.epsr.2020.106655
- arrow_upward [23] L. M. Caro, G. Ramos, K. Rauma, D. F. C. Rodriguez, D. M. Martinez and C. Rehtanz, "State of Charge Influence on the Harmonic Distortion from Electric Vehicle Charging," IEEE Transactions on Industry Applications, vol. 57, no. 3, pp. 2077-2088, May-Jun. 2021. https://doi.org/10.1109/TIA.2021.3057350
- arrow_upward [24] F. E. Postigo Marcos et al., “A review of power distribution test feeders in the United States and the need for synthetic representative networks,” Energies, vol. 10, no. 11, p. 1896, Nov. 2017. https://doi.org/10.3390/en10111896
- arrow_upward [25] K. P. Schneider et al., “Analytic Considerations and Design Basis for the IEEE Distribution Test Feeders,” IEEE Transactions on Power Systems, vol. 33, no. 3, pp. 3181–3188, May. 2018. https://doi.org/10.1109/TPWRS.2017.2760011
- arrow_upward [26] A. J. O. Owuor, J. L. Munda, and A. A. Jimoh, “The IEEE 34 node radial test feeder as a simulation testbench for distributed generation,” in IEEE AFRICON Conference, Victoria Falls, Zambia, 2011, pp. 1-6. https://doi.org/10.1109/AFRCON.2011.6072095
- arrow_upward [27] L. F. Buitrago Arroyave, and J. M. López Lezama, “Valoración de los impactos técnicos de la generación distribuida en sistemas de energía eléctrica,” Tecnura, vol. 17, no. 36, pp. 50–60, Apr-Jun. 2013. https://www.redalyc.org/articulo.oa?id=257028093005
- arrow_upward [28] M. Karimi, H. Mokhlis, K. Naidu, S. Uddin, and A. H. A. Bakar, “Photovoltaic penetration issues and impacts in distribution network – A review,” Renewable and Sustainable Energy Reviews, vol. 53, pp. 594–605, Jan. 2016. https://doi.org/10.1016/j.rser.2015.08.042
- arrow_upward [29] V. Ignatova, D. Villard, and J. M. Hypolite, “Simple indicators for an effective Power Quality monitoring and analysis,” in 2015 IEEE 15th International Conference on Environment and Electrical Engineering (EEEIC), Rome, Italy, 2015, pp. 1104-1108.https://doi.org/10.1109/EEEIC.2015.7165321
- arrow_upward [30] I. Daut, S. Hasan, and S. Taib, “Magnetizing Current, Harmonic Content and Power Factor as the Indicators of Transformer Core Saturation,” Journal of Clean Energy Technologies, vol. 1 no. 4. pp. 304–307, Oct. 2013. https://doi.org/10.7763/jocet.2013.v1.69
- arrow_upward [31] E. Mancini, M. Longo, W. Yaici, and D. Zaninelli, “Assessment of the Impact of Electric Vehicles on the Design and Effectiveness of Electric Distribution Grid with Distributed Generation,” Applied Sciences, vol. 10, no. 15, p.5125, Jul. 2020. https://doi.org/10.3390/app10155125
- arrow_upward [32] G. Osma-Pinto, M. García-Rodríguez, J. Moreno-Vargas, and C. Duarte-Gualdrón, “Impact evaluation of grid-connected PV systems on PQ parameters by comparative analysis based on inferential statistics,” Energies, vol. 13, no. 7, p. 1668, Apr. 2020. https://doi.org/10.3390/en13071668