Machine Learning Model for Primary Solar Resource Assessment in Colombia
Modelo de aprendizaje automático para la evaluación del recurso solar primario en Colombia
 PDF
PDF
Received: July 7, 2023
Accepted: December 22, 2023
Available: December 29, 2023
E. D. Obando Paredes, “Machine Learning Model for Primary Solar Resource Assessment in Colombia,” TecnoLógicas, vol. 26, nro. 58, e2789, 2023 . https://doi.org/10.22430/22565337.2789
Highlights
Highlights
Abstract
This work introduces a Machine Learning (ML) model designed to predict solar radiation in diverse cities representing Colombia's climatic variability. It is crucial to assert that the amount of solar energy received in a specific region is directly related to solar radiation and its availability, which is influenced by each area's particular climatic and geographic conditions. Due to the high variability and resulting uncertainty, various approaches have been explored, including the use of numerical models to estimate solar radiation. The primary objective of this study was to develop and validate an ML model that accurately predicts solar radiation in cities. The methodology employed was specific to data treatment and ML model development. It was structured into three fundamental stages: clustering, estimation, and response, considering that the model is based on historical data. The obtained results were assessed using appropriate statistical definitions, not only determining the model's efficiency in terms of prediction but also considering interactions between data for the approximation and prediction of solar radiation. In this context, it is crucial to emphasize that the research contributes to understanding solar radiation in Colombia. This study underscores the importance of developing ML models to predict solar radiation, emphasizing the need to consider the country's climatic diversity. The results obtained, following the model's application, provide valuable information for comprehending and anticipating the availability of this primary resource.
Keywords: Machine learning, renewable energy, predictive model, climate prediction, solar radiation.
Resumen
En este trabajo se presenta un modelo de Aprendizaje Automático (ML por sus siglas en inglés) diseñado para predecir la radiación solar en diversas ciudades que representan la variabilidad climática de Colombia. Destaca afirmar, que la cantidad de energía solar recibida en una región específica está directamente relacionada con la radiación solar y su disponibilidad, la cual se ve afectada por las condiciones climáticas y geográficas particulares de cada área. Ante la alta variabilidad e incertidumbre resultante, se han explorado diversos enfoques, entre ellos, el uso de modelos numéricos para estimar la radiación solar. El objetivo principal de este estudio fue desarrollar y validar un modelo ML que permita predecir con precisión la radiación solar en las ciudades. La metodología empleada fue propia del tratamiento de datos y desarrollo de modelos ML. Se estructuró en tres etapas fundamentales: agrupamiento, estimación y respuesta, al tener en cuenta que el modelo está estructurado con base en datos históricos. Los resultados obtenidos fueron evaluados mediante definiciones estadísticas apropiadas, que no solo determinaron la eficiencia del modelo en términos de predicción, sino que también consideraron las interacciones entre datos para la aproximación y predicción de la radiación solar. En este sentido, es crucial señalar que la investigación contribuye al entendimiento de la radiación solar en el contexto colombiano. Este estudio subraya la importancia de desarrollar modelos ML para predecir la radiación solar, destacando la necesidad de considerar la diversidad climática del país. Los resultados obtenidos, tras la aplicación del modelo, proporcionan información valiosa para comprender y anticipar la disponibilidad de este recurso primario.
Palabras clave: Aprendizaje automático, energía renovable, modelo predictivo, predicción climática, radiación solar.
1. INTRODUCTION
Addressing the uncertainties associated with solar radiation becomes imperative with the increasing demand for sustainable and renewable energy sources. These uncertainties arise due to weather patterns, seasonal changes, and geographical diversity variations. Consequently, accurately predicting solar radiation becomes crucial for efficiently planning and optimizing electricity generation systems. Researchers have turned to advanced computational models and Machine-Learning techniques to tackle this issue. These models leverage historical and real-time data to develop predictive algorithms capable of estimating solar radiation levels with high accuracy. By considering factors such as geographical location, weather patterns, and historical solar radiation data, these models help optimize the planning and operation of solar power systems, thereby maximizing their efficiency and output. Thus, less uncertainty of the power produced by variable renewable sources can lead to optimal planning that directly impacts the end user [
In Colombia, the utilization of non-conventional renewable energy sources utilizing variable primary resources is still in its early development. While the majority of energy generation in the Colombian energy matrix comes from renewable sources, with hydroelectric generation contributing 70 % to the National Electric Interconnected System, the hydroelectric sector in Colombia exhibits vulnerabilities. The nation is confronted with the risk of electricity rationing due to factors like climate change and El Niño, as observed in past years, including 1992, 1995, 2005, and 2015 [
This situation highlights the need to diversify the energy matrix and strengthen the integration of other renewable energy sources, especially those that do not depend directly on climatic conditions. The lack of rain affects the availability of water resources for hydroelectric generation, emphasizing the importance of exploring and developing technologies that use more stable renewable energy sources, such as solar, wind, or biomass energy [
Numerical models are employed in the first stages of predicting and estimating solar radiation. These models, characterized by a deterministic framework, establish relationships through coefficients linking extraterrestrial radiation to ground-level measurements [
As an example, in [
For Machine Learning (ML) applications in primary solar resource prediction, the number of stages changes. Due to climate variability and the dependence on climate data radiation, a classification stage is presented before clustering [
The article's structure is as follows: Section 2 shows the materials and methods used in the model's design, section 3 explains the ML model, section 4 shows the results and discussion of the model in its application to Colombian data, and Section 5 presents the conclusions.
2. MATERIALS AND METHODS
2.1 Criteria for the design of the model
In [
Furthermore, when utilizing a Machine Learning model, the following aspects are taken into consideration:
Table 1 displays the most used simple predictors for predicting the primary solar resource. These predictors are compared based on their performance in handling highly nonlinear data, utilization of multiple inputs, lower uncertainty in outcomes, flexibility in input changes, and deviation exhibited compared to their counterparts. Additionally, the prediction horizon, defined as the future time for which the prediction will be made, is taken into consideration [
| Technique | Treatment of non-linearity | Behavior when using multiple inputs | Error | Flexibility of the model | Forecast Horizon | |||||||||||||||||||||||||||||||||||||||||
| BG | Variable | |||||||||||||||||||||||||||||||||||||||||||||
| SVM, | Variable | |||||||||||||||||||||||||||||||||||||||||||||
| Fuzzy | Daily | |||||||||||||||||||||||||||||||||||||||||||||
| k-NN | Daily | |||||||||||||||||||||||||||||||||||||||||||||
| Integrated Self-Regressive Mobile Media Model (ARIMA) | Variable | |||||||||||||||||||||||||||||||||||||||||||||
| Decision trees | Time | |||||||||||||||||||||||||||||||||||||||||||||
| K-means | Time | |||||||||||||||||||||||||||||||||||||||||||||
If the aim is to maximize the strengths of the techniques at different stages of the model, a hybrid-type topology is proposed to achieve higher efficiency and accuracy in solar resource prediction. This topology, depicted in Figure 1, is based on the combination of two or more simple predictors. By integrating multiple predictors, a more comprehensive and precise understanding of the variables involved in the prediction can be obtained, overcoming individual limitations of each predictor, and enhancing the quality of predictions.
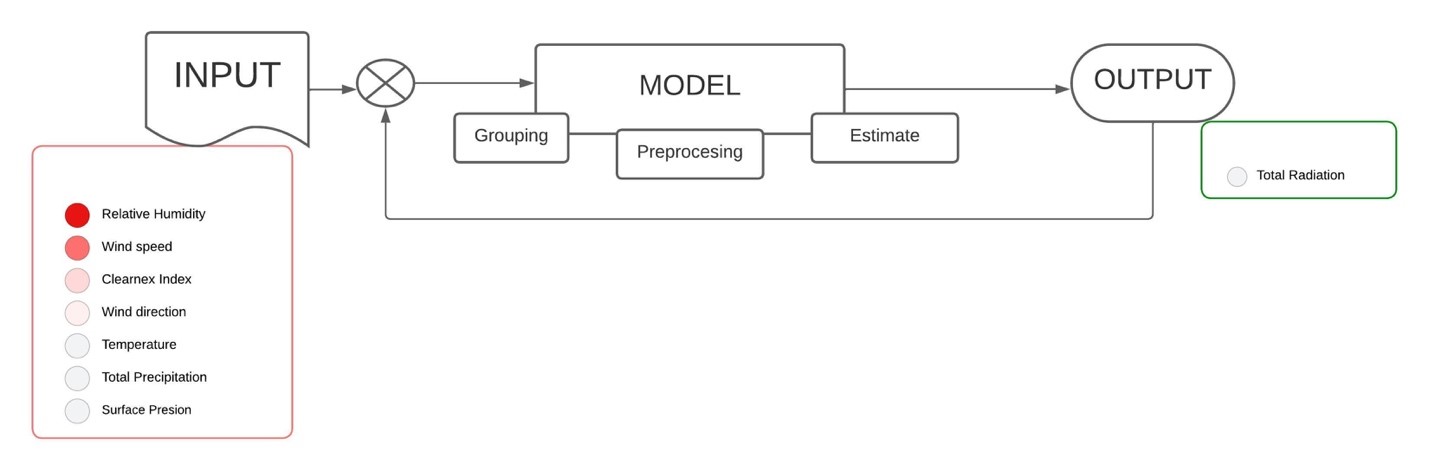
The hybrid topology leverages the strengths of each predictor, whether it be in handling nonlinear data, utilizing multiple inputs, reducing uncertainty in outcomes, or providing flexibility in input changes. By combining these strengths, a more robust and reliable approach for solar resource prediction is achieved. Furthermore, the hybrid topology considers the importance of the prediction horizon, which refers to the future time period for which the prediction will be made. This allows the model to be adapted to different needs and scenarios, offering the ability to make short, medium, and long-term predictions [
2.2 Database input in the development of the model
The above considerations are considered because each geographic location has a unique solar resource profile that varies continuously depending on the time, day, season, and year. In addition, radiation depends on other climatic parameters, which make it highly variable and with a high non-linearity profile [
In these Units, the variability of primary resources represents the greatest uncertainty in the assessment of future performance in a photovoltaic power plant. To try to minimize these effects, three aspects that relate solar resource data should be considered in the modeling and planning process of a solar project [
- Primary resource data with a 10-year history for site selection during feasibility studies.
- Quantification of the power generated by the plant, value used in the design and subsequently in economic studies of the plant.
- Real-time measurement and prediction of the operation of the isolated photovoltaic system and the grid.
A summary of the requirements that the database must meet according to the application scenario is shown in Table 2.
| Requirement / Application | Academic | Political | Potential information | Business |
| The data set must be validated by geographic measurements on site and have public information and documentation | X | X | X | X |
| The dataset is validated independently, or its validation is based on an available protocol. | N/A | X | X | X |
| Resolution of 10x10km or better | N/A | X | X | X |
| History of 10 years or more | N/A | N/A | X | X |
The chosen database is the PowerViewer database provided by the National Aeronautics and Space Administration (NASA). While its spatial resolution falls short of 10 x 10 km, the data undergo a validation process through soil measurements, and there is extensive documentation available detailing its development.
3. DEVELOPMENT OF THE MODEL
3.1 General in the development of the model
The proposed model is shown in Figure 2.Consists of three stages. In the first stage, a fuzzy algorithm is employed to group and classify the input variables based on the high variability of climate data in the Colombian climate. This algorithm allows for more precise classification by defining linguistic variables and conditional "if-then" rules. These linguistic variables, such as cloudy, rainy, and sunny, capture the different weather conditions. The conditional rules are used to establish relationships between the climate data and the clarity index, which serves as a precursor to incident solar radiation.
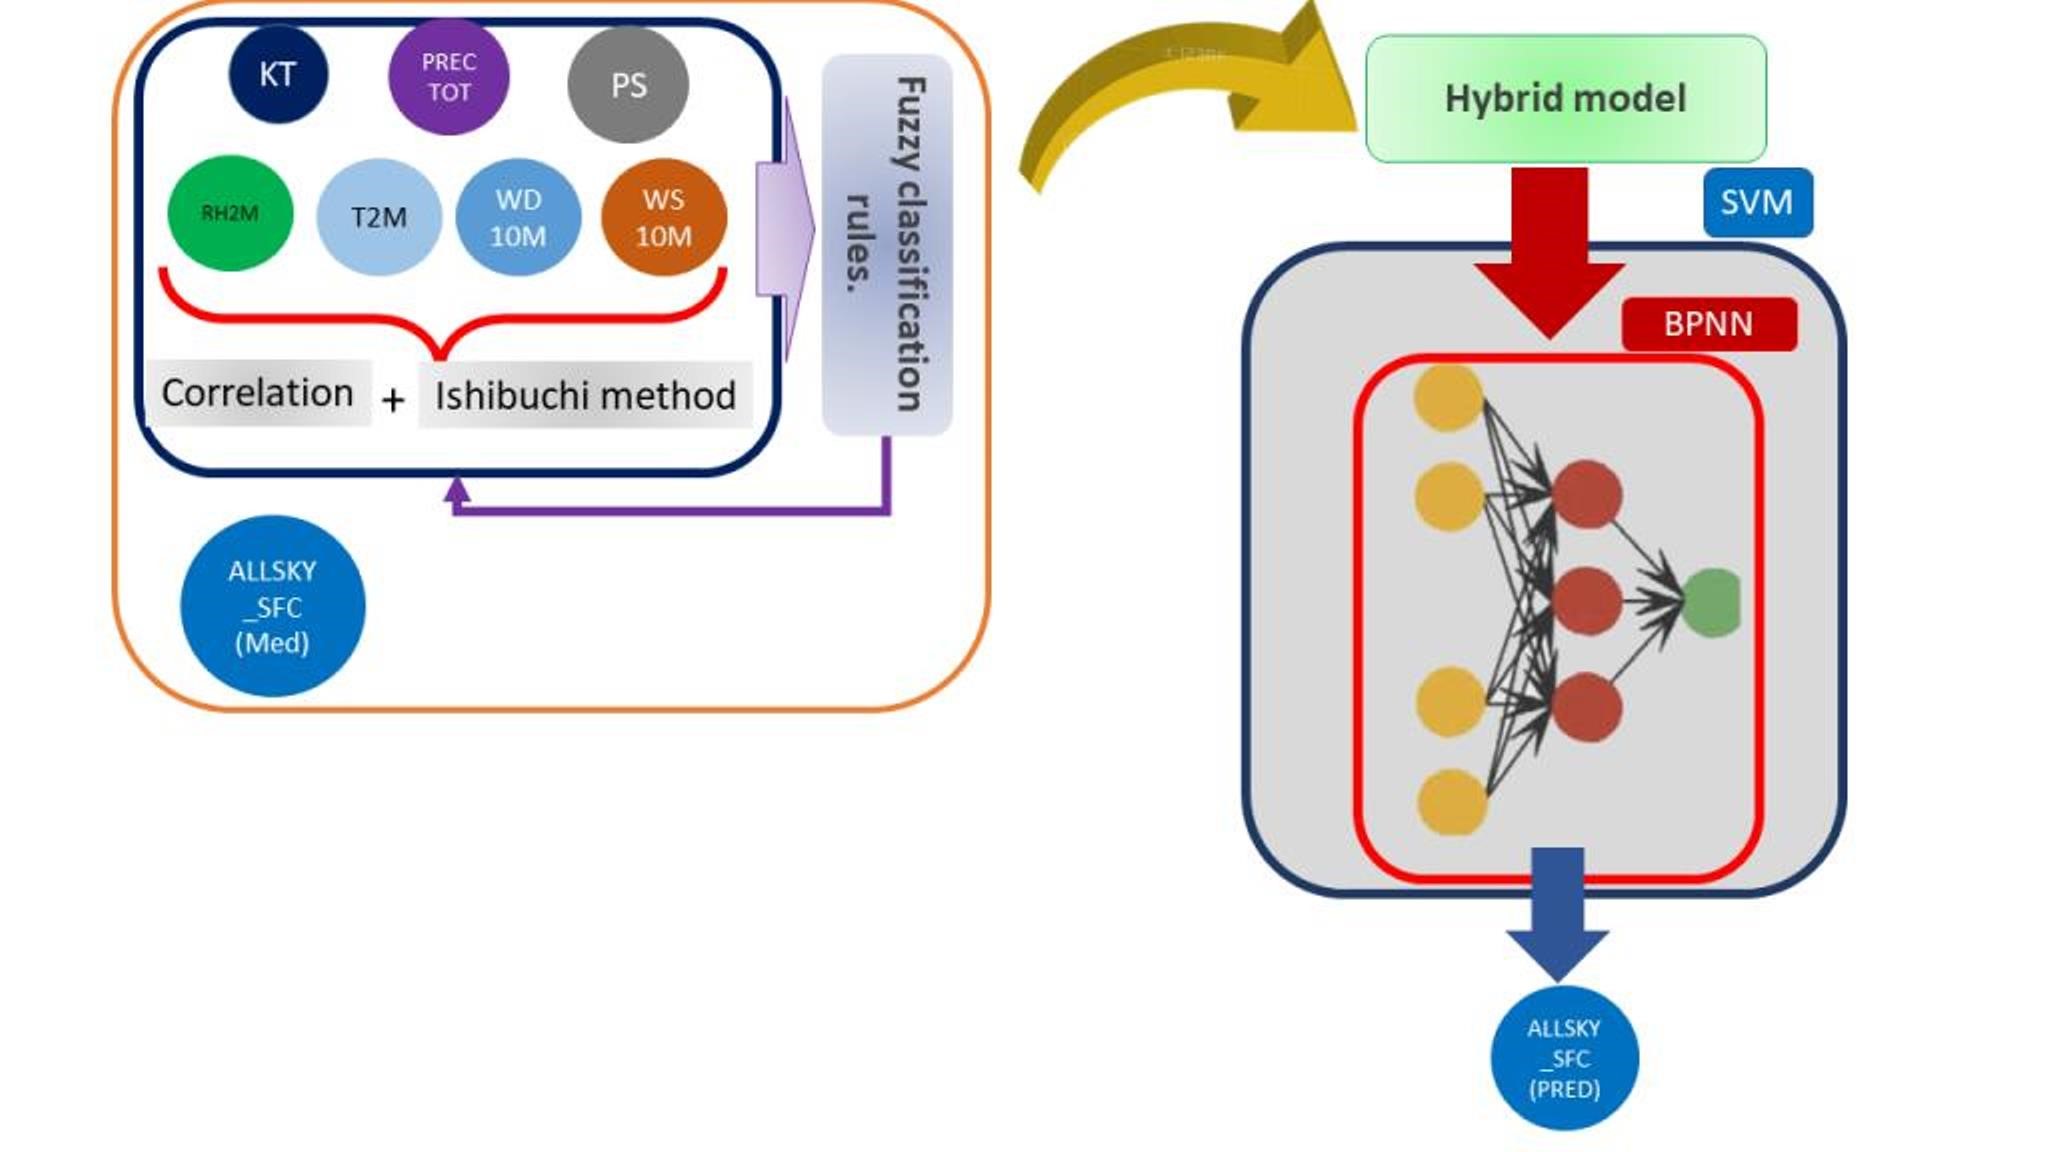
Preprocessing and grouping: Fuzzy Logic is opted for this phase due to its adeptness in uncovering patterns within data, handling multiple inputs efficiently, and classifying climate information and ground data across diverse weather conditions—sunny, cloudy, and rainy, along with their various combinations [
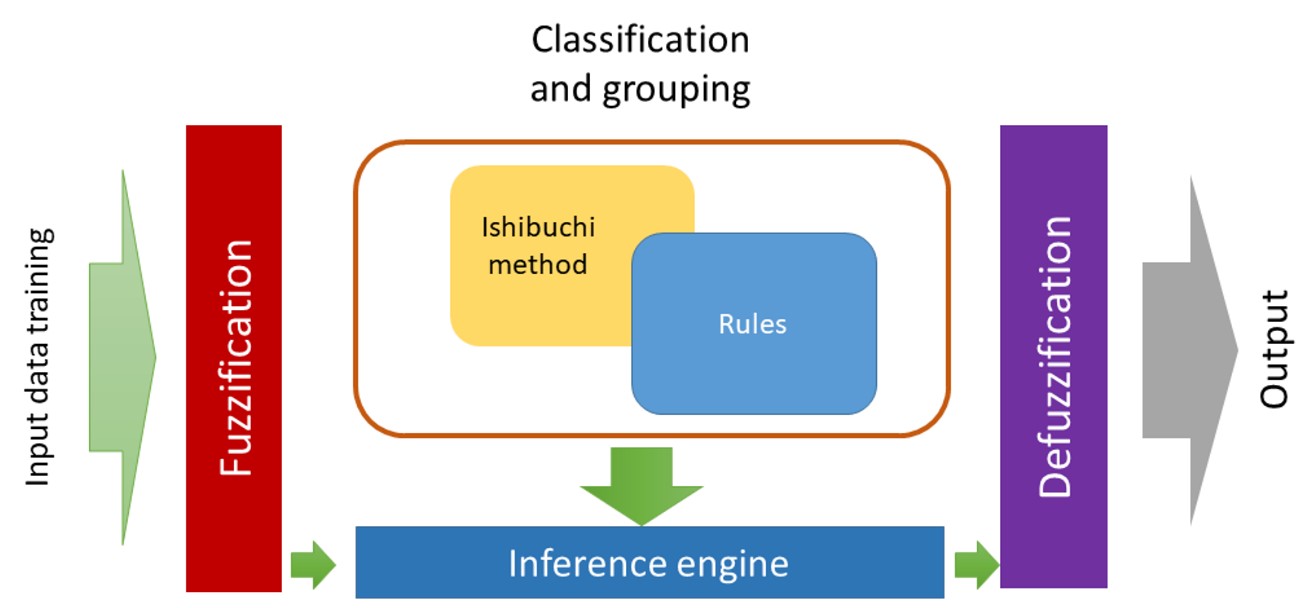
Estimation: For this stage, the predictive models considered are NN (Neural Network) and SVM (Support Vector Machine), employed in tandem. Both models exhibit the capability to capture the inherent high linearity of radiation while maintaining a low prognostic error. The flexibility inherent in the combined approach allows for the integration of geographical considerations, including latitude and longitude, into the model. In the case of NN, its ability to handle more than three variables in the input is essential; it identifies relationships between climate data and geographical location, subsequently injecting that profile into SVM, which serves as the primary resource predictor. The necessary membership functions are generated where the values will be classified as they enter the model, and the rules will be changed according to the new data entries. Figure 3 illustrates the Fuzzy classifier components used in the model [
The fuzzy approach is particularly suitable for the Colombian climate, which exhibits significant climate variations across different regions of the country. By incorporating fuzzy logic, the model can effectively handle the inherent uncertainty and imprecision in climate data, thus improving the accuracy of solar resource predictions. The utilization of the clarity index as a key predictor in the model is essential as it provides an indirect measure of incident solar radiation. The conditional rules enable the capture of complex relationships between the climate data and the clarity index, adapting to the specific climate patterns of Colombia.
The performance of this technique relies on an important parameter known as the kernel function, which serves as the core component of the SVM model. The kernel is a characteristic feature of SVMs that enables the mapping of variables from a lower-dimensional space to a higher-dimensional one. In the ongoing model development, the chosen kernel is the NN with a geographic component.
According to the theory, if a projection is used Ø: ꭕ →H. Where ꭕ is the input data vector and H the Hyperplane of Separation. The Internal Product of points ⟨𝛷(𝑥)|𝛷(𝑥′)⟩ It can be represented by a kernel function 𝑘 , as shown in ( 1 ).
 (1)
(1)
This nonlinear kernel plays a crucial role in expanding the input dimensions of the predictor through matrix-based vector data, facilitating effective separation and accurate prediction of the primary resource. The objective of the NN is to incorporate additional geographic features, such as latitude and longitude, which exhibit significant correlations with the measured climatic data. Figure depicts this critical stage of the model where the SVM is effectively utilized. Figure 4 depicts the components of the primary predictor and the data inputs.
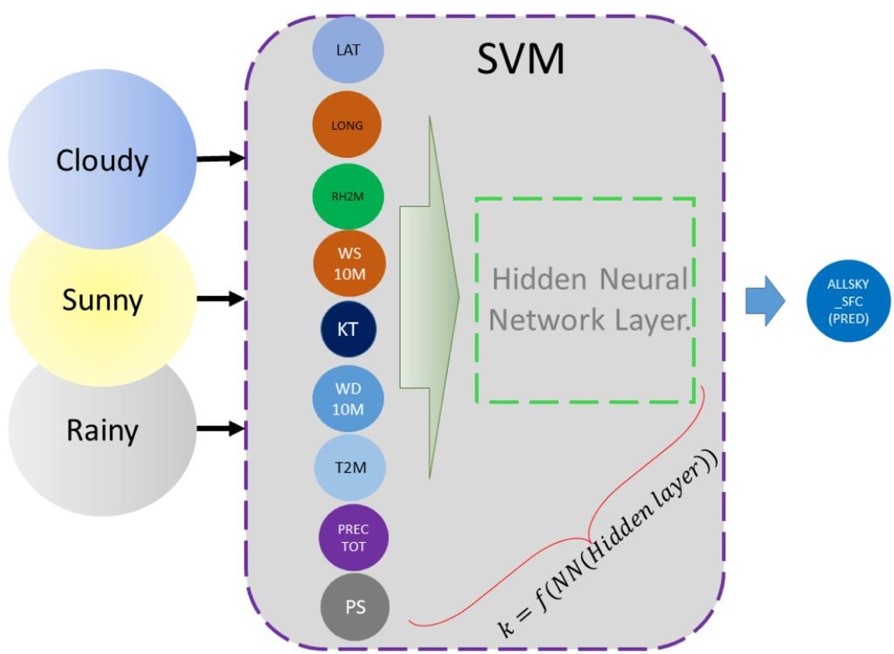
As shown in Figure 4, once the function type of the NN core has been established, it is possible to work in spaces of any dimension without redoing the characterization process. This is based on the ability of NNs to capture multiple inputs that could be applied directly to other data without the need for a feature extraction process. A powerful combination of techniques is employed for the prediction stage: Neural Networks (NN) and Support Vector Machines (SVM). Initially, SVM was used primarily as a classifier, but its current trend is to utilize it as a predictor due to its generalization capabilities. In this research work, the focus has been on developing this technique, leveraging its strong adaptability to the data. Furthermore, it is worth noting that its widespread usage as a predictor for primary resources has been extensively documented in the literature [
4. RESULTS AND DISCUSSION
4.1 Behavior of the model
Thanks to its privileged geographical position, Colombia stands out for its incredible climatic diversity and thermal floors, ranging from coastal areas to snow-capped peaks. This climatic variability poses a challenge for accurate solar resource prediction, as it requires a model capable of capturing the non-linearities and peculiarities of each region.
In this research work, selected five cities representing different climatic regions in Colombia will serve as scenarios to simulate and exemplify the performance of the proposed model. The PowerData climate database will be used with databases from six cities in mountainous regions, lush jungles, vast plains, and the stunning Pacific and Atlantic coasts. This combination of geographically diverse data sources ensures a robust representation of the country's climatic variability.
Table 3 complements this research by providing detailed geographical information about each of the selected regions. This information includes locations, altitudes, geographical features, and other relevant data essential for understanding each city's climatic context and its impact on solar resource prediction.
When changing the geographical location, weather data and daily profiles are altered. The model needs to capture this geographic-climatic variability and provide accurate predictions of the primary resource. In the mentioned regions, we have 3965 observations representing the daily average of climate data collected over a period of more than ten years, from 01/01/2009 to 31/07/2022. Approximately 70 % of these data (2700) are used for training the model, while the remaining 30 % (1265) is reserved for testing in all cities. Figure 5 shows that 40 % of the training data is allocated to train the fuzzy algorithm, and 60 % is allocated to the neural network (NN). On the x-axis, the time interval for each variable measurement is displayed, and on the y-axis, the normalized magnitude of each variable is shown. This combination of approaches allows us to leverage the strengths of both methods and better understand the variability of the solar resources in each region. The jungle region exhibits a lower average primary resource value than other cities. This is due to an extended rainy season lasting 5 to 6 months per year. Additionally, despite being coastal regions of the Pacific and Atlantic, there are significant differences due to the influence of the Humboldt current and the cold currents that traverse the Pacific coast [
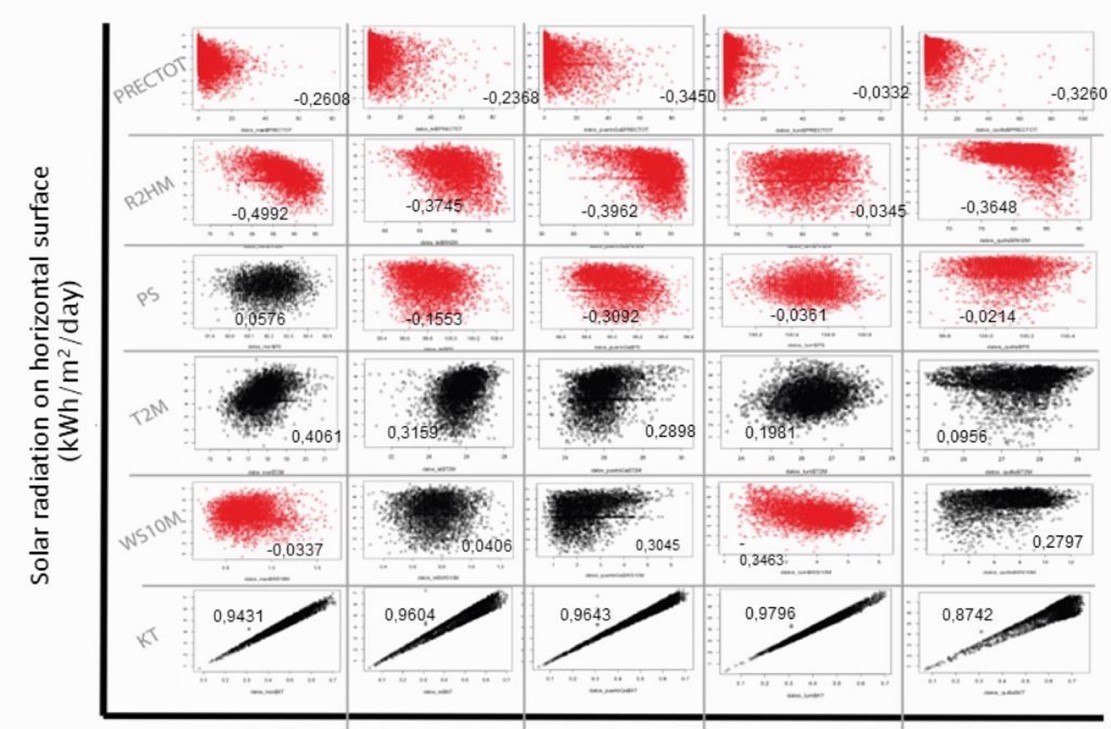
The climatic profiles of the jungle, plains, and the Atlantic coast reveal similarities in evaluating the correlation between humidity and incident radiation, which is notable in these regions. Specifically, a similar profile is observed for the humidity variable across all three types of geography. However, due to the variability of the profile in each city, it is not possible to draw definitive conclusions about the behavior of the other variables. This aspect is addressed by using fuzzy rules, which allow us to infer the type of day based on climatic data, rather than relying solely on the correlation coefficient associated with the city under study. It is worth noting that Figure 5 shows the presence of climatic variables with a positive correlation, such as the Clarity Index and the temperature at two meters, in all cities. A more pronounced correlation is observed for the Clarity Index compared to temperature.
In the mountain climate and on the Pacific coast, unlike other regions, there is an inverse relationship between wind speed and radiation. In the first city, this is due to the movement of cloud masses formed in the mountain range, which are carried by the wind and affect the incident radiation in the city. In the second city, this inverse relationship is due to the flow of sea currents coming from the south of the continent, leading to a higher air mass coefficient (AM) that disperses radiation across different wavelengths. For other variables, the coefficient varies, preventing adequate generalizations for the model and inferring the type of day.
4.2 Model simulation scenarios
A solar radiation prediction model based on ML is designed. It has the following attributes:
The ML hybrid prediction model is successfully implemented in the mentioned 5 cities. This revolutionary model intelligently combines the power of the fuzzy classifier, neural network, and support vector machine. To ensure accuracy and avoid excessive adjustments, extensive work has been done on the dataset, preventing the generation of unwanted trends. In this crucial stage, incident radiation on a horizontal surface is excluded, and the focus is on classifying the day based on the clarity index. To achieve this, the acclaimed Ishibashi method (FRBCS. W) is implemented in the fuzzy stage of the model. This approach, based on spatial divisions, allows for exceptional results and a deep understanding of climatic patterns.
The dataset is carefully divided into training and testing stages, utilizing 85 % of the data for training and the remaining 15 % for testing. During the process, equal fuzzy regions are created for the input variables (training) and output (clarity index), enabling precise and reliable formation of the distinct regions of rain, cloudy, and sunny.
Furthermore, the nonlinear core of the model plays a crucial role in generating meaningful variables. This core is achieved by including a hyperplane that separates the input values and harnessing the power of the inner product between the support vectors. This advanced approach ensures higher prediction accuracy and a deeper understanding of the factors influencing the clarity index.
Table 4 shows the parameters of the SVM regression model. The error penalty tolerance value, which depends on the core function to pass or not a value with an error level. This value changes in all cities, but in the Pacific region it reaches its highest value because the model fails to fully capture the climate profile of the city. Therefore, a profile with higher error should be allowed. The support vector machine relates the day types to the other climate data. When considering a nonlinear hyperplane of data separation, it is possible that the model captures the geographical variations of the Colombian climate and gives a predictive response one day to the future as a prediction horizon.
| Regions | Parameter | ||||
| ε | Support Vectors | Value Goal Role | Training Software | ||
| Mountain | 0.3 | 1770 | -367.481 | 0.1133 | |
| Plain | 0.2 | 1439 | -463.437 | 3014 | |
| Jungle | 0.17 | 1646 | -233.756 | 0.0472 | |
| Pacific Coast | 0.5 | 1553 | -1005.469 | 10.61 | |
| Atlantic Coast | 0.21 | 2215 | -743.441 | 0.2165 | |
The values of the objective function are highly variable due to the divergences between the vectors that support the hyperplane in each city, determined by the geographical nucleus. It is particularly noteworthy that the Pacific coast region has the lowest value of this function, which is associated with a significant error in the predictions. This suggests that the model fails to capture the complex climate variations in this region adequately. It is important to note that while two model runs do not yield the same results, a consistent trend of values by region is observed. This variability is attributed to the nonlinear stage of the neural network and the calculation of the inner product in the SVM predictor, which introduce some uncertainty in the results.
The divergence in the values of the objective function between regions can be attributed to multiple factors, such as the specific geographic and climatic variability of each area. Atmospheric conditions, topography, and other geographical elements influence the measurements and the relationship between climatic variables. Therefore, it is essential to consider these differences when interpreting the results and applying the model in different geographic regions.
4.3 Discussion
The results presented in the previous section have two important interpretations. From a statistical perspective and data usage, the model is observed to be robust and exhibits good performance. There is no evidence of systematic errors in the data, and the selected predictors fulfill their objective. It is worth noting that the weaknesses of the model are attributed more to geographical factors than to issues with data processing or model stages. The use of diverse climatic data from heterogeneous regions is beneficial as it avoids biased approaches based on a single dataset. Furthermore, the hybridization of predictors, particularly the combination of neural networks (NN) and support vector machines (SVM), allows for handling larger datasets, achieving computational efficiency, and addressing the high non-linearity of the resource.
From the perspective of distributed generation planning, the model's results are promising. The model provides a satisfactory response by requiring low uncertainty in predicting and quantifying the primary resource for the installation of solar energy solutions. This enables the reliable projection of the amount of energy that can be installed in a distributed manner. These findings are encouraging for those involved in renewable energy generation planning, as having a reliable and accurate model is crucial for informed decision-making and maximizing the utilization of available solar resources.
The following section shows the validation of the model. This process is developed considering statistical metrics that evaluate the degree of cohesion between the data predicted by the model and the measured data.
5. MODEL VALIDATION
For this research, the following statistical type metrics are used in the validation of the model:
To validate the proposed model, the statistical metrics outlined previously, along with graphical tools, are utilized. As indicated by [
Figure 6 demonstrates the model's impressive performance in capturing the non-linearity of the primary resource, effectively managing input variables, and exhibiting flexibility when evaluated across diverse geographic locations. The fuzzy stage operates successfully in all regions, effectively classifying and providing daily profiles to the model, which are then translated into radiation values based on the specific day. In mountainous and plain regions, the radiation values tend to represent rainy and sunny days, resulting in the intermediate radiation values, which directly correlate with average radiation profiles, not being fully represented. Conversely, the Atlantic coast exhibits high radiation values, allowing the model to accurately respond to the characteristic trend of both cloudy and sunny days in this region.

Table 5 shows statistical validation metrics for the cities evaluated. The behavior of the model in cities is shown considering the statistical metrics described above: Pearson coefficient, bias, variance, covariance, MSE and RMSE.
| Natural region | r | UM | US | UC | ∑UM+US +UC |
RMSE | MSE |
| Mountain | 0.937 | 0.00781082 | 0.00677162 | 0.986269 | 1.00085235 | 0.0480485 | 0.0023086 |
| Jungle | 0.958 | 0.00708421 | 0.00214435 | 0.991624 | 1.00085297 | 0.0446628 | 0.0019947 |
| Plain | 0.963 | 0.03978723 | 0.00260174 | 0.958436 | 1.00082497 | 0.0987763 | 0.0097567 |
| Pacific Coast | 0.481 | 0.02433792 | 0.68385410 | 0.292646 | 1.00083812 | 0.7167485 | 0.5137284 |
| Atlantic Coast | 0.913 | 0.07505674 | 0.01250164 | 0.913236 | 1.00079450 | 0.0686814 | 0.0047171 |
Analyzing the correlation, the model stands out for its robustness in predicting resources in the evaluated cities, as it shows a high correlation in most of them, approaching unity. However, lower performance is observed in the Pacific coast, as indicated by the metrics. This is due to the model's inability to capture the pronounced variability of the resource in this region, which is related to the warm air currents coming from the south. Consequently, a lower correlation is obtained compared to the other cities. Regarding bias, it is evident that the value is small in all cities. This indicates the absence of systematic errors between the model and the test data, which is positive. Furthermore, it demonstrates that the prediction parameter is correctly reflected in the model, without internal issues in terms of weight calculation and trends in the different stages of the model.
The model exhibits a strong correlation in most of the evaluated cities, demonstrating a good capacity for resource prediction. Although lower performance is observed in the Pacific coast due to resource variability, the overall bias is low in all cities, supporting the validity and accuracy of the model.
6. CONCLUSIONS
In summary, the model developed in this work provides a valuable tool for quantifying and predicting the primary solar resource in Colombia, considering the country's geographical conditions. This contributes to the development and visibility of computer techniques used to support decision-making processes in the growth of Distributed Generation with photovoltaic sources.
The data sets used in this model have various applications, ranging from opening the debate on strategic-level policies to conducting market assessments. In particular, the terms "Potential" and "Business Information" are key areas where accurate indicators are needed to support decision-making. The importance of these data lies in the fact that the former activity does not consider financial commitments, while the latter considers the costs and economic and electrical effects in project development on the power grid.
Short-term machine learning techniques, such as those used in this model, are highly useful for predicting demand in very short time intervals. This enables informed decisions regarding the feasibility of photovoltaic solar generation in isolated areas or the implementation of hybrid energy systems. Additionally, machine learning can serve as an effective tool for developing demand trends by regions, facilitating geographically distributed planning of photovoltaic systems and diversifying Colombia's energy matrix.
This model offers a solid and promising perspective for managing solar resources in Colombia, providing support for strategic decision-making, and opening new opportunities in the renewable energy sector. The use of machine learning techniques and data analysis provides a strong foundation for the planning and effective implementation of solar energy solutions in the country.
7. ACKNOWLEDGMENTS AND FUNDING
The work is not the result of an economically supported project by any funding agency, organization, or institution, whether public or private.
CONFLICTS OF INTEREST
The author declares no conflicts of interest.
AUTHOR CONTRIBUTIONS
Edgar Dario Obando: Writing and translation of document and results analysis
7. REFERENCES
- arrow_upward [1] R. Kent, “Renewables”, Plast. Eng., vol. 74, no. 9, pp. 56–57, Oct. 2018. https://doi.org/10.1002/peng.20026
- arrow_upward [2] E. D. Obando, S. X. Carvajal and J. Pineda Agudelo, “Solar Radiation Prediction Using Machine Learning Techniques: A Review,” IEEE Latin America Transactions, vol. 17, no. 04, pp. 684-697, Apr. 2019. https://doi.org/10.1109/TLA.2019.8891934
- arrow_upward [3] S. Ren, Y. Hao, L. Xu, H. Wu, and N. Ba, “Digitalization and energy: How does internet development affect China’s energy consumption?,” Energy Econ., vol. 98, p.105220, Jun. 2021. https://doi.org/10.1016/j.eneco.2021.105220
- arrow_upward [4] S. Few, P. Djapic, G. Strbac, J. Nelson, and C. Candelise, “Assessing local costs and impacts of distributed solar PV using high resolution data from across Great Britain,” Renewable Energy, vol. 162, pp. 1140–1150, Dec. 2020. https://doi.org/10.1016/j.renene.2020.08.025
- arrow_upward [5] M. Alanazi, M. Mahoor, and A. Khodaei, “Co-optimization generation and transmission planning for maximizing large-scale solar PV integration,” International Journal of Electrical Power and Energy Systems, vol. 118, p. 105723, Jun. 2020. https://doi.org/10.1016/j.ijepes.2019.105723
- arrow_upward [6] G. L. Camacho et al., “Plan Energético Nacional 2020-2050,” Unidad de Planeación Minero-Energética UPME, Accessed: Jun. 22, 2023. Available:
https://www1.upme.gov.co/DemandayEficiencia/Documents/PEN_2020_2050/Plan_Energetico_Nacional_2020_2050.pdf - arrow_upward [7] A. Angstrom, “Solar and terrestrial radiation. Report to the international commission for solar research on actinometric investigations of solar and atmospheric radiation,” Q. J. R. Meteorol. Soc., vol. 50, no. 210, pp. 121–126, Apr. 1924. https://doi.org/10.1002/qj.49705021008
- arrow_upward [8] R. Aguiar and M. Collares-Pereira, “TAG: A time-dependent, autoregressive, Gaussian model for generating synthetic hourly radiation,” Sol. Energy., vol. 49, no. 3, pp. 167–174, Sep. 1992. https://doi.org/https://doi.org/10.1016/0038-092X(92)90068-L
- arrow_upward [9] R. Dogniaux and M. Lemoine, “Classification of radiation sites in terms of different indices of atmospheric transparency,” in Solar Radiation Data, Dordrecht: Springer Netherlands, 1983, pp. 94–107. https://doi.org/https://doi.org/10.1007/978-94-009-7112-7_7
- arrow_upward [10] K. K. Gopinathan, “A new model for estimating total solar radiation,” vol. 5, no. 1, pp. 107–109, 1988. https://doi.org/https://doi.org/10.1016/0741-983X(88)90096-3
- arrow_upward [11] M. R. Rietveld, “A new method for estimating the regression coefficients in the formula relating solar radiation to sunshine”, Agric. Meteorol., vol. 19, no. 2–3, pp. 243–252, Mar-Jun. 1978. https://doi.org/https://doi.org/10.1016/0002-1571(78)90014-6
- arrow_upward [12] T. Khatib, A. Mohamed, and K. Sopian, “A review of solar energy modeling techniques”, Renew. Sustain. Energy Rev., vol. 16, no. 5, pp. 2864–2869, Jun. 2012. https://doi.org/10.1016/j.rser.2012.01.064
- arrow_upward [13] L. Wang, O. Kisi, M. Zounemat-Kermani, G. A. Salazar, Z. Zhu, and W. Gong, “Solar radiation prediction using different techniques: Model evaluation and comparison,” Renewable and Sustainable Energy Reviews, vol. 61, pp. 384–397, Aug. 2016. https://doi.org/10.1016/j.rser.2016.04.024
- arrow_upward [14] M.S. Mahmodian, R. Rahmani, E.Taslimi, and S. Mekhilef, “Step By Step Analyzing, Modeling and Simulation of Single and Double Array PV system in Different Environmental Variability,” 2012 International Conference on Future Environment and Energy IPCBEE, 2012, pp. 37–42, Available: www.ipcbee.com/vol28/8-ICFEE2012-F016.pdf
- arrow_upward [15] M. Shravanth Vasisht, J. Srinivasan, and S. K. Ramasesha, “Performance of solar photovoltaic installations: Effect of seasonal variations,” Solar Energy, vol. 131, pp. 39–46, Jun. 2016. https://doi.org/10.1016/j.solener.2016.02.013
- arrow_upward [16] IRENA, “Renewable Energy Highlights,” Agencia Internacional de las Energías Renovables, Emiratos Árabes Unidos, 2022. Available: https://www.irena.org/-/media/Files/IRENA/Agency/Publication/2022/Jul/IRENA_Renewable_energy_highlights_July_2022.pdf?rev=72ddf863ab3d48108f5ee28e72cd6d25&hash=161DACCC9D1F6E486B26477E52D97ECB
- arrow_upward[17] J. A. Espinosa, S. Kaisler, F. Armour, and W. Money, “Big Data Redux: New Issues and Challenges Moving Forward,” Proceedings of the 52nd Hawaii International Conference on System Sciences, 2019. https://doi.org/10.24251/hicss.2019.131
- arrow_upward [18] X. Zheng, X. Zou, and H. Liu, “Electrical performance comparison of a rooftop photovoltaic system and an open-rack photovoltaic system,” 2017 29th Chinese Control And Decision Conference (CCDC), Chongqing, China,2017, pp. 3258-3261. https://doi.org/10.1109/CCDC.2017.7979068
- arrow_upward [19] B. Dietrich, J. Walther, M. Weigold, and E. Abele, “Machine learning based very short term load forecasting of machine tools,” Appl Energy., vol. 276, p. 115440, Oct. 2020. https://doi.org/10.1016/j.apenergy.2020.115440
- arrow_upward [20] C. L. Dewangan, S. N. Singh, and S. Chakrabarti, “Combining forecasts of day-ahead solar power,” Energy, vol. 202, p. 117743, Jul. 2020. https://doi.org/10.1016/j.energy.2020.117743
- arrow_upward [21] C. Voyant et al., “Machine learning methods for solar radiation forecasting: A review,” Renewable Energy, vol. 105. pp. 569–582, May. 2017. https://doi.org/10.1016/j.renene.2016.12.095
- arrow_upward [22] M. Diagne, M. David, P. Lauret, J. Boland, and N. Schmutz, “Review of solar irradiance forecasting methods and a proposition for small-scale insular grids”, Renew. Sustain. Energy Rev., vol. 27, pp. 65–76, Nov. 2013.https://doi.org/10.1016/j.rser.2013.06.042
- arrow_upward [23] K. Benmouiza and A. Cheknane, “Forecasting hourly global solar radiation using hybrid k -means and nonlinear autoregressive neural network models,” Energy Convers Manag., vol. 75, pp. 561–569, Nov. 2013. https://doi.org/10.1016/j.enconman.2013.07.003
- arrow_upward [24] I. A. Ibrahim and T. Khatib, “A novel hybrid model for hourly global solar radiation prediction using random forests technique and firefly algorithm,” Energy Convers Manag., vol. 138, pp. 413–425, Apr. 2017. https://doi.org/10.1016/j.enconman.2017.02.006
- arrow_upward [25] W. Ji and K. C. Chee, “Prediction of hourly solar radiation using a novel hybrid model of ARMA and TDNN,” Solar Energy, vol. 85, no. 5, pp. 808–817, May. 2011. https://doi.org/10.1016/j.solener.2011.01.013
- arrow_upward [26] J. Caballero-Peña, C. Cadena-Zarate, A. Parrado-Duque, and G. Osma-Pinto, “Distributed energy resources on distribution networks: A systematic review of modelling, simulation, metrics, and impacts,” International Journal of Electrical Power and Energy Systems, vol. 138. p. 107900, 2022. https://doi.org/10.1016/j.ijepes.2021.107900
- arrow_upward 27] M. Sengupta, A. Habte, S. Wilbert, C. Gueymard and J. Remund, “Best Practices Handbook for the Collection and Use of Solar Resource Data for Solar Energy Applications.,” 3rd Edition, Golden CO, 2021. https://www.nrel.gov/docs/fy21osti/77635.pdf
- arrow_upward [28] M. Waseem, Z. Lin, S. Liu, Z. Zhang, T. Aziz, and D. Khan, “Fuzzy compromised solution-based novel home appliances scheduling and demand response with optimal dispatch of distributed energy resources,” Appl Energy., vol. 290, p. 116761, May 2021. https://doi.org/10.1016/j.apenergy.2021.116761
- arrow_upward [29] L. Olatomiwa, S. Mekhilef, S. Shamshirband, K. Mohammadi, D. Petković, and C. Sudheer, “A support vector machine-firefly algorithm-based model for global solar radiation prediction,” Solar Energy, vol. 115, pp. 632–644, May 2015. https://doi.org/10.1016/j.solener.2015.03.015
- arrow_upward [30] J. Fan, L. Wu, X. Ma, H. Zhou, and F. Zhang, “Hybrid support vector machines with heuristic algorithms for prediction of daily diffuse solar radiation in air-polluted regions,” Renew Energy, vol. 145, pp. 2034–2045, Jan. 2020. https://doi.org/10.1016/j.renene.2019.07.104
- arrow_upward [31] X. Shao, S. Lu and H. F. Hamann, "Solar radiation forecast with machine learning," 2016 23rd International Workshop on Active-Matrix Flatpanel Displays and Devices (AM-FPD), Kyoto, Japan, 2016, pp. 19-22. https://doi.org/10.1109/AM-FPD.2016.7543604
- arrow_upward [32] J. Boland, M. David, and P. Lauret, “Short term solar radiation forecasting: Island versus continental sites,” Energy, vol. 113, pp. 186–192, Oct. 2016. https://doi.org/10.1016/j.energy.2016.06.139
- arrow_upward [33] C. Voyant, G. Notton, C. Darras, A. Fouilloy, and F. Motte, “Uncertainties in global radiation time series forecasting using machine learning: The multilayer perceptron case,” Energy, vol. 125, pp. 248–257, Apr. 2017. https://doi.org/10.1016/j.energy.2017.02.098
- arrow_upward [34] S. Mohseni, A. C. Brent, S. Kelly, and W. N. Browne, “Demand response-integrated investment and operational planning of renewable and sustainable energy systems considering forecast uncertainties: A systematic review,” Renewable and Sustainable Energy Reviews, vol. 158, p. 112095, Apr. 2022. https://doi.org/10.1016/j.rser.2022.112095