Panthera Onca Corridors: A Spatially Explicit Analysis of Habitat Change Drivers and Potential Conservation Areas in the Bajo Magdalena, Colombia *
Corredores de Panthera onca: un análisis espacialmente explícito de los impulsores del cambio de hábitat y las posibles áreas de conservación en el Bajo Magdalena, Colombia
Received: June 25, 2020
Accepted: September 28, 2020
Toro-Garay, G. H.; Otero, M. P.; Valderrama-Ardila, C.; Escobedo, F. J. (2021). Panthera Onca Corridors: A Spatially Explicit Analysis of Habitat Change Drivers and Potential Conservation Areas in the Bajo Magdalena, Colombia. Trilogía Ciencia Tecnología Sociedad, v. 13, n. 24, 89-107. https://doi.org/10.22430/21457778.1641
Abstract
The distribution range of Jaguar (Panthera onca) is being reduced due to multi-scale habitat conversion, intensive hunting, illegal trafficking, habitat fragmentation, and the construction of highways and other infrastructure. Because of the decrease in population, this species’ listing has changed from vulnerable to a threatened category. Due to the ecological importance of this species, organizations like Red Colombiana de Seguimiento de Fauna Atropellada have proposed the establishment of wildlife corridors. But little is known as to recognize the driving forces in these habitat changes and where these corridors should be established. To address this lack of information, we determined the spatial extent to which the current distribution and access to P. onca habitat is being driven by deforestation, armed conflict, agriculture expansion, urbanization and the construction of highways in the Bajo Magdalena area of Colombia. We then identified potential areas for proposing conservation corridors. To do this, we used available geospatial information on P. onca distribution in the Corporación Autónoma Regional areas in the municipalities of Puerto Salgar, Caparrapí and Guaduas, as well as transportation network, administrative unit, and deforestation data from 2010 to 2018. We also calculated habitat distances to population centers and the distribution of P. onca relative to roads. Our findings suggest that urban population and highways affect 83 % of the total area of its distribution; deforestation increased by 47.9 km2 in the 105.24 km2 study area with 5.6 km2 alone left as P. onca habitat. We concluded that conservation initiatives must be implemented inside P. onca’s distributional range and buffer zones. Urbanization and the construction of highways were highly influential variables associated with the loss of P. onca habitat. Further, we propose that precautions along the principal road that connects Puerto Salgar and Guaduas should be taken into consideration to maintain the genetic flow and movement of the P. onca population as it affects 87 km of this proposed corridor.
Keywords: Panthera onca, highways, biological corridor, deforestation.
Resumen
El rango de distribución de Panthera onca se ha reducido debido a la transformación de hábitat a gran escala, caza intensiva, tráfico ilegal, fragmentación y la construcción de carreteras e infraestructuras. Como consecuencia, la población de jaguares ha disminuido, lo que ha generado que la especie haya cambiado de categoría vulnerable a especie amenazada. Debido a la importancia ecológica de esta especie, organizaciones como la Red Colombiana de Seguimiento de Fauna Atropellada han propuesto el establecimiento de corredores de vida silvestre. Pero se sabe poco sobre qué está impulsando estos cambios de hábitat y dónde deberían establecerse estos corredores. Para abordar esta falta de información, determinamos en un grado espacial la distribución actual y el acceso al hábitat de P. onca y evaluamos si estos factores están siendo impulsados por deforestación, conflicto armado, expansión agrícola, urbanización y construcción de carreteras en el área del Bajo Magdalena en Colombia. Con estos resultados identificamos áreas potenciales para proponer corredores de conservación. Para hacer esto, utilizamos la información geoespacial disponible sobre la distribución de P. onca en las áreas vigiladas por la Corporación Autónoma Regional en los municipios de Puerto Salgar, Caparrapí y Guaduas, así como la red de transporte, la unidad administrativa y los datos de deforestación de 2010 a 2018. También calculamos las distancias del hábitat a los centros donde se encuentra la población y la distribución de P. onca en relación con las carreteras. Nuestros hallazgos sugieren que la población urbana y las carreteras afectan el 83 % del área total de su distribución; la deforestación aumentó en 47.9 km2 en el área de estudio de 105.24 km2 con 5.6 km2 solo en el hábitat de P. onca. Por tanto, concluimos que las iniciativas de conservación deben implementarse dentro del rango de distribución y las zonas de amortiguamiento de P. onca. En particular, la urbanización y la construcción de carreteras fueron variables muy influyentes asociadas con la pérdida del hábitat de P. onca. Además, se deben tomar en cuenta precauciones a lo largo de la carretera principal que conecta Puerto Salgar y Guaduas para mantener el flujo genético y el movimiento de la población de P. onca, ya que afecta a 87 km de este corredor propuesto.
Palabras clave: Panthera onca, carreteras, corredor biológico, deforestación.
INTRODUCTION
Colombia is a critical country for jaguar conservation because it is the intercontinental bridge between Mesoamerican and South America genetic pools, but due to large-scale habitat conversion, intensive hunting, illegal trafficking, fragmentation, the construction of highways and infrastructure, jaguars in Colombia are considered a threatened species (
There are several possible drivers behind this change. Tropical regions had the highest rates of deforestation during 2000-2012 that was mostly a result of various complex factors including human-wildlife conflicts as well as loss of landscape connectivity (
In recent years, the anthropogenic pressure has increased and is affecting jaguar individuals ability to connect with other populations and even to find prey. According to
Moreover, intensive hunting, illegal trafficking, habitat fragmentation, the construction of highways and infrastructure are also some of the biggest threats to jaguar habitat (
However, the lack of information about jaguar distribution and poor landscape-level planning in Colombia can affect conservation strategies (
METHODOLOGY
Area of study
Colombia covers an area of 1.1 million km2 (
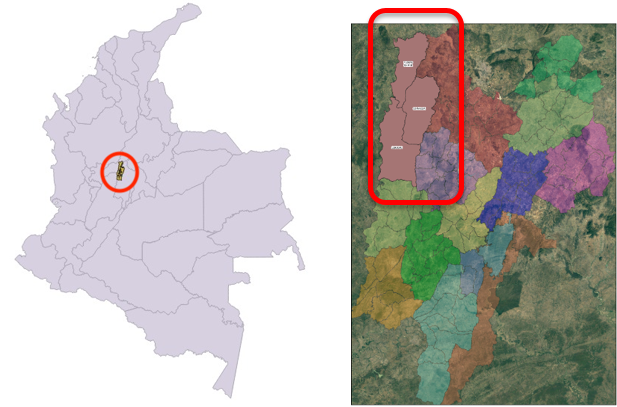
Accordingly, we selected the Bajo Magdalena region as our study area because the population of jaguars is being affected by rapidly occurring anthropogenic changes such as small-large urban and rural areas, increasing human populations, agriculture activities, infrastructure developments, such as major roads and other drivers related to deforestation (
As part of this analysis, we used information from the Instituto de Investigación de Recursos Biológicos Alexander von Humboldt, Departamento Administrativo Nacional de Estadística (DANE), and Instituto Nacional de Vías (Invías). We also estimated deforestation based on global coverage provided by
| Variable type | Variable Description | Year | Unit | Source |
| Municipallity | Municipalities of Colombia | 2018 | KM2 | Castillo Martínez, 2016 |
| Deforestation | Deforestation rates in Colombia | 2003-2018 | KM2 | Hansen et al., 2014 |
| Population | Population density | 2015 | Number | DANE, 2018 |
| Jaguar Population | Population density | 1957-2016 | Number | Castillo Martínez, 2016 |
| Jaguar Distribution | Area of distribution or movement | 1957-2016 | KM2 | Castillo Martínez, 2016 |
| Armed conflict | Presence of armed groups in the area | 2000-2020 | 1 presence and 0 absence | Prem et al., 2020 |
| Urban infrastructure | Urban constructions, little towns | 2019 | KM2 | DANE, 2018 |
| Roads | Maps of roads | 2019 | KM2 | DANE, 2018 (The National Institute of Roads) |
We analyzed the distance and distribution of the species using data from Table 1 and deforested areas adjacent to urban areas in the study area. Specifically, we studied 19 urban areas in Bajo Magdalena with an area of influence of 5 km, and we divided these areas into 5 buffer rings of 1 km each to determine the distance to the P. onca territory.
Additionally, we also estimated the deforested area within these populations, using raster data of forest cover change during the analysis periods of 2000 and 2018, with a pixel size of 27.88 m. Roads that were associated with each municipality and the concentric rings were also accounted for in order to calculate the total area affected by transportation infrastructure. Then, we determined the total area affected by the different drivers in the 5 rings.
Finally, we also calculated the impacts on the distribution of P. onca in the main and secondary pathways in the study area. We used a similar method to calculate the population of the jaguars based on rings of influence using the same patterns, between 1 and 5 km among roads. We found that the rings overlapped and intersected roads into segments. This analysis generated duplication of the data; thus, to avoid this we only counted the ring of influence closest to the distribution of P. onca. Finally, we developed a spatial correlation statistical analysis to identify the spatial relationship between the study areas and areas that affect the distribution of the P. onca. To explain this, we made a database with the number of jaguar populations, and then added the number of the studied population in areas that affect the distribution of the P. onca to maintain the equivalent unit as the municipalities. Besides, we also used this data to evaluate the effects of roads for jaguars, deforestation, and the area of P. onca distribution (GeoDa software).
RESULTS
Area of study
The total area of the distribution of P. onca is in the three municipalities of interest were 43.77, 30.73, and 30.72 km2 in the Caparrapí, Puerto Salgar, and Guaduas municipalities, respectively. It can be noted that the difference between these areas is small, given that they are an area of great influence and importance within the ecological corridor of P. onca. These areas in total represent 105.2 km2.
Figure 2 shows P. onca distribution areas (white areas), and the five rings created around the populations and populated centers of the municipalities studied. As figure 2 shows, they are conflict zones along Bajo Magdalena, especially in the central and southern zones. Therefore, we found fewer jaguar populations in the north and it extends to the east. We can also evidence that only a small fragment of the distribution is not in contact with the human population because of their distance.
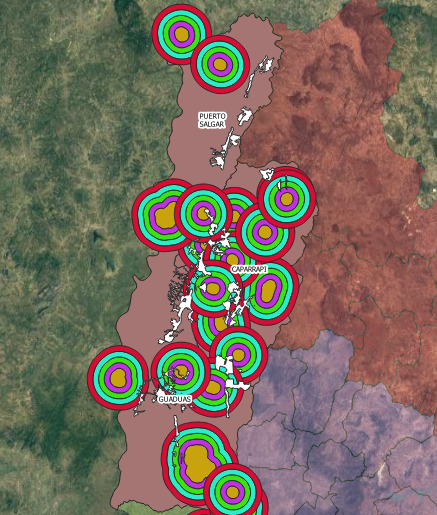
Note: The orange circles represent the urban population, and the other colors 5 km concentric rings around the urban center. White fragments represent P. onca distribution area or corridor.
The total area of distribution within each analyzed ring is shown in Table 2. According to this, the urban settlements that have the highest influence areas for the jaguar distribution are Cambras, San Ramón Alto, and Guaduero, with more than 10 km2 of distribution within the direct area of the population. These results show that even at distances up to 1 km2 we can find a jaguar distribution area. Besides, it was found that out of 12 urban populations studied, 7 occupy 72 % of Bajo Magdalena, and affects the distribution area of P. onca in the 5 km buffer zones.
| DISTANCE (KM2) | ||||||
| POPULATION | 1.00 | 2.00 | 3.00 | 4.00 | 5.00 | Total |
| CAMBRAS | 10.207 | 9.618 | 7.42 | 3.212 | 1.711 | 32.168 |
| CAMBULO | 6.177 | 4.619 | 1.744 | 1.349 | 0.104 | 13.993 |
| EL DINDAL | 0.988 | 3.835 | 5.77 | 1.336 | 0.407 | 12.336 |
| CAPARRAPÍ | 5.238 | 2.315 | 0.205 | 7.758 | ||
| SAN RAMÓN ALTO | 2.426 | 1.1 | 0.35 | 1.21 | 0.054 | 5.14 |
| LA PAZ DE CALAMOIMA | 1.991 | 1.17 | 1.064 | 0.78 | 0.038 | 5.043 |
| SAN PEDRO | 2.172 | 0.531 | 0.875 | 0.467 | 0.031 | 4.076 |
| GUADUERO | 1.417 | 0.531 | 0.633 | 0.666 | 0.602 | 3.849 |
| GUADUAS | 0.434 | 0.651 | 0.602 | 0.265 | 1.952 | |
| PUERTO BOGOTÁ | 1.179 | 0.362 | 1.541 | |||
| CÓRDOBA | 0.164 | 0.164 | ||||
| TATI | 0.019 | 0.019 | ||||
| Total (general) | 32.393 | 24.732 | 18.663 | 9.304 | 2.947 | 88.039 |
As Table 2 shows, out of 105 km2 of jaguar distribution, 88 km2 intersect within the 5km buffer zones. This means that 83% of the distribution area intersects the buffer areas.
Overall, we found a total of 47.9 km2 of deforestation, where 5.6 km2 are within the P. onca distribution area. However, this value is found in strategic areas for connectivity between jaguar populations.
Figure 3 shows the vector information used for the analysis of the influence of the roads, both local and inter-municipal, finding that 99.7 km2 of the total are being affected by these, especially in connectivity between municipalities. Once the analysis was carried out, we found that the municipalities of Caparrapi and Guaduas have more prominent effects on P. onca distribution, with a 41.3 and 33.2 km2 respectively. Besides, we noticed that the most troubled areas of jaguar distribution are 1-3 km2 away within these municipalities, which suggests that the roads are very close to P. onca population, which can explain the difficulty of jaguar interaction between two different populations due to fragmentation.
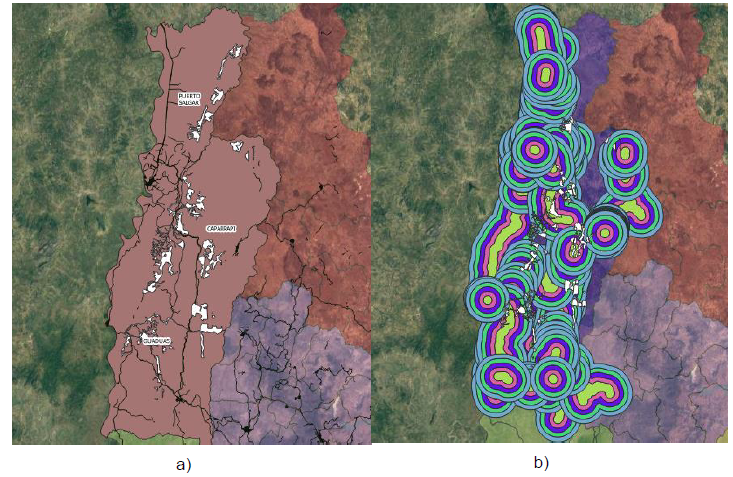
Note: a) Distribution areas and roads. b) Areas of influence of the roads. White fragments represent P.onca distribution area or corridor. Black lines, represent roads.
Table 3 shows the effects of P. onca distribution by ring and municipality within the intersection between roads and distribution areas of P. onca. As table 3 shows, 87.5 km2 of the distribution area of the P. onca is affected by primary and secondary roads, which represents 83.1 % of the total area of distribution of P. onca.
Table 3 shows the direct relationship among roads and their connectivity toward jaguar populations, which intersect 5 km of the total distribution area of the P. onca due to the spatial distribution and growth of the studied municipalities. Since these municipalities require connectivity between them, jaguar populations become isolated as a result of the construction of roads. Nonetheless, the impact, influence, and the type of road are different regarding P. onca distribution, and habitat. The greatest impact among this is found in the highways or roads that connect the largest municipalities through national roads, other roads that connect urban areas and rural have a lower impact because some of them are unpaved, which allows the movement of P. onca, although the greater probability of being run over.
| DISTANCE (KM2) | ||||||
| MUNICIPALITY | 1.00 | 2.00 | 3.00 | 4.00 | 5.00 | Total |
| CAPARRAPI | 9.103 | 11.806 | 13.047 | 5.189 | 2.239 | 41.384 |
| GUADUAS | 8.948 | 7.95 | 6.399 | 6.41 | 3.549 | 33.256 |
| PUERTO SALGAR | 5.911 | 1.402 | 3.973 | 1.615 | 12.901 | |
| TOTAL | 23.962 | 21.158 | 19.446 | 15.572 | 7.403 | 87.541 |
Model
Table 4 shows the correlation between variables and that there is a positive relationship between the influence of jaguar populations and their distribution area in the 5 km studied, the highest values of influence on roads are between the 2 and 3km rings, and at a greater distance, the correlation decreases.
| Variable | Correlation-area of distribution P. onca |
| Distribution area | 1.00 |
| Deforestation | 0.49 |
| Urban Population 1 km | 0.95 |
| Urban Population 2 km | 0.99 |
| Urban Population 3 km | 1.00 |
| Urban Population 4 km | 0.99 |
| Urban Population 5 km | 0.95 |
| Roads 1 km | 0.54 |
| Roads 2 km | 0.78 |
| Roads 3 km | 0.87 |
| Roads 4 km | 0.00 |
| Roads 5 km | -0.20 |
Then, we made a spatial statistics analysis with the Bivariant dwell index to determine the relationship within the variables, and the effects on their neighbors spatially. To do this we used the queen contiguity for the connectivity analysis in all directions. As Figure 4 shows, we made a map of significance to establish the relationship between a municipality and its neighboring municipalities to determine the variables that affect the distribution area of the jaguar in a ring of a kilometer. For 2 of the 3 municipalities studied, the low-high combination indicates that when the relationship in a municipality between the populations of the jaguar is low and the distribution area of the jaguar is high, its neighbors also have this relationship.
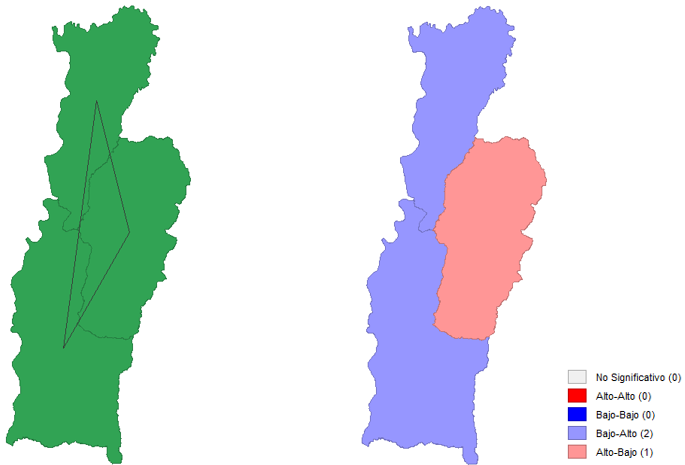
Note: a) Spatial connectivity of the Municipalities of Bajo Magdalena. b) Example of the Moran Bivariante Index between the distribution area and the population in the 1 km ring.
In the variables studied, there are no high-high spatial relationships, which means that the variables are not spatially related, and the distribution of P. onca is affected only by the variables already described, but they are not related in space. This spatial relationship is evident, despite being significant it has few observations, which can affect the result.
DISCUSSION
This study used spatially explicit analyses and available geospatial data to determine the spatial extent of P. onca habitat and how deforestation, armed conflict, agriculture expansion, urbanization and the construction of highways are affecting its habitat and distribution in the Bajo Magdalena area of Colombia. Our findings show that urbanization and the construction of highways were highly influential variables associated with the loss of the jaguar (Panthera onca) habitat, especially in the urban areas of Cambras, San Ramon Alto and Guaduero (Figure 2), which manifest an intersection with jaguars and the human settlements, which is common due to the highly transform areas (
In addition, our results also show a correlation between variables and a positive relationship between the influence of jaguar populations and their distribution area in the 5 km studied around the urban areas (Table 4). This implies that measures need to be taken considering that habitat loss due to forest conversion such as roads and agriculture generate conflict between jaguar and humans by increasing disputes between them as a result of the reduction and difficulty of jaguar movement (
As we evaluated, there is presence of jaguars in the SINAP Cuchilla de San Antonio, and there are isolated and difficult areas for jaguar to cross because of roads, infrastructure, and human settlements. Thus, we identify connections of forest areas within the riparian forest. For instance, we suggest that P. onca may be adapting to highly transformed areas by using them to move and avoid human interaction (
Therefore, there are remote populations of jaguars in the Bajo Magdalena area, and as Figures 2 and 3 show, these areas might restrict jaguar distribution due to railways, highways and urban population in the area; yet there are some additional pressures, such as deforestation, that may restrict jaguar distribution and their fitness. Even though jaguars require a large territory, having limited access to their territory may affect the gene flow in isolated populations (
Moreover, P. onca is a nocturnal feline, which means that the movement and hunting take place mostly at night (
CONCLUSIONS
Landscape transformation and the change in land use are increasing the isolation of jaguar populations. Roads, agricultural expansion, and urban areas are some of the anticipated mechanisms of isolation among jaguars. However, due to these landscape changes, jaguars have developed a strategy by moving through highly transformed forests, mostly riparian forests, but we propose that precautions along the principal road that connects Puerto Salgar and Guaduas should be taken into consideration in order to maintain the genetic flow and movement of the P. onca population as it affects 87 km of this proposed corridor. Through using geospatial tools we can provide an insight into the different jaguar threat drivers by identifying conflict zones and the reasons for potential habitat loss, as well as the possibility of generating optimal ecological niche proposals and monitoring of proposed conservation plans. We concluded that conservation initiatives must be implemented inside jaguars’ distributional range and buffer zones. Finally, these analyses help to get an overview of various factors that can explain how indirect and direct factors may impact P. onca and its habitat, such as the change in land use and the change of area, that restricts the movement of the species.
FOOTNOTE
- arrow_upward Este artículo surge como actividad de investigación independiente con apoyo de la Facultad de Ciencias Naturales y Matemáticas de la Universidad Nuestra Señora del Rosario, Bogotá, Colombia.
REFERENCES
- arrow_upward Benítez Gutiérrez, A. M. (2010). Aproximaciones del hábitat potencial para jaguar (Panthera onca) en la Región Caribe colombiana (Tesis de maestría). http://hdl.handle.net/11554/4515
- arrow_upward Boron, V.; Deere, N. J.; Xofis, P.; Link, A.; Quiñones-Guerrero, A.; Payan, E.; Tzanopoulos, J. (2019). Richness, diversity, and factors influencing occupancy of mammal communities across human-modified landscapes in Colombia. Biological conservation, v. 232, 108-116. https://doi.org/10.1016/j.biocon.2019.01.030
- arrow_upward Boron, V.; Tzanopoulos, J.; Gallo, J.; Barragan, J.; Jaimes-Rodriguez, L.; Schaller, G.; Payán, E. (2016). Jaguar Densities across Human-Dominated Landscapes in Colombia: The Contribution of Unprotected Areas to Long Term Conservation. PloS One, v. 11, n. 5, 1-14. https://doi.org/10.1371/journal.pone.0153973
- arrow_upward Boron, V.; Xofis, P.; Link, A.; Payan, E.; Tzanopoulos, J. (2018). Conserving predators across agricultural landscapes in Colombia: habitat use and space partitioning by jaguars, pumas, ocelots and jaguarundis. Oryx, v. 54, n. 4, 554-563. https://doi.org/10.1017/S0030605318000327
- arrow_upward Castillo Martínez, L. S. (2016). Plan de conservación de los felinos silvestres del territorio CAR. Corporación Autónoma Regional de Cundinamarca. http://hdl.handle.net/20.500.11786/35787
- arrow_upward Castro-Nunez, A.; Mertz, O.; Sosa, C. C. (2017). Geographic overlaps between priority areas for forest carbon-storage efforts and those for delivering peacebuilding programs: implications for policy design. Environmental Research Letters, v. 12, n. 5, 1-11. http://doi.org/10.1088/1748-9326/aa6f20
- arrow_upward Departamento Administrativo Nacional de Estadística. (2018). Marco Geoestadístico Nacional. https://geoportal.dane.gov.co/servicios/descarga-y-metadatos/descarga-mgn-marco-geoestadistico-nacional/
- arrow_upward Figel, J. J.; Botero-Cañola, S.; Forero-Medina, G.; Sánchez-Londoño, J. D.; Valenzuela, L.; Noss, R. F. (2019). Wetlands are keystone habitats for jaguars in an intercontinental biodiversity hotspot. PloS One, v. 14, n. 9, 1-16. https://doi.org/10.1371/journal.pone.0221705
- arrow_upward Gese, E. M.; Terletzky, P. A.; Cavalcanti, S. M. C.; Neale, C. M. U. (2018). Influence of behavioral state, sex, and season on resource selection by jaguars (Panthera onca): Always on the prowl? Ecosphere, v. 9, n. 7, 1-16. https://doi.org/10.1002/ecs2.2341
- arrow_upward Haag, T.; Santos, A. S.; Sana, D. A.; Morato, R. G.; Cullen Jr, L.; Crawshaw Jr, P. G.; De Angelo, C.; Di Bitetti, M. S.; Salzano, F. M.; Eizirik, E. (2010). The effect of habitat fragmentation on the genetic structure of a top predator: loss of diversity and high differentiation among remnant populations of Atlantic Forest jaguars (Panthera onca).Molecular Ecology, v. 19, n. 22, 4906-4921. https://doi.org/10.1111/j.1365-294X.2010.04856.x
- arrow_upward Hansen, M.; Potapov, P.; Margono, B.; Stehman, S.; Turubanova, S.; Tyukavina, A. (2014). Response to Comment on “High-resolution global maps of 21st-century forest cover change.” Science, v. 344, n. 6187, 981. https://doi.org/10.1126/science.1248817
- arrow_upward Marchini, S.; Macdonald, D. W. (2012). Predicting ranchers’ intention to kill jaguars: Case studies in Amazonia and Pantanal. Biological Conservation, v. 147, n. 1, 213-221. https://doi.org/10.1016/j.biocon.2012.01.002
- arrow_upward Pardo-Vargas, L. E.; Payán-Garrido, E. (2015). Mamíferos de un agropaisaje de palma de aceite en las sabanas inundables de Orocué, Casanare, Colombia. Biota Colombiana, v. 16, n. 1, 54-66. http://revistas.humboldt.org.co/index.php/biota/article/view/367
- arrow_upward Payán, E.; Castaño-Uribe, C.; González-Maya, J. F.; Valderrama, C.; Ruiz-García, M.; Soto, C. (2010). Distribución y estado de conservación del jaguar en Colombia. En E. Payán Garrido; C. Castaño-Uribe (editores), Grandes felinos de Colombia (Vol. I, pp. 23-36). Panthera Colombia.
- arrow_upward Petracca, L. S.; Hernández-Potosme, S.; Obando-Sampson, L.; Salom-Pérez, R.; Quigley, H.; Robinson, H. S. (2014). Agricultural encroachment and lack of enforcement threaten connectivity of range-wide jaguar (Panthera onca) corridor. Journal for Nature Conservation, v. 22, n. 5, 436-444. https://doi.org/10.1016/j.jnc.2014.04.002
- arrow_upward Prem, M.; Saavedra, S.; Vargas, J. F. (2020). End-of-conflict deforestation: Evidence from Colombia’s peace agreement. World Development, v. 129, 1-11. https://doi.org/10.1016/j.worlddev.2019.104852
- arrow_upward Quigley, H.; Foster, R.; Petracca, L.; Payan, E.; Salom, R.; Harmsen, B. (2017). Panthera onca (errata version published in 2018). The IUCN Red List of Threatened Species 2017: e.T15953A123791436. https://doi.org/10.2305/IUCN.UK.2017-3.RLTS.T15953A50658693.en
- arrow_upward Rabinowitz, A.; Zeller, K. A. (2010). A range-wide model of landscape connectivity and conservation for the jaguar, Panthera onca. Biological conservation, v. 143, n. 4, 939-945. https://doi.org/10.1016/j.biocon.2010.01.002
- arrow_upward Ramírez Delgado, J. P.; Galindo García, G.; Yepes Quintero, A. P.; Cabrera Montenegro, E. (2018). Estimación de la degradación de bosques de Colombia a través de un análisis de fragmentación.http://documentacion.ideam.gov.co/openbiblio/bvirtual/023784/023784.html
- arrow_upward Roques, S.; Sollman, R.; Jácomo, A.; Tôrres, N.; Silveira, L.; Chávez, C.; Keller, C.; Mello do Prado, D.; Carignano Torres, P.; Jorge dos Santos, C.; Bernardes Garcia da Luz, X.; Magnusson, W. E.; Godoy, J. A.; Ceballos, G.; Palomares, F. (2016). Effects of habitat deterioration on the population genetics and conservation of the jaguar. Conservation genetics, v. 17, n. 1, 125-139. https://doi.org/10.1007/s10592-015-0766-5
- arrow_upward Thornton, D.; Zeller, K.; Rondinini, C.; Boitani, L.; Crooks, K.; Burdett, C.; Rabinowitz, A.; Quigley, H. (2016). Assessing the umbrella value of a range‐wide conservation network for jaguars (Panthera onca). Ecological Applications, v. 26, n. 4, 1112-1124. https://doi.org/10.1890/15-0602
- arrow_upward Zárrate-Charry, D. A.; Massey, A. L.; González-Maya, J. F.; Betts, M. G. (2018). Multi-criteria spatial identification of carnivore conservation areas under data scarcity and conflict: a jaguar case study in Sierra Nevada de Santa Marta, Colombia. Biodiversity and Conservation, v. 27, n. 13, 3373-3392. https://doi.org/10.1007/s10531-018-1605-z