Construct Validity of a Scale to Measure the Job Satisfaction of Professors at Public Universities in Central Mexico during COVID-19*
Validez de constructo de una escala para medir la satisfacción laboral de profesores de una universidad pública en México durante la COVID-19
Received: December 12, 2020
Accepted: April 4, 2021
García-Lirios, C. (2021). Construct Validity of a Scale to Measure the Job Satisfaction of Professors at Public Universities in Central Mexico during COVID-19. Trilogía Ciencia Tecnología Sociedad, v. 13, n. 25, e1826. https://doi.org/10.22430/21457778.1826
Abstract
Until May 2021, six and a half million deaths had been directly and indirectly associated with COVID-19. This pandemic has impacted the traditional classroom by transferring it to online environments. The objective of this study was to establish the construct validity of an instrument that measures professors’ job satisfaction. A cross-sectional psychometric study was carried out with a selection of 100 professors from public universities in central Mexico. Three main factors were found to explain 56% of the total variance: information need, perceived usefulness, and technology adoption. Although the research design limited the results to the study setting, suggesting the extension of the work towards validity and convergent of the construct.
Keywords: Construct validity, COVID-19, reliability, satisfaction scale.
Resumen
Hasta mayo de 2021 se reportaron seis millones y medio de muertes relacionadas directa e indirectamente con la COVID-19. Esta pandemia ha impactado el salón de clase tradicional, transfiriéndolo a ambientes virtuales. El objetivo de este trabajo es establecer la validez de constructo de un instrumento que mide la satisfacción laboral. Se realizó un estudio transversal psicométrico con un grupo seleccionado de 100 profesores de una universidad pública en México. Se encontró que tres factores principales explican 56% de la varianza total: necesidad de información, utilidad percibida y adopción de tecnológica. Aunque el diseño de esta investigación puede haber limitado los resultados a este escenario específico, estudios futuros podrían mejorar la validez y convergencia de los constructos.
Palabras clave: validez de constructo, COVID-19, fiabilidad, escala de satisfacción.
INTRODUCTION
Until May 2021, the SARS CoV-2 pandemic and the COVID-19 disease had claimed the lives of 3.5 million people worldwide. Adding the deaths from atypical pneumonia indirectly related to the health crisis, that statistic could even reach 6.5 million. These figures can be calculated from the difference between the average annual number of expected deaths and the total number of deaths reported since the emergence of the SARS CoV-2 (
Against this background, the impact of the pandemic on the economy, mainly on employment, has been significant in terms of entrepreneurship indices. Entrepreneurship, an indicator of the gross domestic product (GDP), attracts international investment and facilitates the economic rebound of different regions and localities. In the last 20 years, the United States has been number one in this regard, followed by the People's Republic of China. However, the advent of this pandemic changed the course of history. Studies on entrepreneurship worldwide have focused on the impact of the pandemic on micro-businesses (
The Asian region, led by the Chinese economy, projects a growth rate higher than all other economic regions for 2020 (
In the Asian region, where COVID-19 has had a weaker effect, 21% recognize significant, moderate, and opportunistic effects (
The green gross domestic product (GGDP) can be used to anticipate the effects of economic crises resulting from health threats. The ranking of green economies is led by the US, followed by Switzerland and Australia (
In spite of the asymmetries between the economic regions of North America and Asia Pacific, as well as the differences between developed countries, entrepreneurship is a local phenomenon that hinges on the trust in local products over those of multinational companies (
Even in economies with a medium or intermediate income level (such as those in Latin America), the differences lie in the levels of trust translated into perceived opportunities and entrepreneurial intentions (
Central Mexico is considered the area with the greatest entrepreneurial dynamics in Latin America, reaching growth levels comparable to developed countries such as those in the eurozone. However, since 2008, the entrepreneurship indices of the States that constitute the entrepreneurial center of Mexico have changed (
The responses of state governments have been different from those of economic and social organizations because they have focused their public policies on mitigating the pandemic rather than promoting entrepreneurship and economic reactivation (
In this risk-prone scenario, the mitigation policy is based on lockdowns and social distancing, which forced the transition from the traditional classroom (with the teacher as the central axis of knowledge dissemination) to its virtual counterpart (where the teacher shares learning platforms). This distinction is radical because it has strong effects on traditional or teacher-centered learning and technology-mediated learning, which requires mode student autonomy (
In the education sector, different technologies have attracted unprecedented interest in the promotion of courses, diplomas, congresses, or colloquia. The latter have been held through platforms such as Google Meet, Zoom, or Teams in alliance with Facebook, Twitter, YouTube, Instagram or WhatsApp, who have been disseminators of cultural and educational events, as well as guarantors of real-time access for entrepreneurs, trainers, or trainees emerging from the pandemic (
Job satisfaction has been defined as a favorable disposition towards academic, professional, and job training, which is now received online. In this sense, it has been classified as a satisfactory experience, which is derived from a commitment to the vocational instruction, but it also implies a high degree of trust in that union, the organization, or the technology (
In the virtual classroom, job satisfaction refers to basic psychological processes of searching, selecting, and processing information. It is a system of perceptions of usefulness and ease of use, as well as satisfactory experiences of compatibility between technologies and teaching knowledge management, production, and transfer skills (
However, other studies into job commitment in the virtual classroom suggest rather unsatisfactory experiences (
The impact of the pandemic on entrepreneurship has spread to employee satisfaction.
In general, the instruments that measure job satisfaction are differentiated by their degree of specification for the job function (
The research hypothesis of this study holds that there are significant differences between the findings reported in the literature regarding the dimensions of job satisfaction and the factors found here (
This outpour of information about the costs and advances of lockdowns or social distancing has an impact on the intensive use of technologies, which will generate a degree of dissatisfaction or satisfaction associated with commitment, entrepreneurship, innovation, and job competitiveness (
METHOD
Design
Since job satisfaction in virtual classrooms implies scenarios of information needs (search, processing, and dissemination), compatibility between technology and computational skills, and the usefulness of these platforms, these three dimensions (reported in the literature) can be compared with observations in a sample (
These basic cognitive processes converge into three complex factors: information need, compatibility of skills with the accessibility and ease of use of technologies, and technology usefulness. Other studies have examined such convergence of the three factors and reported dimensions (measured using instruments) that refer to the impact of technology on the academia, college education, and professional training (
Therefore, this cross-sectional psychometric study aims to examine the validity of an instrument that measures job satisfaction, confirm the dimensions reported in the literature, and establish the percentage of variance explained in order to be able to propose a model that measures the three factors and their indicators.
Sample
Purposive sampling was employed here to select 100 professors (Age, M = 34.2 and SD = 10.28; monthly income, M = 8,890.12 USD and SD = 265.29 USD) from a public university in central Mexico considering their experience of the recent change in teaching practices. Since the university was recently founded, most professors have completed undergraduate studies in social sciences, especially social work, communication, languages, and actuarial science.
Instrument
The Job Satisfaction Scale (JSS-21) employed here was constructed based on the systematic review of
Process
Microsoft Teams software was used to respond to a section of the survey. The selected professors received, via their institutional email address, an invitation and a link to answer the questionnaire, which was composed of 21 items and socio-educational questions, each with a response scale. At the end, they were given a certificate of participation. The confidentiality and anonymity of their responses, as well as the adequate handling and protection of their personal data, were previously ensured.
Analysis
The data were processed in Statistical Package for the Social Sciences (SPSS) version 23.0 to establish the parameters of distribution, reliability, validity, fit, and residual. SPSS was also utilized to test the null hypothesis in this study, i.e., there are no significant differences between the theoretical dimensions (reported in the literature) and the factors of job satisfaction found here.
Normal distribution and discrimination of items
The first condition was estimated using the Mardia coefficient (.9.20), which reached a value that could be located at the multivariate normal distribution threshold (
Exploratory Factor Analysis
The extraction method was main axes and promax rotation (criterion of five subjects per item). The preliminary requirements of adequacy (KMO = .657) and sphericity were estimated ⌠χ2 = 14.21 (14df) p < .05⌡.
Interpretation
Values close to zero were considered to be evidence of spurious relationships; values close to unity, evidence of collinearity; and values between 0.30 and 0.90, evidence of a relationship between the variables. To test the null hypothesis, it was assumed that values lower than 0.05 were evidence of significant differences at settings greater than 0.90 and residuals lower than 0.009.
RESULTS
Table 1 shows the descriptive values of the instrument that measures professors’ job satisfaction considering thresholds to interpret the results. All the values are in a range in which reliability and validity tests can be conducted. Both analysis show a three-dimensional structure that converges to a common factor in the same way as the initiators in each dimension.
| R | Item | M | SD | A | F1 | F2 | F3 |
| r1 | Platform taxonomy for virtual classrooms | 3.21 | 1.81 | .711 | .432 | ||
| r2 | User traffic of virtual educational platforms | 3.29 | 1.93 | .703 | .329 | ||
| r3 | Data on connectivity in virtual classrooms | 4.13 | 1.37 | .735 | .314 | ||
| r4 | Information on keyword search | 4.21 | 1.56 | .792 | .405 | ||
| r5 | Productivity index of scientific articles | 4.08 | 1.51 | .721 | .465 | ||
| r6 | Number of downloads of special items | 4.27 | 1.07 | .760 | .437 | ||
| r7 | Citation index by author during the Pandemic | 2.17 | 1.03 | .774 | .328 | ||
| r8 | Learning in virtual classrooms | 2.10 | 1.02 | .701 | .429 | ||
| r9 | Hours dedicated to online education | 4.36 | 1.01 | .794 | .432 | ||
| r10 | Scientific article preparation time | 4.87 | 1.09 | .763 | .501 | ||
| r11 | Instrument development time | 2.07 | 1.43 | .782 | .643 | ||
| r12 | Video conference preparation | 4.76 | 1.42 | .774 | .328 | ||
| r13 | Virtual classroom management time | 3.35 | 1.78 | .790 | .543 | ||
| r14 | Real-time data processing | 3.28 | 1.04 | .781 | .671 | ||
| r15 | Use of platforms for virtual classrooms | 4.30 | 1.53 | .775 | .439 | ||
| r16 | Use of video conferencing | 2.65 | 1.52 | .776 | .320 | ||
| r17 | Use of electronic classroom devices | 3.14 | 1.60 | .709 | .456 | ||
| r18 | Use of alternative online education | 2.74 | 1.85 | .762 | .531 | ||
| r19 | Use of data storage devices | 3.39 | 1.45 | .783 | .629 | ||
| r20 | Use of platforms for academic events | 2.45 | 1.63 | .759 | .543 | ||
| r21 | Use of scientific databases | 4.13 | 1.21 | .743 | .630 |
Source: Created by the author.
The exploratory factorial structure of professor job satisfaction includes three dimensions: information need, perceived usefulness, and technology adoption. However, the correlations between the factors and the items are low, which indicates that other indicators should be included. In order to observe the structure of relationships between factors, a covariance matrix was estimated. Said matrix suggests that a reflective model of job satisfaction should be developed using the three dimensions and its indicators (see Table 2).
| M | SD | F1 | F2 | F3 | F1 | F2 | F3 | |
| F1 | 21.37 | 16.21 | 1.000 | 1.876 | .512 | .612 | ||
| F2 | 23.51 | 17.39 | .672* | 1.000 | 1.890 | .501 | ||
| F3 | 28.31 | 15.21 | .529** | .546* | 1.000 | 1.671 |
Source: Created by the author.
The correlation and covariance structure shows that other factors, which were not included in the model, could be incorporated if they are identified in the literature, but the percentage of explained variance suggests an orthogonal criterion. In order to observe the relationships between all the variables considering the adjustment and residuals to test the null hypothesis, a reflective model of job satisfaction was developed in this study (see Figure 1).
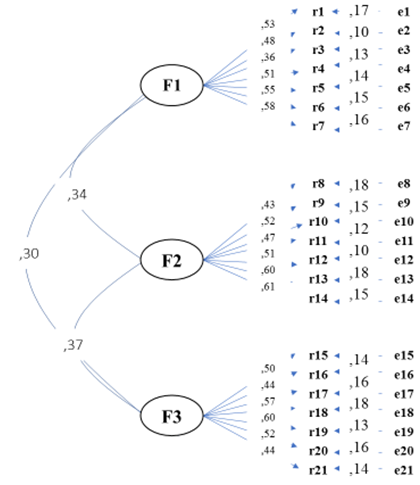
Source: Created by the author.
The adjustment and residual parameters found here ⌠χ2 = 23.12 (13 df) p > .05; GFI = .997; CFI = .997; RMSEA = .008⌡ suggest that the null hypothesis (i.e., there are no significant differences between the theoretical structure reported in the literature and the structure observed in this study) was not rejected.
DISCUSSION
This study contributes to the state of the art in this field because it establishes the exploratory factorial validity of the Job Satisfaction Scale, although the study design limits the results to the sample.
The number of dimensions in classic instruments that measure job satisfaction ranges between three and seven factors related to resources with which workers carry out their task or function. This study has shown the prevalence of three factors related to the technology, devices, and software that are used in virtual classrooms. This new type of satisfaction is the result of the need for long lockdowns and social distancing. Due to this situation, information about the pandemic and the flipped classroom is increasingly searched, processed, and intensively used. In a flipped classroom, professors no longer occupy central place of knowledge and delegate their instruction to student’s self-management and computer skills, limiting themselves to motivational support, which is increasingly satisfactory as the pandemic deepens.
This result should be confirmed because job satisfaction also depends on the traditional classroom and the centrality of knowledge. The balance between the traditional and the emerging paradigm implies high degrees of professor satisfaction, which could be explained by a balanced approach, the dissemination of knowledge, and the emergence of new capabilities.
In this emerging virtual classroom learning process, the adoption and intensive use of technology can generate high levels of satisfaction that could be reduced with the return to traditional classrooms. Nevertheless, a balance between face-to-face and distance functions can maintain high levels of satisfaction. By studying the profiles and capabilities of professors, educational institutions can anticipate scenarios that can maintain the job satisfaction of their faculty, as well as their academic and research performance.
Therefore, establishing the validity of the job satisfaction construct is a first step towards the convergent validity of the instrument with respect to other scales that measure variables concomitant with the phenomenon under study. This is the case of multi-feature and multi-method validity, which can be used to anticipate the measurement of connected phenomena based on the comparison of heterogeneous, non-standardized, and standardized observations and records. The prediction of job satisfaction in virtual and traditional classrooms brings significant benefits in the generation of intellectual capital beyond the academia and has effects on the professional and work environment of university professors.
CONCLUSIONS
The objective of this study was to establish the validity of an instrument that measures professors’ job satisfaction using three dimensions: information need, technology usefulness, and adoption of virtual classrooms. Although the findings here are limited to the sample, they suggest that future research should investigate construct and scale validity to achieve convergent validity.
However, the proposed model is robust. The non-rejection of the null hypothesis (i.e., there are no significant differences between the theoretical structure reported in the literature and the structure observed in this study) means three things: (1) Other factors should be included to increase the percentage of explained variance and adjust the theoretical model based on the observation of the proposed dimensions. (2) The model should be empirically tested in other risk scenarios, such as insecurity and lockdown, as well as using other samples of workers that present levels of dissatisfaction or satisfaction when forced to use some technology. And (3) future studies should propose a new modeling of the factors and indicators of job satisfaction.
The job satisfaction of professors who forcibly left the traditional classroom and adapted to its online counterpart had not been measured thus far in studies on this topic. Nevertheless, predicting such satisfaction sparks the discussion about the organizational conditions that will allow them to return to face-to-face instruction without leaving online education aside. Future research should clarify this question by anticipating possible scenarios of balance between face-to-face and distance classes.
FOOTNOTE
- arrow_upward * This article is derived from the collaboration project between the Transdisciplinary Academic Network and the Universidad Autónoma del Estado de Hidalgo, registration number ATN-UAEH-CGL-2020-001.
REFERENCES
- arrow_upward Bustos-Aguayo, J. M.; Carreon-Guillen, J.; Hernández-Valdés, J.; Espinoza-Morales, F.; Garza-Sánchez, J. A.; García-Lirios, C. (2021). Empirical Test of a Model of Subjective Well-Being in the Post Covid-19 Era. International Surgery Case Reports, v. 2, n. 1, 1-6.
- arrow_upward Bustos Aguayo, J. M.; Juárez Nájera, M.; García Lirios, C.; Bolivar Mojica, E.; Quiroz Campas, C. Y. (2020a). Reliability and validity of scale of studies of the perception internet use. Zona Próxima, v. 33, n. 1, 27-41. https://doi.org/10.14482/zp.33.371.33
- arrow_upward Bustos Aguayo, J. M.; Juárez Nájera, M.; Hernández Valdés, J.; Espinoza Morales, F. (2020b). Metanálisis de la validez instrumental aleatoria de la formación académica sobre el emprendimiento digital. Revista Visión Gerencial, v. 19, n. 2, 194-201. http://erevistas.saber.ula.ve/index.php/visiongerencial/article/view/16202
- arrow_upward Carreón-Guillén, J.; Bustos-Aguayo, J. M.; Bermúdez-Ruíz, G.; Espinoza-Morales, F.; García-Lirios, C. (2020a). Actitudes hacia la pandemia ocasionada por el coronavirus SARS-COV-2 y la COVID-19. Invurnus, v. 15, n. 2, 12-16. https://doi.org/10.46588/invurnus.v15i2.24
- arrow_upward Carreón Guillén, J.; Bustos Aguayo, J. M.; Sánchez Sánchez, A.; Martinez Muñoz, E.; García Lirios, C. (2020b). La estructura del estrés laboral. Revista de Investigación Académica sin Frontera, v. 13, n. 32, 1-23. https://revistainvestigacionacademicasinfrontera.unison.mx/index.php/RDIASF/article/view/321
- arrow_upward Espinoza-Morales, F.; Campos-Guido, L. L.; García-Lirios, C. (2021). Tutorial networks in the development of the research protocol. International Journal of Advances in Social Science, v. 9, n. 1, 1-7.
- arrow_upward García Lirios, C. (2021). Exploratory factors structural Internet expectancy. SAINSMAT: Journal of Applied Sciences, Mathematics, and Its Education, v. 10, n. 1, 43-51. https://doi.org/10.35877/sainsmat1012132021
- arrow_upward Garcia Lirios, C. (2020). Specification a Model for Study of Occupational Health. Global Journal of Management and Business Research, v. 20, n. 1, 1-6. https://journalofbusiness.org/index.php/GJMBR/article/view/3012
- arrow_upward García Lirios, C.; Carreón Guillén, J.; Bustos Aguayo, J. M.; Hernández Valdés, J. (2020a). Percepción del emprendimiento caficultor en la región Huasteca, centro de México. Revista Activos, v. 18, n. 1, 235-266. https://doi.org/10.15332/25005278/6164
- arrow_upward García Lirios, C.; Quiroz Campas, C. Y.; Bermúdez Ruíz, G.; Sandoval Vásquez, F. R.; Carreón Valencia, O. J. (2020b). Reliability and validity of an instrument that measures entrepreneurship. Revista Científica Pensamiento y Gestión, v. 49, 276-293. https://rcientificas.uninorte.edu.co/index.php/pensamiento/article/view/11667
- arrow_upward Hora, G. P. R.; Ribas Júnior, R.; Souza, M. A. (2018). State of the Art of Job Satisfaction Measures: A Systematic Review. Trends in Psychology, v. 26, n. 2, 971-986. https://doi.org/10.9788/TP2018.2-16En
- arrow_upward Instituto Nacional de Estadística y Geografía. (2020). Censo de Población y Vivienda 2020. https://inegi.org.mx/programas/ccpv/2020/
- arrow_upward Juárez-Nájera, M.; Carreón Guillén, J.; Bustos Aguayo, J. M.; Hernández Valdés, J.; García Lirios, C.; Espinoza Morales, F.; Sánchez Sánchez, A.; Quiroz Campas, C. Y. (2020). Redes de formación profesional: gestión, innovación y emprendimiento del conocimiento. Foro Educacional, n. 34, 105-120. https://doi.org/10.29344/07180772.34.2362
- arrow_upward Kumar, P.; Majeed Khan, A. (2014). Development of Job Satisfaction Scale for Health Care Providers. Indian Journal of Public Health, v. 58, n. 4, 249-255. https://doi.org/10.4103/0019-557X.146283
- arrow_upward Lee, X.; Yang, B.; Li, W. (2017). The influence factors of job satisfaction and its relationship with turnover intention: Taking early career employees as an example. Annals of Psychology, v. 33, n. 3, 697-707. https://doi.org/10.6018/analesps.33.3.238551
- arrow_upward McCloskey, J. (1974). Influence of rewards and incentives on staff nurse turnover rate. Nursing Research, v. 23, n. 3, 239-247. https://doi.org/10.1097/00006199-197405000-00009
- arrow_upward McCloskey, J. C.; McCain, B. E. (1987). Satisfaction, Commitment, and Professionalism of Newly Employed Nurses. Image: Journal of Nursing Scholarship, v. 19, n. 1, 20-24. https://doi.org/10.1111/j.1547-5069.1987.tb00581.x
- arrow_upward Mueller, C. W.; McCloskey, J. C. (1990). Nurses' job satisfaction: A proposed measure. Nursing Research, v. 39, n. 2, 113-116. https://doi.org/10.1097/00006199-199003000-00014
- arrow_upward Organisation for Economic Co-operation and Development. (2021). Building a resilient recovery. How we can emerge stronger from the COVID-19 pandemic. https://www.oecd.org/coronavirus/en/
- arrow_upward Pan American Health Organization. (2021). COVID-19 Situation in the Region of the Americas. https://www.paho.org/en/topics/coronavirus-infections/coronavirus-disease-covid-19-pandemic
- arrow_upward Quintero Soto, M. L., González Velázquez, L. M.; García Lirios, C. (2021). Intellectual capital in the post Covid-19. Ageing Science & Mental Health Studies, v. 5, n. 1. https://doi.org/10.31038/ASMHS.2021512
- arrow_upward Quiroz Campas, C. Y.; García Lirios, C.; Molina González, M. R.; Carreón Valencia, O. I. (2020). Reliability and validity of an instrument that measures entrepreneurship of merchants in central Mexico. Investigación & Desarrollo, v. 28, n. 2, 6-22. https://doi.org/10.14482/indes.28.2.338.04
- arrow_upward Rincon-Ornelas, R. M.; Quiroz-Campas, C. Y.; Espinoza-Morales, F.; García-Lirios, C. (2021). Contrast of a model revision of the entrepreneurship in the Covid-19 era. Journal of Chemical and Pharmaceutical Sciences, v. 1, n. 2, 20-24.
- arrow_upward Sanchez-Sánchez, A.; Figueroa-Santiago, O.; Espinoza-Morales, F.; Molina-Ruíz, H. D.; Valdés-Ambrosio, O.; Fierro-Moreno, E.; García Lirios, C. (2020a). Estructura factorial confirmatoria de la gestión del conocimiento. Alternativas en Psicología, n. 44, 53-65. https://alternativas.me/numeros/2-uncategorised/226-estructura-factorial-confirmatoria-de-la-gestion-del-conocimiento
- arrow_upward Sánchez-Sánchez, A.; Valés-Ambrosio, O.; García-Lirios, C.; Amemiya-Ramirez, M. (2020b). Confiabilidad y validez de un instrumento que mide la gestión del conocimiento. Espacios en Blanco, v. 1, n. 30, 9-22. https://doi.org/10.37177/UNICEN/EB30-261
- arrow_upward Sandoval-Vázquez, F. R.; Bustos Aguayo, J. M.; Juárez-Nájera, M.; García-Lirios, C.; Amemiya, M. (2021). Empirical test of a model of attitudes and stigma towards Covid-19. Journal of Clinical Case Reports and Studies, v. 3, n. 3, 1-5.
- arrow_upward Trógolo, M. A.; Ledesma, R. D.; Medrano, L. A. (2019). Adaptación de la Aversion to Risk Taking Scale en Conductores Argentinos. Psykhe, v. 28, n. 1, 1-16. https://doi.org/10.7764/psykhe.28.1.1181
- arrow_upward World Health Organization. (2021). WHO Coronavirus (COVID-19) Dashboard. https://covid19.who.int/