Bibliometric Study of the Efficiency of Public Expenditure on Education*
Estudio bibliométrico de la eficiencia del gasto público en educación
Received: 21 June 2019
Accepted: 19 November 2019
Abstract
This bibliometric study analyzes the literature on the efficiency of public education expenditure using two types of bibliometric indicators: quantity (number of publications) and quality (impact by year, author, and journal). These indicators are calculated with worldwide results from the database Scopus from January 2000 to June 2018. The results were classified by author, journal, and publication country focusing on the methodological approach with the aim of identifying research trends in the field. The main results indicate the existence of a growing interest by scholars in the field since 2000, who have used different levels of comparative analysis (cross-country, regional, university, school, and student) and methods (parametric and nonparametric). In addition, nonparametric approaches have been most relevant in recent years thanks to the development of statistical software, their public access, and the possibility to work with a small database, which allows an easy implementation and use of cross-country comparisons. Finally, there is an evident lack of literature analyzing the efficiency of education expenditure in Latin American countries, which opens up a future line of research.
Keywords: Bibliometrics, education, public spending on education, non-parametric, parametric.
JEL Classification: A10.
Resumen
Este estudio bibliométrico analiza la literatura científica acerca de la eficiencia del gasto público en educación a través de dos tipos de indicadores bibliométricos: de cantidad (número de publicaciones) y calidad (impacto por año, autor y revista). Estos indicadores son construidos con los resultados arrojados por Scopus, a nivel mundial, desde enero de 2000 hasta junio de 2018. Los resultados están clasificados por autor, revista, país de publicación, haciendo énfasis en el enfoque metodológico, con el objetivo de identificar la tendencia de investigación en el área. Los resultados principales indican la presencia de un gran interés de los académicos en el campo desde el año 2000, quienes han usado diferentes niveles de análisis comparativos (entre países, regiones, universidades, colegios y estudiantes) y metodologías (paramétricas y no paramétricas). Además, el enfoque no paramétrico ha sido más relevante en años recientes con el desarrollo de softwares estadísticos, acceso público y la posibilidad de trabajar con bases de datos pequeñas, que permite una fácil implementación y el uso de comparaciones entre países. Finalmente, hay un rezago evidente en la literatura que analiza la eficiencia del gasto en educación en los países latinoamericanos, lo cual abre una futura línea de investigación.
Palabras clave: bibliometría, gasto público en educación, no paramétrica, paramétrica.
Clasificación JEL: A10.
1. INTRODUCTION
This article presents a bibliometric analysis of papers that have measured the efficiency of public education expenditure adopting parametric and non-parametric methodologies. The focus on the analysis of the efficiency of public spending is derived from the scarcity of public resources and the mounting pressure on governments to improve their allocation. Offering more public services with lower levels of public expenditure is an ongoing challenge for many countries, and only a few papers focus on government spending efficiency in the case of emerging countries, although they urgently need to better assign their limited resources allocated to education. This article is a guide for future researchers on this important topic, and it contributes to the literature by exploring the best way to measure efficiency and education performance based on the level of analysis and individual interests. In this sense, this paper makes a first contribution to the literature on bibliometric analysis of education efficiency by focusing on the measurement of different bibliometric indicators as a way to establish how concentrated the literature on this topic is in terms of authors, research centers, journals, and countries. It also investigates publication trends since January 2000 in order to advance the field in emerging and Latin American countries, where the efficiency of public resources has been highly debated but not recently tested.
The innovative element of this paper is that it is the first bibliometric study of articles measuring the efficiency of public education expenditure; thus, it represents a useful tool for future research in the area. As many papers have established, the objective of analyzing the efficiency of public spending is to answer one question: can countries obtain better performance results, in terms of public sectors, using the same resources? This is because public spending represents a key factor in a country’s growth and development (
This study presents three main results:
First, there has been an enormous interest of scholars in the field since 2000, but a decrease in 2015. More specifically, A. Aristovnik and A. Afonso are among the authors with the highest number of publications in the field of efficiency of spending on education.
Second, non-parametric approaches have been the most relevant methodologies in recent years thanks to the development of statistical software, their public access, and the possibility to work with a small database, which allows an easy implementation and use of cross-country comparisons. An indication of this recent focus is the keywords used in the papers, which reveal a strong tendency to implement non-parametric analyses, mainly the Data Envelopment Analysis –DEA- methodology. For example, 78 of the articles found in Scopus (22 %) include DEA, data envelopment analysis, stochastic frontier, or non-parametric as one of their keywords. This is a clear indication of the predominant methodology in the area. Some studies do not have keywords, and others do not indicate, in the abstract or title, the methodology that was used.
Third, there is an evident lack of literature analyzing efficiency of education expenditure in Latin American countries, which opens a future line of research.
This paper is organized as follows: Section 2 presents a brief literature review, Section 3 describes the methodology, Section 4 reports the main results, and, finally, the last part of the document draws conclusions.
2. THEORETICAL FRAMEWORK
Plenty of literature has analyzed the efficiency of public spending, but there is no consensus about the best methodology to use. In education literature, parametric studies use econometric techniques to identify causal relationships between student background, school variables, and educational outcomes. However, most of these studies do not consider the possibility of inefficiency in student, school, or country performance. Thus, recent literature has exhibited an increasing interest in applying frontier methods to evaluate said efficiency using nonparametric techniques such as DEA (Data Envelopment Analysis) and FDH (Free Disposal Hull) (
Studies that adopt nonparametric approaches have assessed the determinants of schooling quality using cross-country regressions for example,
On contrary, non-parametric approaches measure the efficiency of public spending on education by comparing the resources spent with the performance obtained from DEA and FHD analyses (
In 2018, many papers assessed the efficiency of public spending, mainly using nonparametric methodologies. Almost all the studies in that year focused their efficiency analyses on specific country groups, considering similar income levels or even the same regional location because of the difficulty of collecting comparable data in different countries and in order to avoid heterogeneity in the selected sample (
Other studies have analysed the efficiency of public expenditure using international comparisons without regard to income or regional variables. For instance,
Finally, to avoid heterogeneity in the sample in terms of wealth and development, some studies have used single-country analyses. For example,
In summary, in the variety of studies mentioned here, there is no consensus about the best methodology to measure efficiency, but the research trend is clearly concentrated on nonparametric techniques. Although
3. METHOD
This bibliometric study examined papers that measure the efficiency of education expenditure through parametric and non-parametric methodologies. As
Bibliometric studies are essential because there has been an increase in scientific discoveries, and published results are read and quoted by other researchers worldwide. There is an important and growing need to be up to date with recent research and methodologies and be in touch with the knowledge frontier. Therefore, they are useful tools to understand the best way to do something in a specific field.
Bibliometric studies assess databases using different indicators, which aim to determine impact, evolution, state of the art, and trends in a field of knowledge (
Quality indicators measure the relevance or influence of a researcher, journal, or research center based on the impact of their studies on the scientific community. For that purpose, such indicators estimate the number of citations of an author or journal by others. The higher the number of citations, the greater the impact or performance. Authors with many published papers are not necessarily those with the highest impact on the generation of new knowledge. This depends on the type of journal, innovative methodology, dataset, or year of publication.
Currently, many databases could be used to conduct bibliometric analyses, including Google Scholar, Scopus, Econ Lit, and the Web of Science. However, the Web of Science has been the main source of scientific evaluation because it includes publications from all areas of knowledge. Scopus is also a good alternative to the Web of Science because of its advantages (
This paper represents a useful tool for analyzing the measurement of the efficiency of spending on education, and it provides summarized results of the leading methodological trends in the literature. The focus of this study is on productivity indicators, such as number of articles per year, author, and journal. As
The h-index is highly correlated with number of publications and citations, and its main advantage is that it combines a measure of quantity and impact into a single indicator (
In this work, the search process in Scopus was limited to research published between January 2000 and December 2018 that used the following keywords: public spending, education, efficiency and parametric. After the results were obtained, the studies were selected from four areas: Social Sciences; Economics, Econometrics and Finance; Business, Management and Accounting; and Decision Sciences. The search was not limited in terms of source or document type.
The search equation used here is based on key variables or terms such as public spending, education, efficiency and parametric. The equation is the following:
( ALL ( public AND spending ) AND TITLE-ABS-KEY ( education ) AND TITLE-ABS-KEY ( efficiency ) OR TITLE-ABS-KEY ( parametric ) ) AND ( LIMIT-TO ( SUBJAREA , "SOCI" ) OR LIMIT-TO ( SUBJAREA , "ECON" ) OR LIMIT-TO ( SUBJAREA , "BUSI" ) OR LIMIT-TO ( SUBJAREA , "DECI" ) ).
This equation retrieved a total of 386 results or documents. All the articles included the terms public spending, education, efficiency, and parametric in their title, abstract, or keywords.
4. RESULTS
These results are sorted by author, journal, publication, country, and information sources using two bibliometric indicators: quantity and quality.
Quantity indicators
Using the previous search equation, this section presents different quantity indicators: number of documents published per year, number of documents per author (as a measurement of the productivity of authors), h-index of the top 10 authors, number of articles per journal, and articles per country. Figure 1 shows a very volatile growth in the number of papers published since 2000; nevertheless, since 2015, the tendency has been clearly positive.
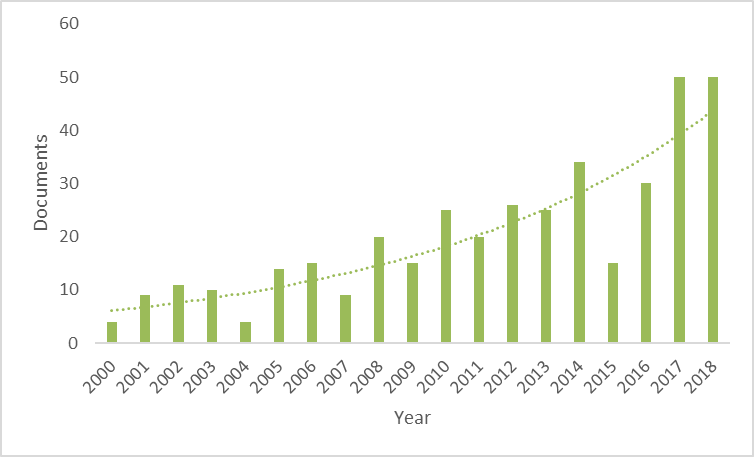
Figura 1. Número de documentos por año
Source: Created by the authors based on information from Scopus.
To understand the amount of research into this topic, Figure 2 presents the cumulative quantity of documents during said period. This graph is essential to show the progress of research in this field. The tendency is very close to a second-order polynomial distribution. For example, the number of publications expected for 2019 (399) was estimated using the cumulative number of publications from 2000 to 2018 and the regression curve created with the model.

Figura 2. Cantidad acumulada de documentos
Source: Created by the authors based on information from Scopus.
Figure 3 shows the number of documents per author. For example, Aristovnik, Afonso, Agasisti, and Barra are the main authors in this topic, publishing 7, 6, and 5 articles, respectively, since 2000. Aristovnik has focused his research on the measurement of public sector performance. He studied the efficiency of different sectors, such as education, health, and Research and Development, which are policy areas where resources are significantly limited (mainly in developed countries), applying a non-parametric approach: Data Envelopment Analysis. In this methodology, the relative efficiency score of a country or institution is defined as the deviation from the efficiency frontier, which represents the maximum output/outcome attainable from each input level.
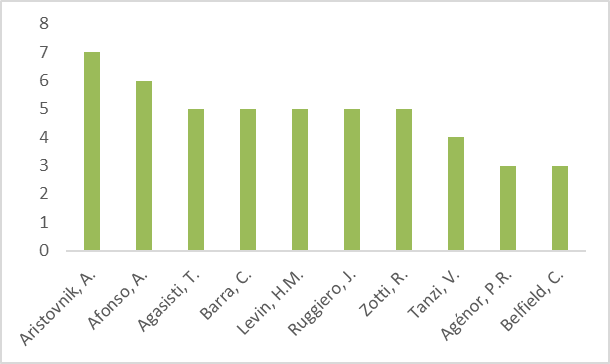
Figura 3. Cantidad acumulada de documentos
Source: Created by the authors based on information from Scopus.
Afonso has assessed nonparametric, parametric, and semiparametric approaches to measure the efficiency of education, mainly in European countries. In his latest article, he conducts a dynamic regional analysis in Tunisia, where he measures the efficiency of basic and secondary education. This could be a very useful research topic for those interested in comparing the efficiency of resources spent by different regions or municipalities using a dynamic approach, given the availability of microdata.
Agasisti implemented a nonparametric methodology (Data Envelopment Analysis, DEA) to measure efficiency in education spending in all his papers. The most recent article by Agasisti assesses the efficiency of schools in 30 countries using microdata from PISA scores of 8,500 schools, but in that paper he compares two methods: DEA and stochastic frontier analysis.
Barra has focused his work on analyzing education in Italy mainly using a DEA methodology. His latest publication is concerned with the current construction of rankings for higher education institutions, and he questions if econometric methodologies matter in order to rank universities. Given that the funds for higher education in Italy depend on performance indices, measuring how well universities perform has become extremely popular and the subject of increased attention. Therefore, the methods of analysis employed in order to rank universities do matter, which suggests that university rankings should be handled with extreme caution.
Among review documents related to the topic, the latest article in Colombia was published by
Following these contributions, future research can focus on the efficiency analysis of financial institutions and higher education institutions, taking advantage of microdata sets and applying a DEA methodology.
Figure 4 presents the number of documents published in different journals or sources. The most important journal to publish about this topic is Education Economics, followed by Economics of Education Review, Applied Economics, and the International Journal of Educational Development. Education Economics pays particular attention to the quantitative aspects of educational management, but it also encourages applied works with policy implications. The scope of Economics of Education Review includes applied studies into education policy and finance, as well as returns to human capital, using micro data. Finally, the purpose of the International Journal of Educational Development is to analyze the impact of education on progress (defined as economic growth), poverty, human development, well-being, human rights, democracy, social cohesion, peace building, and environmental sustainability.

Figura 4. Número de documentos por revista
Source: Created by the authors based on information from Scopus.
Using these data, I analyzed the percentage of journals or authors responsible for publishing in this area. For that purpose, I used the Pareto Law, which establishes that 20 % of the journals or authors produce 80 % of the articles. These data do not obey the Pareto Law because 35 % of the journals publish 80 % of the articles.
After classifying the journals into importance levels (quantiles), the results show that 5 % of the journals publish 25.3 % of the articles; 16 % of the journals publish 50.2 % of the documents; and 30 % of the journals publish 75.1 % of the papers. Figure 5 presents an equitable distribution of articles, which means there is no dominance of a single journal publishing in the field.
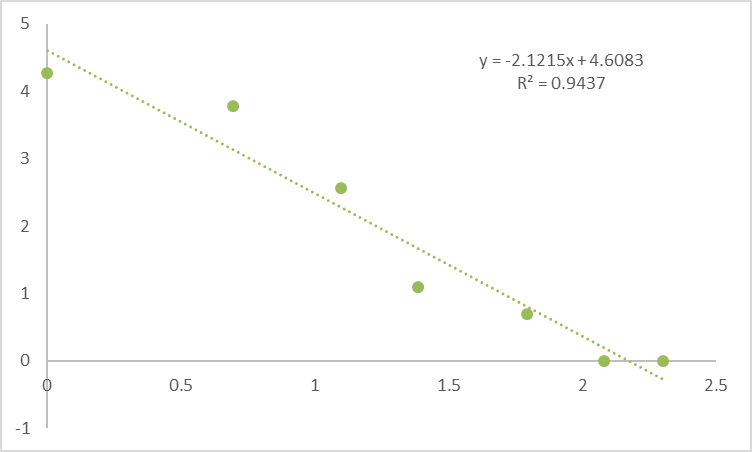
Figura 5. Número de documentos por revista
Source: Created by the authors based on information from Scopus.
Figure 6 presents the number of articles per country. The United States is in the first place, followed by the United Kingdom and Germany. It is interesting to note in this graph that, although the highest levels of inefficiency of public resources spent on education are found in developing countries, the topic generates more interest and research in industrialized countries. Only one country in South America is in the top 10 of nations publishing articles about the efficiency of public spending: Brazil.

Figura 6. Número de documentos por país
Source: Created by the authors based on information from Scopus.
In accordance with the previous quantity indicators, this study shows a positive trend in the number of articles that measure the efficiency of spending on education, mainly using nonparametric methodologies such as Data Envelopment Analysis. Additionally, research in this field is not concentrated in some authors or journals; in other words, there is no dominance of a single journal or author publishing about the topic. Nevertheless, studies are highly concentrated in developed countries, such as the United States and the United Kingdom, which hold the largest share of scientific publications worldwide.
Quality indicators
Quality indicators or performance indicators reflect the level of quality of a researcher or journal. They are used to measure the impact of a study on the scientific community per year, journal, or author.
The following chart shows the impact of the literature in this field since 2000 (Figure 7). The impact per year was measured as the ratio between number of citations and number of papers published every year. As shown, the impact level has been very volatile, with peaks in 2002 and 2006. Since then, there has been a decreasing trend, but this is reasonable because recent articles include less citations than previous ones.

Figura 7. Impacto por año
Source: Created by the authors based on information from Scopus.
Figure 8 presents the impact per author. The impact level is measured as the ratio between number of papers by each author and the number of citations they have received. There is a significant difference between the number of documents by author presented in Figure 3 and their relevance or impact on the academic community. Thus, authors with many papers published during 2000 and 2018, such as Aristovnik and Afonso (with 7 and 6 publications into the subject, respectively), are not necessarily those with the highest impact on the generation of new knowledge. In this case,
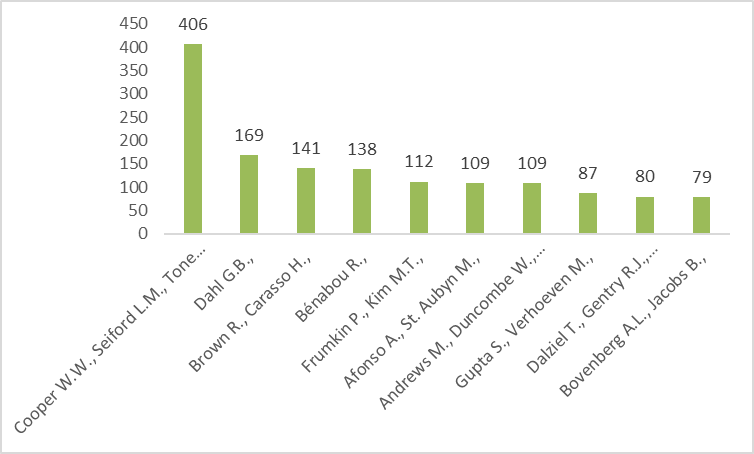
Figura 8. Impacto por autor
Source: Created by the authors based on information from Scopus.
For this reason, Table
1 shows the h-index calculated directly in Scopus as a measure of quantity and
impact in the same indicator. In this case, Levin, Belfield and, Afonso
presented the highest index, which means that they have at least 20 papers that
have received 20 or more citations (
Tabla 1. Índice H

Finally, Figure 9 presents the impact per journal or type of source (since the search in Scopus was no limited to a specific type of source), measured as the ratio between number of articles of each journal and the number of citations. In the first place of impact is Introduction to Data Envelopment Analysis and its uses: with DEA-solver software and references, a book focused on a statistical and nonparametric tools to measure inefficiencies and evaluate the performance of different entities. In the second place is Econometrica, an important journal publishing in all areas of economics; its objective is to unify theoretical-quantitative and empirical-quantitative approaches to solve economic problems. As expected, many of these journals are specialized in economics or education.
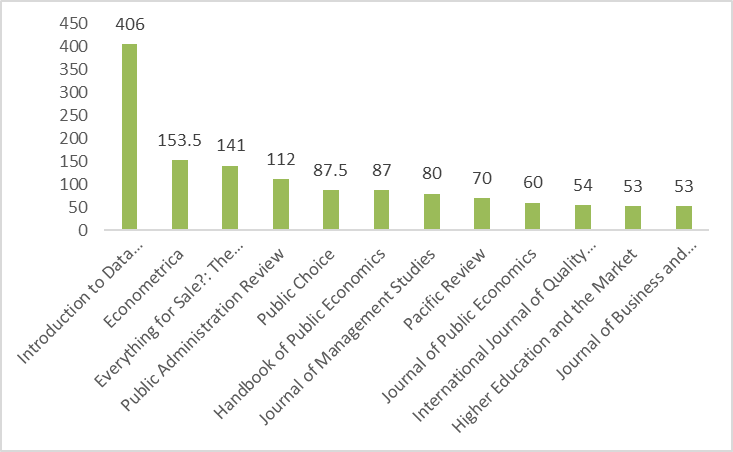
Figura 9. Impacto por revista
Source: Created by the authors based on information from Scopus.
The previous quality and quantity indicators show substantially different results in terms of authors and journals. That means that authors and journals who publish more articles do not necessarily achieve the highest levels of impact on the scientific community. These results provide clear insight for future researchers who have the ambition of exerting an important impact on the academic community in terms of popular journals to publish their contributions about the measurement of efficiency of education resources.
5. DISCUSSION
This paper presented a bibliometric analysis of education efficiency, primarily focused on methodological approaches used to rate education performance.
Although research in this field is not concentrated in some authors or journals, it is highly concentrated in developed countries, such as the United States and the United Kingdom, which hold the highest share of scientific publications worldwide. Future studies can assess the efficiency of spending in emerging and developing countries, such as Latin American nations, where the efficiency of public resources has been highly debated but not recently tested. This could be used to ensure that public resources, which are significantly limited, are spent efficiently and identify the policy areas that require more attention. Also it could help to answer the following question: can countries, municipalities, or institutions achieve better performance results using the same resources? Due to the scarcity of public resources and the mounting pressure on governments to improve their allocation, the study and measurement of the efficiency in the use of these resources should lead to new efforts in the agenda of the scientific community.
Moreover, recent research trends have shown the importance of regional and dynamic studies in this field. In the case of Colombia, microdata such as those from standardized tests (e.g., Saber Pro or Saber TyT) could be used in future studies to measure the efficiency of education spending in higher education institutions in Colombia or to compare institutions in the same department using municipalities as units of analysis. Even inside each higher education institution, researchers could be interested in studying the efficiency of resources allotted to each academic program to achieve better results. In those terms, dynamic analysis is needed to make short-, medium-, and long-term goals achievable, which requires the calculation of efficiency indicators year after year as the main input and guidance for university managers to approve budget policies.
Following the latest publication by
Moreover, the easy application of DEA methodologies to measure efficiency represents an enormous incentive to extrapolate studies analyzing efficiency in financial institutions (bank efficiency), where data availability is not a problem, and other problematic policy areas.
6. CONCLUSIONS
This bibliometric study examined papers that measure the efficiency of public education expenditure applying different quantity and quality indicators calculated with information collected from Scopus between January 2000 and December 2018. Two results can be highlighted: (1) this field has attracted many researchers since 2000, and (2) said attraction is related to the use of advanced nonparametric methodologies such as Data Envelopment Analysis. The reason behind the increasing use of this methodology is related to the development of statistical software, its public access, and the possibility to work with a small database, which allows an easy implementation and use of cross-country comparisons.
An interesting result is that, although it is an important topic with a positive research trend (as shown by quantity indicators), academic research is concentrated in industrialized countries and very few European authors. Latin American and emerging countries exhibit an evident lack of studies in this area, which opens up a new line of research.
In terms of the main authors in the field, Levin, Belfield, and Afonso have the highest h-index. In their case, they have at least 20 papers that have received 20 or more citations. Nevertheless, Aristovnik and Afonso achieved the highest level of publication in the area. They have concentrated their analysis in the study of efficiency of public expenditure at different levels (education, health, public sector, etc.) applying a nonparametric methodology.
Studies in the field are mainly published in education and economics journals, such as Education Economics, Economics of Education Review, International Journal of Educational Development, and Econometrica, which are prestigious publications with high impact levels. However, a book has an enormous importance in the topic (i.e., the highest impact level) and represents an essential reading for new researchers in the area: Introduction to Data Envelopment Analysis and its uses: with DEA-solver software and references.
Finally, the variety of bibliometric indicators discussed above confirms that the efficiency of public resources should be evaluated, much more so in education, which is the key driver of economic growth and social wellbeing.
7. REFERENCES
- arrow_upward Afonso, A., & St Aubyn, M. (2005). Non-Parametric Approaches to Education and Health Efficiency in OECD Countries. Journal of Applied Economics, 8(2), 227-246. https://doi.org/10.1080/15140326.2005.12040626
- arrow_upward Afonso, A., Schuknecht, L., & Tanzi, V. (2005). Public sector efficiency: An international comparison. Public Choice, 123(3-4), 321-347. https://doi.org/10.1007/s11127-005-7165-2
- arrow_upward Afonso, A., & Aubyn, M. S. (2006). Cross-country efficiency of secondary education provision: A semi-parametric analysis with non-discretionary inputs. Economic Modelling, 23(3), 476-491. https://doi.org/10.1016/j.econmod.2006.02.003
- arrow_upward Afonso, A., Schuknecht, L., & Tanzi, V. (2010). Public sector efficiency: Evidence for new EU member states and emerging markets. Applied Economics, 42(17), 2147-2164. https://doi.org/10.1080/00036840701765460
- arrow_upward Afonso, A., Romero-Barrutieta, A., & Monsalve, E. (2013). Public sector efficiency: Evidence for Latin America. ISEG Economics Working Paper No. 20/2013/DE/UECE. https://doi.org/10.2139/ssrn.2365007
- arrow_upward Agasisti, T. (2014). The Efficiency of Public Spending on Education: an empirical comparison of EU countries. European Journal of Education, 49(4), 543-557. https://doi.org/10.1111/ejed.12069
- arrow_upward Agasisti, T., & Zoido, P. (2018). Comparing the Efficiency of Schools Through International Benchmarking: Results from an Empirical Analysis of OECD PISA 2012 Data. Educational Researcher, 47(6), 352-362. https://doi.org/10.3102/0013189X18777495
- arrow_upward Arias Ciro, J. & Torres García, A. (2018). Economic efficiency of public secondary education expenditure: How different are developed and developing countries? Desarrollo y Sociedad, (80), 119-154. https://doi.org/10.29263/dys.80.4
- arrow_upward Aristovnik, A. (2013). Relative Efficiency of Education Expenditures in Eastern Europe: A Non-parametric Approach. Journal of Knowledge Management, Economics and Information Technology, 3(3), 1-4. https://EconPapers.repec.org/RePEc:spp:jkmeit:1379
- arrow_upward Barra, C., Lagravinese, R., & Zotti, R. (2018). Does econometric methodology matter to rank universities? An analysis of Italian higher education system. Socio-Economic Planning Sciences, 62(C), 104-120. https://doi.org/10.1016/j.seps.2017.09.002
- arrow_upward Baier-Fuentes, H., Merigó, J. M., Amorós, J. E., & Gaviria-Marín, M. (2018). International entrepreneurship: A bibliometric overview. International Entrepreneurship and Management Journal, 15(2), 385-429. https://doi.org/10.1007/s11365-017-0487-y
- arrow_upward Bonilla, C. A., Merigó, J. M., & Torres-Abad, C. (2015). Economics in Latin America: A bibliometric analysis. Scientometrics, 105(3), 1239-1252. https://doi.org/10.1007/s11192-015-1747-7
- arrow_upward Cooper, W. W., Seiford, L. M., & Tone, K. (2006). Introduction to Data Envelopment Analysis and Its Uses. https://doi.org/10.1007/0-387-29122-9
- arrow_upward Cordero Ferrera, J. M., Pedraja Chaparro, F., & Simancas Rodríguez, R. (2015). Factors promoting educational attainment in unfavorable socioeconomic conditions. Revista de educación, (370), 172-198. https://sede.educacion.gob.es/publiventa/d/20500/19/0
- arrow_upward Cordero, J. M., Polo, C., Santín, D., & Simancas, R. (2018). Efficiency measurement and cross-country differences among schools: A robust conditional nonparametric analysis. Economic Modelling, 74(C), 45-60. https://doi.org/10.1016/j.econmod.2018.05.001
- arrow_upward Costas, R. & Bordons, M. (2007). The h-index: Advantages, limitations and its relation with other bibliometric indicators at the micro level. Journal of Informetrics, 1(3), 193–203. https://doi.org/10.1016/j.joi.2007.02.001
- arrow_upward Dahl, G. B. (2002). Mobility and the Return to Education: Testing a Roy Model with Multiple Markets. Econometrica, 70(6), 2367-2420. https://www.jstor.org/stable/3081990
- arrow_upward De Witte, K., & López-Torres, L. (2017). Efficiency in education: A review of literature and a way forward. Journal of the Operational Research Society, 68(4), 339-363. https://doi.org/10.1057/jors.2015.92
- arrow_upward Diaz Castro, J., & de Jorge Moreno, J. (2018). Analysis of efficiency and explanatory management factors in the municipalities of Meta, Colombia. Finanzas y Política Económica, 10(1), 211-234. https://doi.org/10.14718/revfinanzpolitecon.2018.10.1.9
- arrow_upward Durieux, V. & Gevenois, P. A. (2010). Bibliometric Indicators: Quality Measurements of Scientific Publication. Radiology, 255(2). 342-351. https://doi.org/10.1148/radiol.09090626
- arrow_upward Emami, R., Ghoorchian, N., & Jafari, P. (2019). Study of the attitudes of students, faculty members and training experts to the educational performance evaluation standards in faculty members of the Payam Noor University of Tehran. Dilemas Contemporáneos: Educación, Política y Valores, 7(1), 1-20. https://www.masader.om/eds/detail?db=eue&an=139026855&isbn=20077890
- arrow_upward Fuchs, T., & Wößmann, L. (2007). What accounts for international differences in student performance? A re-examination using PISA data. Empirical Economics, 32, 433-464. https://doi.org/10.1007/s00181-006-0087-0
- arrow_upward Gnewuch, M., & Wohlrabe, K. (2018). Super-efficiency of education institutions: an application to economics departments. Education Economics, 26(6), 610-623. https://doi.org/10.1080/09645292.2018.1471663
- arrow_upward Gralka, S. (2018). Persistent inefficiency in the higher education sector: evidence from Germany. Education Economics, 26(4), 373-392. https://doi.org/10.1080/09645292.2017.1420754
- arrow_upward Guccio, C., Martorana, M. F. & Mazza, I. (2017). The efficiency change of Italian public universities in the new millennium: a non-parametric analysis. Tertiary Education and Management, 23(3), 22-236. https://doi.org/10.1080/13583883.2017.1329451
- arrow_upward Gupta, S., & Verhoeven, M. (2001). The efficiency of government expenditure: Experiences from Africa. Journal of Policy Modeling, 23(4), 433-467. https://doi.org/10.1016/S0161-8938(00)00036-3
- arrow_upward Herrera, S., & Pang, G. (2005). Efficiency of public spending in developing countries: an efficiency frontier approach (Policy Research No. 3645 Working Paper Series). The World Bank.
- arrow_upward Kaur, H., & Bhalla, G. S. (2018). Evaluating the resource use efficiency of government colleges in Punjab (India): A data envelopment analysis. International Journal of Law and Management, 60(3), 804-813. https://doi.org/10.1108/IJLMA-03-2017-0074
- arrow_upward Kosor, M. M., Perovic, L. M., & Golem, S. (2019). Efficiency of public spending on higher education: a data envelopment analysis for eu-28. Problems of Education in the 21stcentury, 77(3), 396-409. https://doi.org/10.33225/pec/19.77.396
- arrow_upward Lee, J. W., & Barro, R. J. (2001). Schooling Quality in a Cross Section of Countries. Economica, 68(272), 465-488. https://doi.org/10.3386/w6198
- arrow_upward Medha, J. (2014). Bibliometric Indicators for Evaluating the Quality of Scientific Publications. The Journal of Contemporary Dental Practice, 15(2), 258-262. https://doi.org/10.5005/jp-journals-10024-1525
- arrow_upward Ouertani, M. N., Naifar, N., & Ben Haddad, H. (2018). Assessing government spending efficiency and explaining inefficiency scores: DEA-bootstrap analysis in the case of Saudi Arabia. Cogent Economics and Finance, 6(1), 1-16. https://doi.org/10.1080/23322039.2018.1493666
- arrow_upward Papadimitriou, M., & Johnes, J. (2018). Does merging improve efficiency? A study of English universities. Studies in Higher Education, 44(8), 1454-1474. https://doi.org/10.1080/03075079.2018.1450851
- arrow_upward Salazar Cuellar, A. F. (2014). The Efficiency of Education Expenditure in Latin America and Lessons for Colombia. Desarrollo y Sociedad, (74), 19-67. https://doi.org/10.13043/dys.74.1
- arrow_upward Sancho, R. (1990). Indicadores bibliométricos utilizados en la evaluación de la ciencia y la tecnología: revisión bibliográfica. Revista Española de Documentacion Científica, 13(3-4), 842-865.
- arrow_upward Wolszczak-Derlacz, J. (2017). An evaluation and explanation of (in)efficiency in higher education institutions in Europe and the U.S. with the application of two-stage semi-parametric DEA. Research Policy, 46(9), 1595-1605. https://doi.org/10.1016/j.respol.2017.07.010
- arrow_upward * This article is derived from the project entitled "Bibliometric Study of the Efficiency of Public Expenditure on Education" and has been financed with own resources.