Evaluating the Throughput of Real-time Distance Education Services Supported by a Mobile Ad Hoc Network
Evaluación del throughput de servicios de teleeducación en tiempo real soportados en una red móvil Ad-Hoc
Received: June 23, 2020
Accepted: November 11, 2020
Available: January 29, 2021
B. Ospina-Cifuentes; A. Montoya-Benítez; G. D. Góez; R. Alvarado-Jaimes,“Evaluating the Throughput of Real-time Distance Education Services Supported by a Mobile Ad Hoc Network”, TecnoLógicas, vol. 24, nro. 50, e1719, 2021. . https://doi.org/10.22430/22565337.1719
Highlights
Abstract
Tele-education went from being an option to becoming a necessity given the current public health problems. Due to this, the educational sector has included blended courses as part of its training offer. Mobile Ad Hoc Networks (MANETs) will therefore, become an important resource to work, under this class format, with students outside the classroom, in accordance with the standards recommended inside a university campus. MANETs require certain parameters that ensure the quality of communications and identify the factors that influence Quality of Service (QoS). The purpose of this study is to determine the factors that affect the quality of communications in a tele-education environment. For this purpose, the QoS of a MANET supporting a real-time video streaming is evaluated based on throughput. As a result, the main factors that directly or indirectly affect the operation of the network could be identified, which may help in making decisions regarding aspects such as the number of nodes and the node mobility speed. Moreover, the versatility and scalability of the MANET was proven, as when the number of nodes went from 5 to 10, throughput increased by 14%. This also occurred with the transmission rate factor when the video was streamed in a channel with a variable bitrate (64–4096 kbps).
Keywords: Mobile Ad Hoc Network (MANET), Tele-education, Throughput, Quality of Service (QoS), Real-Time Services.
Resumen
Hoy en día, la teleeducación pasó de ser una opción a una necesidad provocada por problemas de salud pública. Por ello, el sector educativo ha adoptado, como parte de su oferta formativa, el formato de cursos semipresenciales. Por tanto, la red móvil ad hoc network (MANET) debe ser un recurso importante para trabajar bajo este formato con estudiantes fuera del aula según las normas recomendadas dentro del campus universitario. Esta red requiere parámetros que aseguren la calidad de la comunicación e identifiquen los factores que inciden en la calidad del servicio (QoS). Este trabajo tiene como objetivo determinar los factores que afectan la calidad de la comunicación en un entorno educativo mediante la evaluación de la QoS de la red a través del parámetro throughput con la transmisión de un servicio de teleeducación en tiempo real como el video streaming soportado en una MANET. Como resultado se pudo identificar los principales factores que afectan de forma directa o indirecta el funcionamiento de la red para poder tomar decisiones con respecto al número de nodos y a la velocidad de movilidad de estos, entre otros. De esta forma, fue posible demostrar la versatilidad y escalabilidad de la MANET que, al aumentar la red de 5 a 10 nodos, incremento el throughput en un 14 %. Igualmente sucedió con el factor de tasa de transmisión con la emisión de un video compartiendo un canal con una velocidad de bits variable de 64 – 4096 kbps.
Palabras clave: red móvil ad hoc (MANET), Tele-educación, Throughput, Calidad de Servicio (QoS), Servicios en tiempo real.
1. INTRODUCTION
A Mobile Ad Hoc Network (MANET) is an autonomous system of wirelessly connected nodes that are free to move in any direction, which implies a completely dynamic topology.
This characteristic makes MANETs unpredictable from a scalability standpoint [
Moreover, these nodes have a limited capacity in terms of Central Processing Unit (CPU), storage, battery life, bandwidth, and transmission range. Because of its dynamic topology, the routing protocols for this type of network must discover the routes in a dynamic manner.
Such protocols are designed to route the network traffic, thus avoiding congestion, link failure, and many other factors. The lack of links often leads to packet drop or transmission delays. As a result, messages become time-constrained and are characterized by their timely delivery. To mitigate these problems, multiple studies have investigated the various protocols at the different layers of a MANET (e.g., Logical Link Control (LLC), Medium Access Control (MAC), and routing), which should be optimized, as well as the effect of their interaction with the other protocols [
The performance of a MANET supporting real-time distance education services can be analyzed using different quantitative or qualitative metrics or indicators. Qualitative indicators are those factors whose desirable attributes make them efficient for use in the wireless environment of the ad-hoc network. These may include operation based on power demand in case consumption is a major issue, freedom of loop, security, and one-way link support. Quantitative metrics comprise statistical data that can be used to evaluate the performance of the routing protocols, including Packet Delivery Ratio (PDR), throughput, delay, routing overhead, jitter, and packet drop fraction [
The objective of this study is to evaluate the Quality of Service (QoS) of a MANET supporting a real-time distance education service. QoS can also be assessed in infrastructure-based networks as reported by the authors of [
The rest of this paper is organized as follows. Section 2 explores the literature related to this research field. Section 3 details the experimental design used in this study and analyzes the results. Section 4 conclusions and Section 5 future work. Finally, Section 6 lists the bibliographic references.
2. Literature review
2.1 State of the Art
To evaluate the performance of a MANET supporting real-time distance education services, several indicators should be comparatively analyzed under certain factors. For this reason, the performance metrics and the factors that affect them must be established.
Statistical Design of Experiments (DoE) is a strategy implemented to quantify the main effects of factors and their interactions on the required indicators. The response surface factorial design methodology follows a Taguchi approach, which alludes to some DoE strategies frequently employed by many researchers to identify the effects of several factors on each metric. The DoE strategy is essentially used to improve the design process. Some studies in this research field are detailed below.
In [
In [
In [
Regarding robustness and automation in the Extract, Transform, Load (ETL) process in data warehousing, the authors of [
In [
Security is a critical issue in mobile networks. Nowadays, communication via mobile devices is necessary; however, their use is restricted due to the presence of attacks. Encrypted authentication and data encryption are techniques employed to protect devices against such threats. In [
2.2 Theoretical Framework
In a few words, MANETs are autonomous wireless networks that comprise nodes with a certain movement capacity. They may, of course, contain wired and fixed nodes.
The main feature of MANETs is their great flexibility, which enables the spontaneous creation of a network at any location, without the need for a pre-existing network infrastructure (e.g., routers or a wired installation). Therefore, in certain scenarios, such as a crisis, MANETs may offer the only feasible communications solution because:
-The facilities do not have a communications infrastructure or have been seriously damaged.
-Predicting all communication needs is impossible and, therefore, flexibility is essential [
Technological tools are used for educational activities in which students and teachers do not need to be in the same physical space at the same time [
Distance education can be defined as a combination between distance training and distance learning. The former involves a student–instructor interaction in which the instructor acts as a guide in students’ educational process, while the latter represents an information system in which students are the only responsible for their education, which is based on academic materials [
Distance education can be:
- Asynchronous
- E-mail messaging
- Discussion forums
- Synchronous (or real-time)
- Videoconference
- Chat rooms
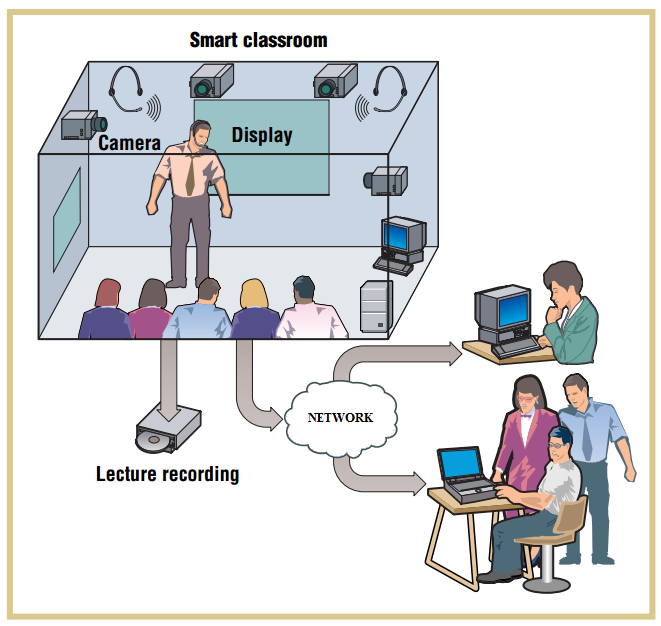
Figure 1 illustrates a technology scenario of real-time distance education and services. Other Tele-education services may include:
- Telecommunications networks
- Telematic services
- Applications
- Content
- Going beyond knowledge transmission
- Complementing with cooperative learning
- The Web as a tool
- Shared spaces and cooperation
- Multimedia servers
- More interactivity
- Synchronous applications
- Audio and video
- Virtual reality [
3. Methods and materials
3.1 Methodology
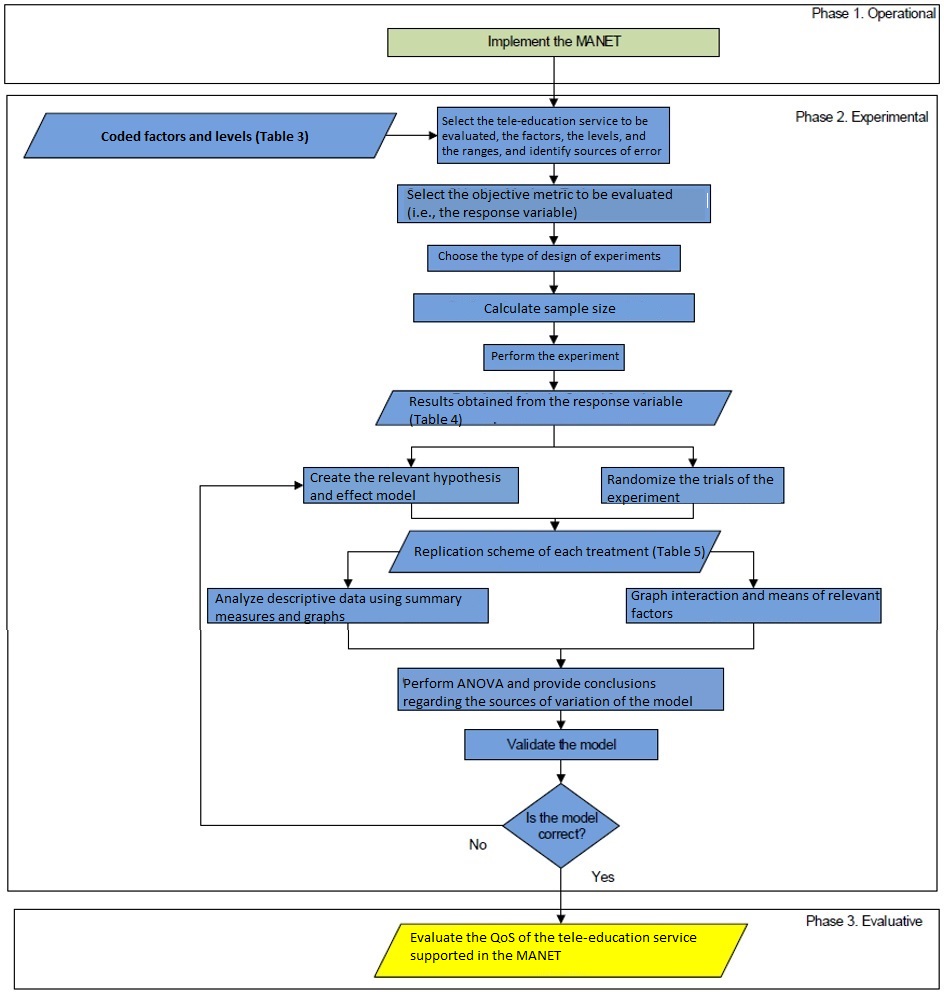
The methodology proposed to evaluate the QoS of real-time tele-education services, such as a video streaming supported in a MANET, which allows verifying whether this network can serve as a communication infrastructure, is made up of three phases.
In the first phase (the operational one), the MANET is implemented. The second phase (the experimental one) is based on an adaptation of the DoE methodology, which is one of the most widely used statistical techniques to optimize experimentation. This methodology is defined as a method to systematically apply statistics to the experimentation process [
More precisely, it can be defined as the application of a set of tests in which voluntary changes are made to the control parameters of a process or system in order to observe and identify the reasons for changes in the output or response variable of the process [
To obtain objective and subjective conclusions, an experimental evaluation must comprise two fundamental and interrelated components: (1) an experimental design, which refers to the planning process of the experiment so that the data can be collected, in a viable manner, for statistical analysis; and (2) an efficient statistical analysis of the data [
The third phase (the evaluative one) consists in the verification or evaluation of the QoS once the problem to be solved has been identified. Figure 2 presents the proposed methodology.
3.2 Testbed, Design, and Implementation
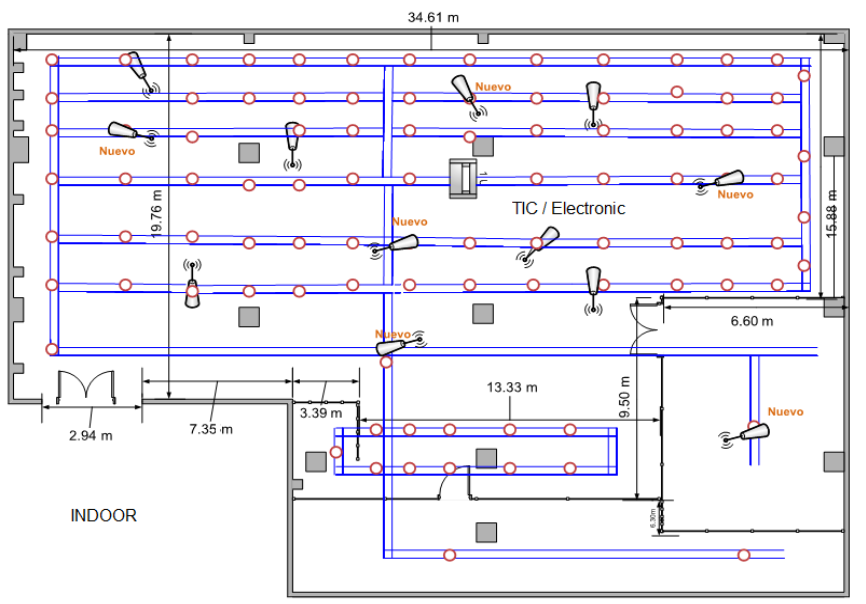
The experiment was conducted in the Center of Advanced Manufacturing Technology (CTMA for its Spanish acronym) at SENA (the Colombian National Training Service). The scenario consisted of two spaces: an outdoor 100-square meter area on a second floor (called the Lobby & Cafeteria) and an indoor 50-square meter area on the third floor (called the ICT/Electronics Lab). The testbed comprised ten nodes equally distributed in the two spaces.
All the nodes shared the same technical features: HP ProBook 6475b laptops with an AMD A10-4600M quad-core 2.3-GHz processor, a 6-GB RAM memory, and an Atheros AR9485 802.11 b/g/n integrated Wi-Fi adapter operating in “n” mode. Additionally, a Samsung Galaxy S3 (GT-I9300) smartphone with a quad-core 1.4-GHz processor, a 1-GB RAM memory, and an 802.11 b/g/n integrated Wi-Fi adapter operating in “n” mode was used to manage the MANET.
In a testbed, there are two systematic traffic sources that cannot be eliminated: (1) interconnected wireless access points within the campus, which cause interference and occupy the available bandwidth (which is typical in an academic environment); and (2) traffic control due to the Secure Shell (SSH) program, which is used to remotely start and control the measurement software on the source node.
To generate traffic and emulate real-time distance education services supported by a MANET, a network personal digital video recorder (npDvr)software [
The MANET was implemented and managed using a smartphone app called MANET MANAGER (shown in Figure 3) [

The following setting was used for the other nodes:Open Windows 7 Network and Sharing Center (Figure 4) in each computer.

-Select the MANET.
-Double click to connect.
-Set a static IP address for the other devices in the network in the 192.168.1.0/24 range, as can be seen in Table 1, without using the 192.168.1.1 IP address, which is reserved for the network administrator device.
| DEVICE NAME: | IP | MASK |
| SMARTPHONE: MANET ADMINISTRATOR. | 192.168.1.1 | 255.255.255.0 |
| PC_A: STREAMING SERVICE GENERATOR. | 192.168.1.2 | 255.255.255.0 |
| PC_B | 192.168.1.3 | 255.255.255.0 |
| PC_C | 192.168.1.4 | 255.255.255.0 |
| PC_D | 192.168.1.5 | 255.255.255.0 |
| PC_E | 192.168.1.6 | 255.255.255.0 |
| PC_F | 192.168.1.7 | 255.255.255.0 |
| PC_G | 192.168.1.8 | 255.255.255.0 |
| PC_H | 192.168.1.9 | 255.255.255.0 |
| PC_I | 192.168.1.10 | 255.255.255.0 |
| PC_J | 192.168.1.11 | 255.255.255.0 |
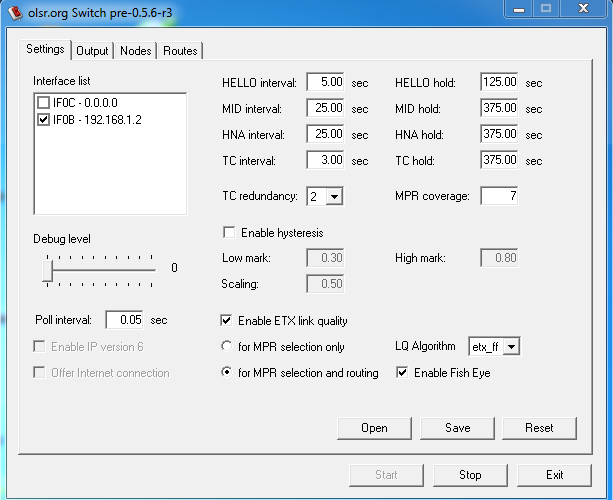
-Install and run the Optimized Link State Routing (OLSR) software (OLSR Switch) [
-Install the app MANET VISUALIZER in the administrator device [
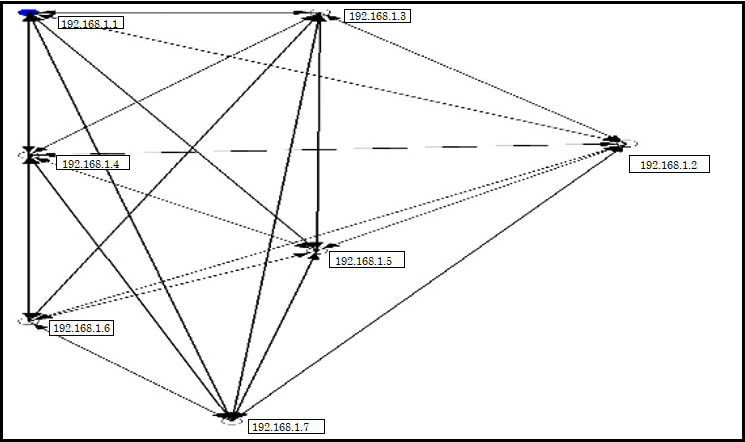
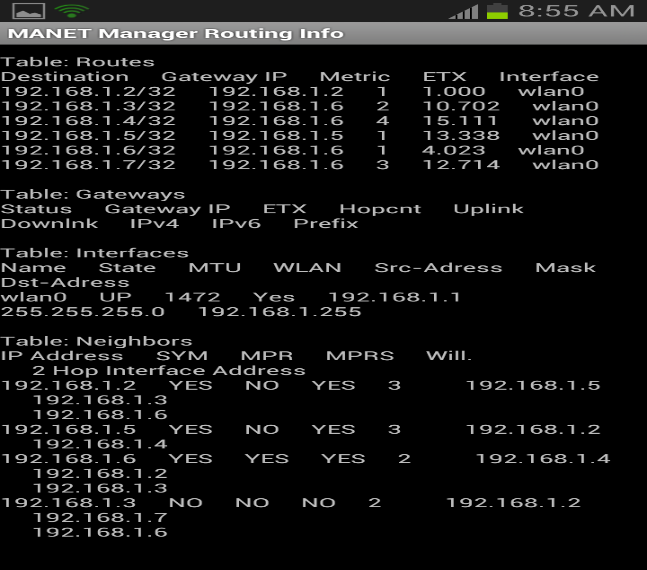
-Using the administrator device of the MANET, with MANET MANAGER previously installed, the user can view different tables of the MANET (e.g., routing, topology, and neighbor table, among others) and execute some evaluation parameters, as can be seen in Figure 7.
3.3 Experimental Scenario
The testbed provides an experimental platform to evaluate different real-time distance education services supported by a MANET using actual parameters. Moreover, several network topologies and scenarios can be implemented to analyze and evaluate such services considering multiple metrics.
This work considers different considerations:
-The experiment was conducted in an indoor environment and an outdoor space inside a university campus; the floor plans can be seen in Figure 8.
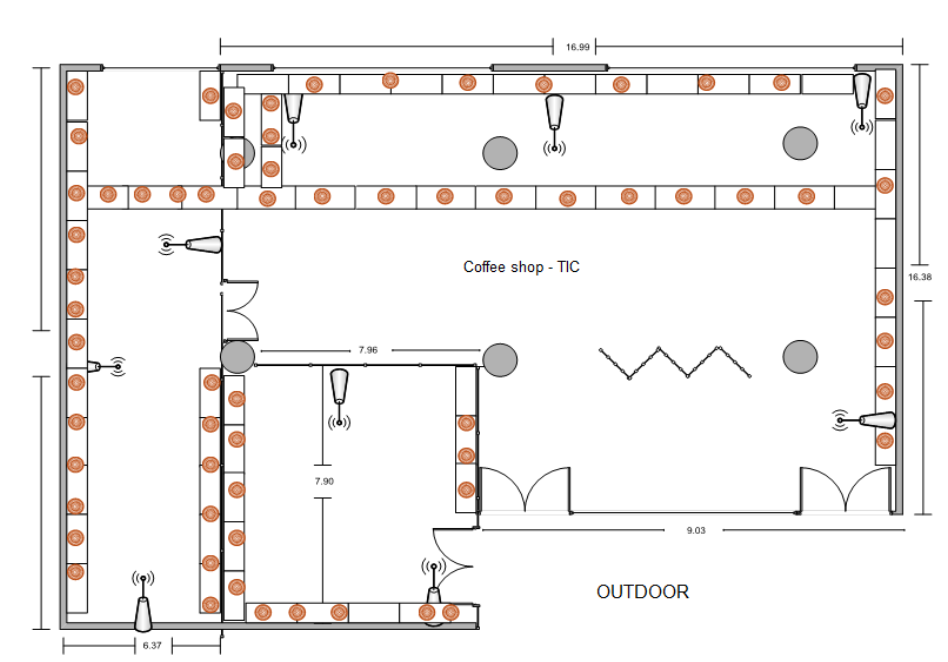
Source: Authors’ own work.
Source: Authors’ own work.
-The network was used to analyze two experimental scenarios: (1) a static con figuration where no node presents movement and (2) a mobile setting where the source and the target nodes can move.
-In the mobile scenario, the nodes move at a normal speed and, when they reach inflection points, they stop for a few seconds.
-The OLSR routing protocol was used for the multi-hop effect of mobility.
3.4 Experiment
This project evaluates a single response variable or metric of a MANET supporting real-time distance education services: the throughput. The latter is defined as the total data sent and received over a certain period as shown in equation 1. An efficient network achieves a better throughput, which is measured in bits per second. Table 2 details the usual operating values of such metric.
| Response variable (Units). | Confidence levels | Accuracy measurement | Relationship of the response variable with the objectives |
| Throughput (bps) | 90–95 % | ± 1 % | The measurement of throughput in telecommunications can be used to determine network performance |
3.5 Throughput Equation
Calculate Bandwidth-Delay product and TCP buffer size BDP (Bits of data in transit between hosts) = bottleneck link capacity (1):
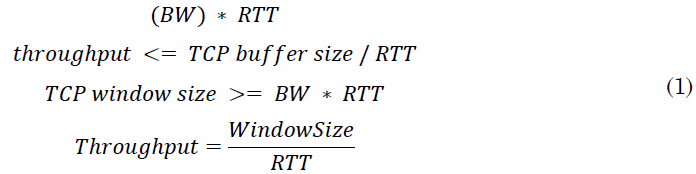
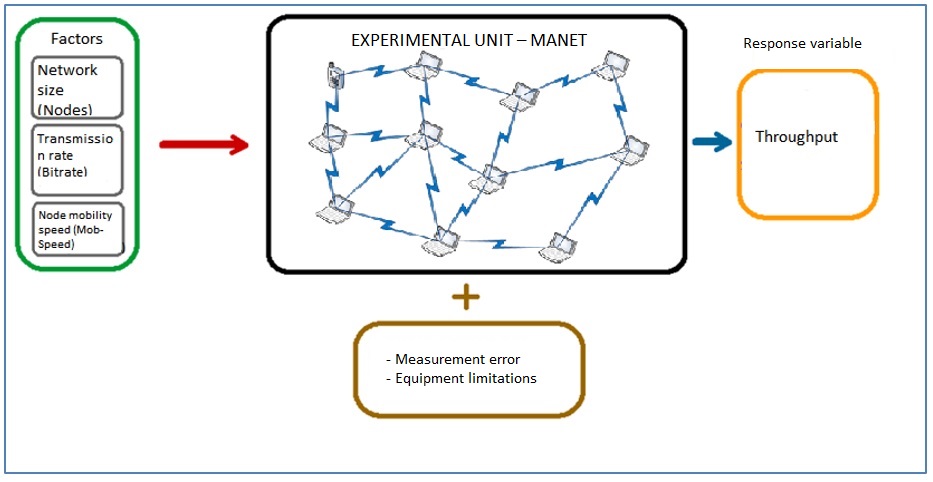
Figure 9 illustrates the system implemented to evaluate throughput. This system comprises three main components (factors, experimental unit, and response variable) and other secondary elements. A distance education service was provided through real-time video streaming using four cameras connected to a Digital Video Recorder (DVR) in the ICT/Electronics Lab. A lecture in each field was recorded, and the equipment (connected to a main computer with a UTP cable) generated the service, which was transmitted, through the network, to mobile devices located indoors and outdoors. Said devices were connected to the MANET and received the service via a web client application (npDvr).
The online service in the testbed was transmitted considering the parameters presented in Table 3. Each transmission session was controlled at the nodes by the SSH program, and the packets were captured using WinDump [
3.6 Design of the Factorial Combinations
In this paper, a 2k factorial design was implemented, where k = 3 factors and each factor had two levels (or values). The R statistical software enabled the creation of 23 = 8 design points, which are presented in standard order in Table 4. Each design point was evaluated in a real network scenario (testbed) with a replication of r = 3 times or number of factors. Each design point reflects the change in the network size (from 5 to 10 nodes). Point pairs 1-2/3-4, 5-6/7-8, and so on correspond to the change in the transmission rate (from a low to a high level). Additionally, point pairs 1-4/5-8 and so on denote the change in the nodes’ mobility speed (from low to high). The response value is also shown in Table 4. Such values resulted from the evaluation of the performance of a MANET supporting real-time distance education services.
| Factors | |||
| Design points | Nodes | Transmission rate | Node mobility speed |
| Low-level factor (-) | 5 | 250 kbps | 5 m/s |
| High-level factor (+) | 10 | 500 kbps | 10 m/s |
| 1 | (-) 5 | (-) 250 | (-) 5 m/s |
| 2 | (+) 10 | (-) 250 | (-) 5 m/s |
| 3 | (-) 5 | (+) 500 | (-) 5 m/s |
| 4 | (+) 10 | (+) 500 | (-) 5 m/s |
| 5 | (-) 5 | (-) 250 | (+) 10 m/s |
| 6 | (+)10 | (-) 250 | (+) 10 m/s |
| 7 | (-) 5 | (+) 500 | (+) 10 m/s |
| 8 | (+) 10 | (+) 500 | (+) 10 m/s |
3.7 Data Collection
The experiment was conducted in a real environment (or testbed). To obtain the throughput results, each of the eight design points was executed five times, and five runs were calculated per design point. The selection of the design points for the execution was based on the execution order created by Microsoft Excel® to randomize data. Thus, each of the resulting 96 runs of the experiment in the testbed (32 × 3) were executed for 300 seconds.
3.8 Data Analysis
Figure 10 presents the means of the main efects evaluated with the response variable, throughput. It can be inferred that the performance of the MANET is affected by network size and the transmission speed of the video streaming service it supports. Mobility speed has little or no impact because it is almost at the same level of the corresponding response variable, which can be seen in Figure 10.
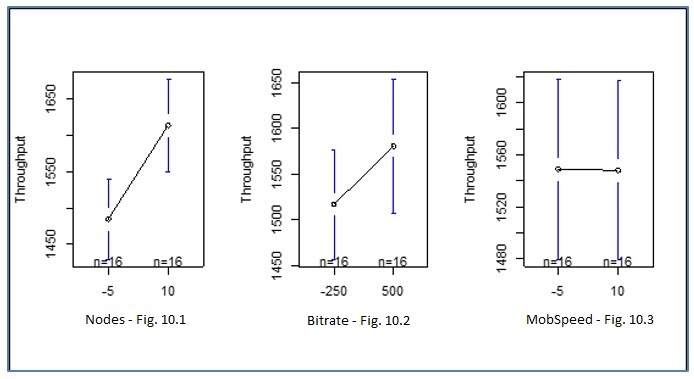
Figure 11 presents the interaction plots of the throughput results. Regarding two-way interactions, performance is affected by the combined effect of network size and transmission rate, as observed in Figure 11 and vice versa, as shown in Figure 11 The other interactions follow the same pattern.
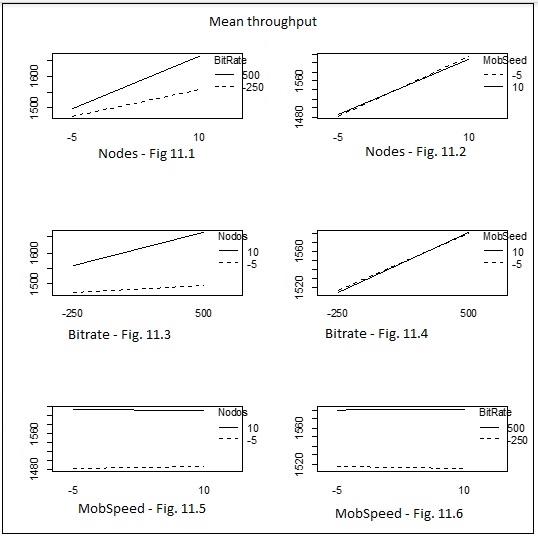
These interaction plots depict the effect of the combination of factors on the response variable.
Based on these results, it can be concluded that, in most cases, there is a significant effect due to the interaction between the factors. This conclusion is supported by the fact that the lines of each factor cross at some point. On the contrary, when they run parallel, there is a null interaction between the factors in each case.
Analysis of Variance (ANOVA) can be used to determine whether there are any statistically significant differences between two or more means in order to define whether the treatments have different effects on the response variable. The results obtained with this method can be employed to produce estimations and test hypotheses [
| Factors-Interactions | Df | Sum Sq | Mean Sq | F value | Pr(>F) |
| Nodos | 1 | 131970 | 131970 | 9.693 | 0.00473 |
| BitRate | 1 | 33476 | 33476 2 | 2.459 | ** |
| MobSeed | 1 | 2 | 2 | 0.000 | 0.12996 |
| Nodos BitRate | 1 | 14323 | 14323 | 1.052 | 0.99163 |
| Nodos:MobSeed | 1 | 205 | 205 | 0.015 | 0.31527 |
| BitRate:MobSeed | 1 | 23 | 23 | 0.002 | 0.90335 |
| Nodos:BitRate:MobSeed | 1 | 116 | 116 | 0.009 | 0.96771 |
| Residuals | 24 | 326753 | 13615 | 0.92713 |
To draw conclusions regarding significance, the p-value of each factor had to be evaluated based on the risk factor assumed by the researchers. The risk factor considered in the ANOVA model was 0.05. Therefore, it was necessary to verify whether the p-value of each factor was greater or lower than such value. If it was above such value, the effect of the factor was found to be NOT SIGNIFICANT; and if it was below such value, the effect of the factor was found to be SIGNIFICANT in terms of the variability of the response variable.
As observed in Table 5, the p-value of the Nodes factor is significantly lower than the risk value, which means that this factor has a significant effect on the variability of the response variable. The Nodes-Bitrate and Bitrate-MobSpeed interactions exhibit the same behavior. However, the effect of most factors and interactions is not significant, i.e., the variability of the response variable does not depend on them. In other words, modifying the levels of such factors and interactions at the same time will not produce a different result when compared to changing them one at a time. In ANOVA, the null hypothesis is rejected if the p-value is lower than 0.05.
After the model proposed in this study was tested through residual analysis, it can be concluded that:
The data obtained from the experiment were analyzed and validated using a statistical technique known as Analysis of Variance (ANOVA) to draw objective and subjective conclusions. A type I analysis was conducted in this study because the level of each factor applied to the experimental setup was previously selected by the researchers. However, to apply such methodology, the following conditions had to be satisfied: homoscedasticity (homogeneity of the variances), independence of the observations, and normal distribution of the error. This experiment passed all the corresponding tests.
To solve the problem addressed in this study, the model that describes the behavior of the response variable (throughput) was a balanced, completely randomized experimental design with three factors. In this design, the interactions between the different factors were assumed to be not null, and the DoE statistical model followed certain steps to confirm the corresponding hypotheses [
MANETs are efficient networks that can be very useful to train students in any type of environment (outdoors or indoors). Such efficiency was observed when the network size increased from 5 to 10 nodes, which resulted in a better performance, as can be seen in the plots of the main-effect means in Figure 10. This finding is supported by the hypothesis of the experiment and the validation of the model.
4. CONCLUSIONS
In this paper, the factors that affect the quality of communications in a tele-education environment could be determined. For this purpose, the quality of the service of a MANET supporting, in this case, a video streaming was evaluated based on throughput. Notably, the number of nodes was found to be the main factor leading to an improved performance of the MANET; it increased throughput by 14% when going from 5 to 10 nodes. The same happened with the transmission rate factor.
A methodology was developed in this study to assess the QoS of real-time distance education services. This methodology can be employed to analyze any other type of network or telematic service, as, in this case, we examined video streaming, which is one of the most complex services to study given its inherent characteristics. Additionally, it can be used to evaluate objective metrics for QoS decision making.
Moreover, the main interaction effects of performance metric on the response performance metric (throughput) were quantified using data obtained from a real environment.
Subsequently, a first-order linear regression model was designed, which incorporated the most influential factors and the performance metric. From the findings, it was concluded that network size and transmission rate affect the performance of a MANET.
According to the results obtained from the MANET implemented as the testbed, the network is dynamic, reliable, and efficient because it can easily adapt to any work environment (indoors or outdoors). Such results were supported by a DoE and validated using ANOVA.
5. FUTURE WORKS
At least two more metrics should be evaluated (e.g., PDR and routing overhead) to have more certainty about the behavior of a MANET and to obtain more accurate data that can be used to assess its QoS when supporting real-time distance education services such as video streaming. This research is part of a master’s degree project that aims at evaluating the quality of the experience in a MANET in terms of real-time video streaming.
Other factors (e.g., the distance between nodes and the strength of the wireless signal of mobile devices) could also have a significant effect on the performance of a MANET when supporting real-time distance education services, as, in this study, the experiment showed that the maximum distance between the nodes was approximately 50 meters within the line of sight. Therefore, said factors should also be evaluated.
Furthermore, the performance of a MANET supporting real-time distance education services may also be analyzed by implementing other (e.g., reactive or hybrid) protocols. With this, better results could be obtained leading to a lower message overload and a more optimal routing management in this type of network. In this study, only the proactive routing protocol, OLSR, was employed because it was the most compatible with the devices and operating systems used to carry out the experiment.
6. ACKNOWLEDGMENTS
First and foremost to God, the supreme source of all wisdom and the light and guide of our purposes; to the Almighty who guided our path to achieve the publication of this article and make our dreams come true.
To our families, as the cornerstone that holds such an outstanding accomplishment.
To our ITM teachers and the translation team, who have also contributed to this significant stage of our lives and hopefully to many others to come.
This article is not financially supported by any public or private funding agency or institution.
CONFLICTS OF INTEREST
None declared
7. REFERENCES
- arrow_upward [1] M. A. Jubair et al., “Bat Optimized Link State Routing Protocol for Energy-Aware Mobile Ad-Hoc Networks,” Symmetry., vol. 11, no. 11, p. 1409, Nov. 2019. https://doi.org/10.3390/sym11111409
- arrow_upward [2] M. Rath; B. Pati; B. K. Pattanayak, “Cross layer based QoS platform for multimedia transmission in MANET,” in Proceedings of 2017 11th International Conference on Intelligent Systems and Control, ISCO 2017, Coimbatore, 2017, pp. 402–407. https://doi.org/10.1109/ISCO.2017.7856026
- arrow_upward [3] G. A. Walikar; R. C. Biradar, “A survey on hybrid routing mechanisms in mobile ad hoc networks,” Journal of Network and Computer Applications, vol. 77. pp. 48–63, Jan. 2017. https://doi.org/10.1016/j.jnca.2016.10.014
- arrow_upward [4] A. Tiwari; M. Fatima; M. Manoria, “Survey of Impact of Transmission Range on MANET Routing Protocols,” Communications on Applied Electronics (CAE), vol. 7, no. 4, Jul. 2017. https://caeaccess.org/archives/volume7/number4/tiwari-2017-cae-652643.pdf
- arrow_upward [5] K. S. Ibarra-Lancheros; G. Puerto-Leguizamón; C. Suárez-Fajardo, “Quality of service evaluation based on network slicing for software-defined 5G systems,” TecnoLógicas, vol. 21, no. 43, pp. 27–41, Sep. 2018. https://doi.org/10.22430/22565337.1066
- arrow_upward [6] B. A. S. Roopa Devi; N. S. kaylyan Chafravarthy; M. N. Faruk, “Analysis of Manet Routing Protocol in Presence of Worm-Hole Attack Using Anova Tool,” International Journal of Pure and Applied Mathematics, vol. 117, no. 15, pp. 1043- 1054, 2017. https://revistas.itm.edu.co/index.php/tecnologicas/article/view/1719
- arrow_upward [7] A. Hamza-Cherif; K. Boussetta; G. Diaz; F. Lahfa, “Performance evaluation and comparative study of main VDTN routing protocols under small- and large-scale scenarios,” Ad Hoc Networks, vol. 81, pp. 122–142, Dec. 2018. https://doi.org/10.1016/j.adhoc.2018.07.008
- arrow_upward [8] M. S. Daas; S. Chikhi, “Response surface methodology for performance analysis and modeling of manet routing protocols,” Int. J. Comput. Networks Commun., vol. 10, no. 1, pp. 45- 61, Jan. 2018. https://doi.org/10.5121/ijcnc.2018.10104
- arrow_upward [9] K. Sahithi, “Taguchi Design of Experiments for optimizing the Performance of AODV Routing Protocol in MANETS,” Int. J. Eng. Res. Technol., vol. 7, no. 04, pp. 519–527, 2018. https://www.ijert.org/taguchi-design-of-experiments-for-optimizing-the-performance-of-aodv-routing-protocol-in-manets
- arrow_upward [10] D. Betancur-Calderón; J. Moreno-Cadavid, “Una aproximación multi-agente para el soporte al proceso de extracción- transformación-carga en bodegas de datos,” TecnoLógicas, no. 28, pp. 89-107, Jun. 2012. https://doi.org/10.22430/22565337.15
- arrow_upward [11] J. T. Buitrago-Molina; J. S. Carvajal-Guerrero; C. A. Zapata-Castillo, “Plataforma virtual para el mando local y remoto de un brazo robótico de apoyo para la educación en ingeniería,” TecnoLógicas, vol. 17, no. 32, p. 67-74, Jan. 2014. https://doi.org/10.22430/22565337.206
- arrow_upward [12] A. O. Montoya B.; M. A. Muñoz G.; S. T. Kofuji, “Performance analysis of encryption algorithms on mobile devices,” in Proceedings - International Carnahan Conference on Security Technology, Medellín 2014. https://doi.org/10.1109/CCST.2013.6922058
- arrow_upward [13] B. Ospina, “Evaluación de la calidad de experiencia (QoE) de Servicios de Tele-educación en tiempo real soportados en redes móviles AD-HOC (MANETs),” Biblioteca digital de la UdeA, 2016. http://bibliotecadigital.udea.edu.co/bitstream/10495/13260/1/OspinaCifuentes_2016_Evaluaci%C3%B3nCalidadExperiencia.pdf
- arrow_upward [14] E. A. Carchipulla Morocho; V. Peralta Navarro, “Tele-educación como servicio (TEaaS) Proyecto integrador Dentalav alojado en la nube pública de Microsoft Azure,” Universidad Politécnica Salesiana, 2018.
- arrow_upward [15] S. Gogia, Tele-education in Fundamentals of Telemedicine and Telehealth, Academic Press, 2019, pp. 145–158.
- arrow_upward [16] R. K. McBain et al., “Impact of Project ECHO Models of Medical Tele-Education: a Systematic Review,” Journal of General Internal Medicine, vol. 34, no. 12 pp. 2842–2857, Dec-2019. https://doi.org/10.1007/s11606-019-05291-1
- arrow_upward [17] A. F. Silva; P. Neves; S. M. Rocha; C. M. Silva; A. A. Valente, “Optimization of continuous-flow heterogeneous catalytic oligomerization of 1-butene by design of experiments and response surface methodology,” Fuel, vol. 259, p. 116256, Jan. 2020. https://doi.org/10.1016/j.fuel.2019.116256
- arrow_upward [18] D. C. Montgomery, Design and Analysis of Experiments, Wiley Ninth Edition. 2017.
- arrow_upward [19] L. A. Bacci; L. G. Mello; T. Incerti; A. Paulo de Paiva; P. P. Balestrassi, “Optimization of combined time series methods to forecast the demand for coffee in Brazil: A new approach using Normal Boundary Intersection coupled with mixture designs of experiments and rotated factor scores,” Int. J. Prod. Econ., vol. 212, pp. 186–211, Jun. 2019. https://doi.org/10.1016/j.ijpe.2019.03.001
- arrow_upward [20] “npDvr software and downloads (CSDVR.exe).” 2.0. https://npdvr.software.informer.com/
- arrow_upward [21] “Olsr Switch.” http://www.olsr.org/docs/README-Olsr-Switch.html
- arrow_upward [22] N. Schweitzer; A. Stulman; T. Hirst; R. D. Margalit; A. Shabtai, “Network bottlenecks in OLSR based ad-hoc networks,” Ad Hoc Networks, vol. 88, pp. 36–54, May 2019. https://doi.org/10.1016/j.adhoc.2018.12.002
- arrow_upward [23] GitHub - ProjectSPAN/android-manet-visualizer: SPAN - Android Manet Visualization.” https://github.com/ProjectSPAN/android-manet-visualizer
- arrow_upward [24] Riverbed Technology “WinDump, version 3.9.5. 2018. https://www.winpcap.org/windump/